the Technology Transition Model (TTM), frames acceptance as a multiplicative function of the magnitude and frequency of the perceived net- value of a proposed ...
Proceedings of the 32nd Hawaii International Conference on System Sciences - 1999 Proceedings of the 32nd Hawaii International Conference on System Sciences - 1999
Lessons Learned Using A Technology Transition Model with the US Navy Robert O. Briggs, Mark Adkins, John Kruse, Jay F. Nunamaker, Jr. Center for the Management of Information University of Arizona Tucson AZ, 85721 Daniel Mittleman DePaul University Abstract There are several thousand group support systems (GSS) installations worldwide, and while that number is growing, This article presents a 32-month qualitative field investigation of an effort to introduce GSS into the daily work of the staff of the US Navy’s Commander, Third Fleet (C3F). Using the principles of action research, the project began with interventions based on the precepts of Davis’ [8] Technology Acceptance Model (TAM). The goal of the interventions was to engender sufficient acceptance for GSS to create a self-sustaining, growing community of GSS users. TAM was revised based on insights that emerged in the field. The resulting model, the Technology Transition Model (TTM), frames acceptance as a multiplicative function of the magnitude and frequency of the perceived netvalue of a proposed change, moderated by the perceived net-value associated with the transition period itself.
Introduction More than 15 years of research in the lab and in the field have shown that, under certain conditions, GSS can substantially improve team productivity [32;11;23;19;29;22;10;16;30;15]. There are now several thousand GSS installations worldwide, and that number is growing, but GSS has not yet achieved widespread acceptance in the workplace. At least part of the reason may be that it can take three years or more for an organization to complete a transition to GSS. We define transition as the period of time that starts when some person in an organization expresses interest in using a new technology and ends when a community of users has become self-sustaining. Long transition times may inhibit the widespread use of GSS technology in several ways. The technology may evolve faster than it can be assimilated into daily work practices. Short-term
Commander Scot Miller U.S. Navy, Commander Third Fleet financial constraints may dry up the resources required to sustain transition. Technology champions and experienced users may move on to other positions, leaving the technology to languish and die. Short transitions may mean more immediate benefit to the organization and more immediate return on the investment made by the technology creators, which may, in turn, lead to further technological advances. It may therefore be useful to understand why some technologies transition quickly, while others transition slowly, and why the same technology transitions quickly in some organizations and slowly in others
Overview of the Investigation This article presents a 32-month qualitative field investigation of an effort to introduce GSS into the daily work processes of the staff the U.S. Navy’s Third Fleet aboard the USS CORONADO. The principals of action research guided the investigation. With action research, one starts with a theory, and intervenes in a situation to improve both the situation and the theory [4;9]. This project began with interventions based on the precepts of Davis’ [8] Technology Acceptance Model (TAM). The goal of the interventions was to engender sufficient acceptance for GSS to create a selfsustaining, growing community of GSS users. The members of the research team had extensive experience with GSS. Beyond that they had a rich diversity of backgrounds. The team had extensive experience with previous GSS transition efforts at many organizations. The team members had facilitated thousands of GSSsupported meetings before the study presented here began. The value of TAM for predicting user acceptance and use has been supported by a number of empirical studies [6;8;20;21;24;1;7;31;28]. TAM was originally developed to predict futuretechnology-use after the first hour of exposure.
0-7695-0001-3/99 $10.00 (c) 1999 IEEE
1
Proceedings of the 32nd Hawaii International Conference on System Sciences - 1999 Proceedings of the 32nd Hawaii International Conference on System Sciences - 1999
We therefore did not expect it to offer a complete model for a complex, long-term technology transition project. Throughout the investigation, we revised and extended TAM based on insights that emerged in the field. The result was the Technology Transition Model (TTM), a broader model of technology acceptance that may be useful for reducing the duration and risk of technology transition projects. We used a variety of qualitative methods to inform the model, including surveys, structured and unstructured interviews, observations, archival research, case studies, systems development, and active intervention. This article briefly presents TAM, then argues the propositions of TTM in the context of the Third Fleet
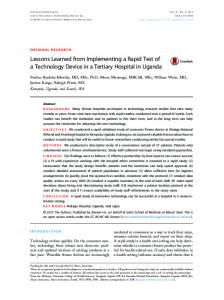
Technology Acceptance Model (TAM) TAM is a causal model of actual system use, the key indicator of success for technology transition. Perceived Usefulness (U) Behavioral Intentions’ (BI)
External Variables (X)
Actual System Use
Perceived Ease of Use (E)
The Technology Acceptance Model (TAM) From Davis, 1986, 1989, 1993 This figure illustrates the propositions of TAM [6;8]. It posits that actual technology use (AU) is directly caused by behavioral-intentions (BI), a measure of the strength of ones intentions to perform a specific behavior. Intention is a useful construct because it can be measured well in advance of actual use. TAM further posits that BI will be determined by two attitudes: perceived-usefulness (U) of the technology for getting the job done and perceived ease-of-use (E), or the degree to which using the technology will be free of effort. U and E may seem at first to be very similar, but they are quite distinct. U is the degree to which one believes that using the technology will lead to improved job performance: “Will I do my job faster? Will my boss be happier with my results?” On the other hand, E is the degree one believes the technology will leave ones mind free to work. “Will I remember how these menus work? Will I have to fight with the network?” TAM proposes that a myriad of external variables (X) like system-design-characteristics and self-efficacy may combine to change one’s
perception of usefulness and ease-of-use. The model also posits that an increase in E should cause an increase in U. The unspoken assumption underlying this proposition may be that cognitive resources are limited, therefore the cognitive load imposed by the tool will interfere with task performance. If the tool is easy to use, it will be more useful for the task than if it is hard to use. TAM does not explore the mechanisms by which X may affect U and E. The model may summarized: AU ≅ ƒ(BI) ≅ ƒ(U, E, X). Where BI is Behavioral Intention, U is Perceived-Usefulness, E is Perceived-ease-of-use X is external variables. During this and previous studies, following the precepts of action research, first a theory, TAM, which guided intended to influence the perceptions of ease-of-use and usefulness among the staff at Third Fleet.. During this project a new, somewhat richer model emerged. We call it the Technology Transition Model (TTM). As the project progressed we extended the model to explain events for which TAM did not account. The result is the Technology Transition Model (TTM) While TTM springs from TAM, it does not replace it. TAM predicts and explains a state-of-mind achieved after a one-hour exposure to technology; TTM attempts to explain what causes a group of technology users to become self-sustaining. The next section argues the propositions of TTM. A description of the critical incidents that gave rise to the model appears in a later section.
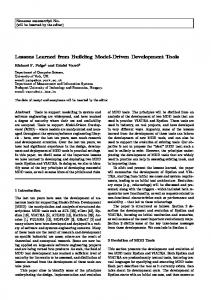
The Technology Transition Model The following figure illustrates the fundamental propositions of TTM.
0-7695-0001-3/99 $10.00 (c) 1999 IEEE
2
Proceedings of the 32nd Hawaii International Conference on System Sciences - 1999 Proceedings of the 32nd Hawaii International Conference on System Sciences - 1999
Like TAM, TTM posits that actual system use is a function of Behavioral Intentions (B). However, it posits that B will be a multiplicative function of perceived-magnitude -of-net-value and perceived-frequency--of-net-value. Perceived-Magnitude-of-Net-Value Perceived-magnitude-of-net-value (M) is an attitude, a valanced subjective assessment of the probable consequences of changing from existing technology to the proposed technology. Note that M is not a measure of how big the differences will be, but of how the prospective user feels about those differences. Upon being exposed to the technology, prospective users will synthesize a holistic sense of how their lives will be different if they change to the new technology. That perceived difference will evoke a valanced affective judgement, for example, on the whole, this will be good for me, or perhaps, life is going to get a lot worse. That response will have some magnitude – large or small, and it will have some valance or direction – positive or negative.
Dimensions of Net-Value There may be a number of dimensions for perceived-magnitude-of-net-value. Davis [6;8;7] identifies a most prominent instance of perceived-value as usefulness, the degree to which the user believes the technology will enhance job performance. If the user thinks the new tool will greatly improve job performance, this might be an instance of a positive perceivedvalue. However, there are other dimensions of perceived-value:1.Affective; 2.Economic; 3. Physical; 4.Political; 5. Social; 6. Cognitive Prospective users may synthesize a variety of competing values of different magnitudes and directions into an overall assessment. For example, the uses might believe that a new technology would substantially improve organizational profitability (large positive economic value) but that it might cause the users to lose a modicum of influence with managers (small negative political value). They might find the new system somewhat more awkward (small negative cognitive value) and therefore a lot more frustrating (big negative affective value) than the present system. However, it might be that the new technology provides a forum for more frequent exchanges of ideas among friends (modest positive social value). In the end, the prospective users generate an overall net assessment of how much they will like or dislike the changes engendered by the new system. We call this final assessment the perceived-
magnitude-of-net-value of the change (M). M may be positive or negative. M pertains to a comparison of the existing system to the proposed system. It is a net assessment, not an absolute assessment. For example, the old system might be terribly difficult to use, a negative cognitive value. The new system might also be hard to use, also a negative cognitive value in absolute terms, but if it does not seem as hard to use as the old system, the result may be perceived as a net positive cognitive value. We have identified at least three dimensions of cognitive value: technical, access, and conceptual. Technical value derives from changes in the difficulty of manipulating the technology. Access value derives from changes in the cognitive load of gaining access to and permission to use the technology – the so-called hassle-factor. Conceptual value derives from changes in the cognitive load of understanding what the tool is supposed to do for the user. TTM posits that any number of factors external to the individual may be perceived as creating positive or negative value along one or more dimension in one or more directions simultaneously. Thus, in TTM the dimensions of value subsume and explain the effects of the external factors, so there is no separate construct in the model to represent them.
Perceived-Frequency-of-Net-Value Users also consider how frequently (F) they expect to derive the net-value they perceive. Will they derive value moment-to-moment? Daily? Twice a year? TTM posits that F and M combine multiplicatively to cause B. F may be zero or positive, it cannot have a negative value because there is no frequency less than zero occurrences per time unit. No matter how high M becomes, if F is zero, B will be zero. Likewise, no matter how high F becomes, if M is zero, B will be zero. A small positive perceivednet-value obtained frequently may lead to a positive B. Likewise a large positive M and a low F may lead to a positive B. If M becomes negative, BI may also become negative, and the user may actively avoid system use. Thus, the relationship between F, M, and B may be expressed: B ≅ ƒ(F * M) Among other things, this model suggests that a frequent minor irritation, say, having to reset a server twice a day, may be sufficient to outweigh larger, but less-frequent benefits.
Perceived-Net-Value-of-Transition
0-7695-0001-3/99 $10.00 (c) 1999 IEEE
3
Proceedings of the 32nd Hawaii International Conference on System Sciences - 1999 Proceedings of the 32nd Hawaii International Conference on System Sciences - 1999
But what of a technology that engenders a small positive M and a low F? Will it be accepted? That may depend on perceptions of switching costs and benefits. TTM posits that users also attend to the perceived-net-value-of-transition (T) when choosing whether to accept a new technology. While F and M relate to a comparison of the existing system to the proposed system, T represents the value derived from the transition activity itself, apart from the value the new system will deliver. T represents a valanced synthesis of affective responses to switching-costs and switching-benefits. For example, the learning curve for the new system would represent a negative cognitive value. On the other hand, a trip to San Francisco for training classes might be perceived as having positive economic, affective and social values. Being regarded by one’s boss as the project champion for new technology might offer positive political and social values, while having to shepherd the multitude of technical difficulties of establishing the new system might be a negative cognitive value. In the end, the prospective user will synthesize the perceived values associated with effecting the change into a subjective judgement of the net-value-oftransition (T). They will weigh T against the value of (F * M). If T is larger, the user may elect not to use the system. Thus a low F, low M system may not be accepted unless T is also very low. The future benefits must outweigh the switching costs. Thus, the relationship between F, M, and B will be moderated by T: B ≅ ƒ(F * M – T)
Certainty People develop their attitudes toward a new technology based on their exposure to it. We identified three kinds of exposure: testimony, observation, and experience. Testimony may be as informal as a conversation at a water cooler or as formal as refereed academic article. Observation may be range from a glimpse of a video clip to a several days of watching over people’s shoulders as they use the technology. Experience may range from a few minutes of hands-on playing to days of intensive use for mission-critical applications. Whatever the form of exposure, the prospective user will use it to form some assessment not only the magnitude of the perceived-net-value, but also some degree of certainty (C) about that assessment. Certainty is a subjective probability that an expected net-value will actually be
obtained. Certainty may take on a value from 0.0 to 1.0. Certainty acts as a multiplicative moderator on M with respect to BI, thus: B ≅ ƒ (((M * C) * F)) – T) Which may be rewritten: B ≅ ƒ(MCF – T) Like TAM, TTM posits that Actual Use (A) is a function of Behavioral Intention (B), thus the complete model would read A ≅ƒ(B) ≅ ƒ(MCF – T) Having laid out the arguments of TTM, this article will now turn to exploring the derivation of the model. The next section presents the context and critical incidents of the qualitative investigation from which the model emerged.
The Third Fleet Context Faced with a growing need for rapid response to crises, the U. S. Department of Defense (DoD) began to foster collaboration among the four services by forming Joint Task Forces (JTF). A JTF Commander (CJTF) is typically a three-star Admiral or General who might come from any of the four armed services. When a crisis erupts, the national command authority appoints a CJTF. The CJTF designates two-star admirals and generals as Component Commanders for the air, ground, and naval resources. In part to overcome diminishing resources overseas, U.S. Navy has established a series of Command Ships, equipped to support a CJTF, the component commanders, and their staffs. The Command Ships provide a fully equipped and staffed mobile joint command center on sovereign U.S. Territory that can be moved onstation into position within 12 miles of any coastline on short notice. Traditionally, the U.S. armed forces have looked to technology as the “force multiplier” to win the day while minimizing risks to the army or fleet. The latest wave of technology sweeping through the warfighting community is that of Command, Control, Communications, Computers and Intelligence (C4I). Just as simple communications devices such as radios changed the very nature of the battle, the computer is expected to change all facets of the military. Third Fleet’s flagship, the USS CORONADO (AGF 11) was an aging amphibious assault ship already slated to be decommissioned. It rarely left the dock. People began to refer to it as “Building 11, and USS Neversail.” In the mid1990s life at C3F changed radically when it was assigned operational responsibility for the defense of the Eastern Pacific, an area encompassing of 50 million square miles. In 1995 C3F was designated as an alternate Commander, Joint Task Force (CJTF), and the
0-7695-0001-3/99 $10.00 (c) 1999 IEEE
4
Proceedings of the 32nd Hawaii International Conference on System Sciences - 1999 Proceedings of the 32nd Hawaii International Conference on System Sciences - 1999
decision was made to rework the old flagship into a new, state-of-the-art Command Ship. C3F staff is divided into functional units identified by numbered codes. Each code has a particular functional responsibility identified by its number: J1 handles administration, J2 collects and disseminates intelligence, J3 conducts operations, J4 manages logistics, J5 directs planning, J6 oversees of C4I. Each J code has an Assistant Chief-of-Staff (ACOS). High turnover among leaders created a particular challenge for the GSS transition team given that most or all of the officers were likely to finish their tours of duty and rotate out before the GSS transition was complete. The initial survey of the CORONADO revealed that there were no appropriate spaces for using collaborative technology. Noise in the workspaces from the ship’s ventilation system caused unacceptable disruption. Further, a group of more than six or eight people had no meeting place on the ship that did not have a constant stream of other people with legitimate needs to walk through it frequently, which disrupted collaborative work. Finally, there was no place on the ship where a team could sit down and both see one another and their computers. The inadequate decision spaces posed a serious perceived-ease-of-use barrier. The transition team refrained from demonstrations, opting instead to find real tasks to which the GSS could be applied at C3F. There was mixed reaction to GSS among the ACOSs. The Chief-of-Staff and J6 expressed enthusiasm for the efficiency enabled by J6, and both chose to use GSS again for subsequent tasks. However, during anonymous on-line feedback, and later during oral discussions and interviews, several of the participants expressed a lack of enthusiasm for the way their oral interactions had been curtailed during the activities supported by GSS.
Civil Military Operations Center The first facility completed was the Civil Military Operations Center (CMOC, pronounced see-mock). It was a small space, measuring only 14 X 20 feet, with workstations for only 8 participants. The CMOC was to be the workspace for representatives of foreign and non-military organizations who might embark to help address a crisis. The space was laid out with a clear power-seat at the head of the table, to help heterogeneous teams quickly to establish a group structure.
Within a short time of becoming operational, the CMOC was in demand by C3F staff. At first this appeared to have less to do with the perceived value of the GSS, and more to do with the perceived value of the space. It was quiet, it had no through traffic, it had GSS and all the latest collaborative technology, and it had “these university geeks who would help you plan and execute a meeting.” The participants were at first tolerant of the GSS, and then came to value it for some tasks. During its first year of operation, the CMOC came to be used 12-14 hours per day whenever the ship was at sea. Teams as large as 20 people began to use the small facility on a regular basis. Eight people would sit at the permanent workstations, the rest would stand behind in the narrow aisles and contribute aloud. People seated at the workstation would add key issues from the oral discussion to the on-line interaction. Staff members began regularly to seek out the transition team to request GSS support for their activities. The term, CMOC, became a synonym for collaborative technology. Despite its apparent success, a self-sustaining community of GSS users did not coalesce around the CMOC. Quite the opposite; after a whirlwind year of continuous use, if a member of the transition team were not available to plan and execute the GSS task, the GSS still got no use. Few officers who had been trained to use the CMOC and the GSS became active facilitators; all continued to call on members of the transition team to run GSS-supported projects. Interviews with the staff revealed that perceivedusefulness was high, but perceived costs were also high, particularly perceived-technicaldifficulty and perceived-concept-difficulty. The perceived-technical-difficulty arose not from the GSS, but from all the gadgets in the CMOC. The devices were controlled by an array of buttons and switches, levers and blinking lights. People who did not use the room daily quickly forgot which buttons controlled which devices. Even the room designers had difficulty if they did not use the space for a week or two. Subsequent spaces were designed with simpler control systems. Staff members also reported concept-difficulty with respect to the GSS. The training focused on a rich array of group dynamics that could be created by subtle manipulations of GSS features. With little experience they were dismayed by the possibility of accidentally and publicly creating a
0-7695-0001-3/99 $10.00 (c) 1999 IEEE
5
Proceedings of the 32nd Hawaii International Conference on System Sciences - 1999 Proceedings of the 32nd Hawaii International Conference on System Sciences - 1999
group-dynamics disaster. Subsequent training efforts focused on a few simple, useful, and predictable processes as a starting point. The trainers also began to socialize the trainees to expect and accept the need to restart a process if it seemed to be going astray. Trainers pointed out that there was very little cost to a GSS missstep. If the group started contributing too much detail, or too little substance, or misunderstood the question, the leader would know it almost immediately. Within moments the leader could reframe the question and restart the group. The loss of a few minutes was minor compared to the loss of hours that often accompanied standard meetings. Another difficulty related to the intervals between GSS exposures, which continued to be long. Although the staff was using the CMOC nearly continuously, its use was spread across a number of subgroups. A particular subgroup would only use the GSS every few days or weeks. In the interval between uses they would forget the details of how to operate the CMOC and the GSS. They would therefore seek out the transition team to support each new task. It was several months before a group emerged that needed to use the GSS daily. The J2 Intelligence group wanted to use it as a collaborative logbook. The J2 GSS transition took a different course than did that for the rest of the fleet. The next section describes the details of the J2 experience.
A senior enlisted man on the J2 staff volunteered to provide technical support for the system, and received three hours of formal training. At the end of the first exercise the J2 ACOS declared publicly and repeatedly that the collaborative logbook to be the single most-important tool to come into the intelligence spaces during his career Several factors appeared to contribute to the rapid transition of GSS in the J2 community. The benefits were obvious, substantial and immediate: no more running up-and-down ladders, and a dramatically reduced situational awareness cycle. The cognitive costs were low, particularly for perceived-technical-difficulty and perceived-concept-difficulty. The users had only to click an icon to run the system. They were using the tool for an easy-to-understand task: keeping a logbook; not the conceptually difficult task of managing group dynamics. Further, the users needed the technology minuteto-minute, all day long rather than once every few days or weeks. Finally, the collaborative log provided a forum for increased social interaction among the J2 staff, which some reported as a perceived-benefit. When the CORONADO’s Joint Operations Center (JOC) became operational, the collaborative logbooks diffused quickly from J2 into other parts of C3F. The following section describes the JOC and the events leading up to adoption of GSS by C3F.
J2: A Rapid Complete GSS Transition
The Joint Operations Center
J2 operated as a geographically distributed team because they were scattered among six small, noisy spaces across several different decks of the ship. The senior intelligence watch officers found it challenging to maintain an up-to-theminute awareness of the battle situation with staff members spread across the ship. Situational awareness cycles could be as long as half-anhour. The J2 proposed to use the GSS as a collaborative logbook to link his spaces. He proposed to hold an ongoing 24 hour per day distributed meeting to share information and analysis. When a watch-stander spotted a key piece of information, he or she would type it into the GSS. It would immediately be available to analysts in the other spaces. Analysts would enter their interpretations of the information, and the senior watch officer would synthesize a situational assessment on the same electronic page. The situational awareness cycle was reduced to under a minute.
The JOC became the catalyst for the diffusion of GSS throughout the CORONADO. The JOC was designed to be the nerve center for the JTF. The CJTF needs a centralized clearinghouse for all of the information that that comes from the staff, the national command structure and the component commanders. At any time, the CJTF can enter the JOC to get a briefing from the Battle Watch Captain (BWC) about the status of any aspect of an emerging crisis. This enables the CJTF quickly to make informed decisions about mission-critical events and resources. The BWC acts on behalf of the CJTF to prosecute the crises when the CJTF is away from the JOC. The JOC is equipped with two rows of workstations facing the forward wall. The front row has eight workstations that are used by tactical specialists to track the positions of friendly and enemy sea, air, and land forces
0-7695-0001-3/99 $10.00 (c) 1999 IEEE
6
Proceedings of the 32nd Hawaii International Conference on System Sciences - 1999 Proceedings of the 32nd Hawaii International Conference on System Sciences - 1999
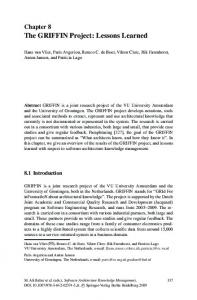
The tactical watch positions in the (JOC) aboard the USS CORONADO Most modern command centers have such tactical displays. However, the six workstations, or anchor desks, in the back row of the JOC are the first of their type among military command centers. Experienced, battle-qualified officers with authority over key resources and processes stand watches at the anchor desks. Each desk attends to a different set of issues – C4ISR, Logistics, Intelligence, Weather, Undersea Warfare, and Plans. The desks are linked via collaborative technology to staff in other parts of the command ship and across the Fleet. This makes the anchor an agent for obtaining and filtering information to be fed to the Battle Watch Captain (BWC). The anchors gather information from staffs and from on-line resources. Because the anchors are in are in the JOC, each maintains a fairly complete battle picture as the operation unfolds. The BWC can anticipate the CJTF’s information needs and direct the operation.
Command-Net When the JOC first became operational, only the Intelligence community had collaborative technology for their anchor desk. Before the first exercise the C4I community also requested a collaborative log to link personnel at eight sites across the ship. While the C4I log was being installed, the battle watch captain inquired about it, and then requested a collaborative log for the BWC. That log was also placed on the desk of the admiral, the chief of staff, all the ACOSs, and on the desks of the component commanders. Upon seeing the battle log, both the Air and Land component commanders requested their own collaborative logs. Within days more than 100 nodes on the ship were linked into one or more of the five collaborative logbooks: BWC, Intel Log, Land Forces Operations Center, C4I log, Joint Air Operations Log. The admiral typically kept three of the five open on his desk almost continuously. The collection of collaborative
logs came to be called COMMAND-NET. Each COMMAND-NET log quickly developed its own subculture. The intelligence log remained freewheeling and conversational. The Battle Watch log was regarded as a legal document so it evolved into restrained, formal record of notable events. The LFOC log operated as an informal clearinghouse for information about the current status of troops and equipment. The Joint Air Operations log became a communication channel between the Joint Air Operations Center and the Fleet Fires cell in addition to a record of loggable events. Two of the watch standers in the JOC also noted in separate interviews that the collaborative log had reduced the number of visits from the admiral. Both reported that they missed having the admiral drop by to talk with them1. This may be an example of a perceived small negative social or political value.
Operation Pax In the summer of 1998 the CORONADO deployed to the Western Pacific for Operation Pax. Officers from allied countries temporarily joined the Third Fleet staff for a joint exercise involving 50 ships from seven countries When the exercise concluded, the admiral, the chief-ofstaff, and many other COMMAND-NET users reported that the BWC log had become an indispensable, mission critical tool.
Adoption Navy personnel have a saying: “If the boss is interested, I’m excited.” In a morning staff meeting the admiral asked a senior officer whether the courses-of-action being briefed had been generated using the GSS in the CMOC. The officer replied, “No Sir.” The admiral asked, “I’d like to know why not? We have a fine capability there and we ought to be using it to our best advantage.” The transition team marked this event as the moment when GSS was formally adopted by the Fleet. A short time later a Special Operations Forces (SOF) officer broke into the CMOC with a small group and commandeered it to write an operations order. A transition team member found them struggling with the system and gave 1 Navy personnel reported that this admiral had a particularly strong rapport with the members of his staff. He was regarded as a mentor, so people looked forward to interacting with him. They reported that in many other settings a reduction of interruptions by flag officers would be perceived as a positive value.
0-7695-0001-3/99 $10.00 (c) 1999 IEEE
7
Proceedings of the 32nd Hawaii International Conference on System Sciences - 1999 Proceedings of the 32nd Hawaii International Conference on System Sciences - 1999
them about five minutes of assistance, after which they were able to finish on their own. The SOF officer had previously been something of a vocal technophobe. A few days later he returned to conduct another short collaborative writing project. A liaison officer from another branch of the military who had been negative about GSS from the start of the project asked to have a collaborative log established for the Coalition Exercise Control Group (CECG, pronounced keg). The CECG was the team that controlled the play of the exercise. They fed information to the forces on both sides of play to ensure that all of the scheduled training events would take place as the scenario played out. He objected to an overdependence on technology. He asserted that war was a messy, chaotic, brutal business, and that people had to be ready to win without technology. When he asked for the CECG log, he said, “I still don’t like it, but I need it.” After the exercise the liaison officer reported that he found COMMAND-NET to be useful, and he suggested several improvements. He reported that he was looking forward to beta-testing the next generation of software. As Pax ramped up several more groups asked the transition team to assist with collaborative decision-making and planning activities. Exemplars of those activities are described in the next section.
Post-adoption diffusion During Pax the CMOC was in regular use. At this point all collaborative activities were run at the request of the users; the technology transition team no longer had to sell each session. The fleet established a new Current Operations (COPS) team which met every day. COPS had members from all participants of the exercise, other services and coalition nations. The COPS team was charged swiftly to develop and execute solutions to significant real-life issues that emerged during the exercise. For example, when a hurricane threatened to move into the exercise area, the team quickly developed action lists and contingencies for dealing with the possible consequences of the storm. In the course of the exercise the team developed and refined a GSS method for rapidly developing and thoroughly examining possible courses-of-action (COAs). Without the GSS the team typically spent about an hour-and-a-half developing three COAs. One of those three would always be a throwaway “do nothing” option. Another would be a carefully considered option, and the third would be a less-
developed, often less-useful option. Using the GSS the team created six options, considered their pros and cons, and ordered them from most useful to least-useful, all in half-an-hour. The head of the Fleet planning department declared at a morning meeting that the technology was invaluable. Toward the end of Pax, the COPs used the CMOC to compose a comprehensive document about the lessons learned during the exercise. A ten-person multi-national sub-team used `the group outline tool to create eleven major headings for the document. Then, in approximately 45 minutes they recorded and organized 142 lessons learned. In 75 minutes the team completed a task on which they expected to spend a day-and-a-half. C3F J5 Planning group created a lessinvolved COA development method for use by their planners. The J4 Logistics group used the CMOC and the GSS to make plans for taking the ship into the shipyard for repairs and maintenance. Coalition forces used the CMOC for a variety of problem-solving and planning tasks. In each case the participants reported dramatic reductions of time-on-task and substantial improvements in product quality.
State of the Project The COMMAND-NET installations are clearly self-sustaining. The Intelligence and Battle Watch logs serve as ready examples for each new component commander that comes aboard. New logs stand up, then disappear, as the demands of each exercises require. It is hard to say if the CMOC’s tranisiton is complete. C3F personnel now regard the CMOC and its technology as part of their standard work practices. And yet, still depend heavily on the transition team to support them with the technology rather than supporting it for themselves. From the point of view of the staff, the transition is complete. They openly refer to the transition team as members of C3F. After three years the transition team has been aboard the ship longer than most members of the staff. However, in order to declare the project a success, the transition team must pull out and leave behind a self-sustaining community of users. The multimedia display technology and the networks in the CMOC are still too complex and too unstable to be left without the ministrations of an experienced technologist. To date the transition team has not been able to find or train such a person from the Fleet Staff.
Lessons Learned
0-7695-0001-3/99 $10.00 (c) 1999 IEEE
8
Proceedings of the 32nd Hawaii International Conference on System Sciences - 1999 Proceedings of the 32nd Hawaii International Conference on System Sciences - 1999
This section compares the COMMAND-NET and CMOC transitions to catalog the lessons we learned about GSS transition. In 1996 Nunamaker et al [22] published an exposition of 53 lessons learned about GSS from experience in the field and the lab. Events in this investigation were consistent with most of those lessons.
Perceived-Frequency-of-Net-Value Lesson 1.0 Infrequent ad hoc use hinders selfsustainment. TTM posits that acceptance will depend in part on the frequency with which prospective users expect to derive value from a new technology. The COMMAND-NET users perceived benefits hour-to-hour and moment-tomoment, while individual CMOC users typically needed the technology once or twice a month. Lesson 1.1 If possible, find a specific, repeated process to support with GSS. C3F intelligence community had a clearly defined situational awareness process that cycled many times per day. CMOC users did not. Experience at other sites has shown similar transition successes for teams working on specific repeated processes. Lesson 1.2 If you want to do ad-hoc problem solving, find the resources for GSS specialists to support it. The CMOC was designed for ad hoc problem-solving, a critical function for the Fleet. However, because the CMOC serves the needs of many subgroups, no one subgroup has the resources to provide a full-time specialist to support it. The transition team must now focus on replacing themselves with personnel from within the fleet.
Perceived Cognitive Value Lesson 2.0 Keep it simple. COMMAND-NET users reported very low conceptual load for their GSS use. They also reported low access loads and low technical difficulty. CMOC users, on the other hand, required greater GSS flexibility. It appears that the conceptual variety and complexity of the CMOC tasks may have caused a spillover perception that the software itself was technically difficult to use. Lesson 2.1 Err on the side of simplicity when equipping collaborative workspaces. We found that when the hardware was too hard to use, people would not use the software either. Furthermore, It may also be possible that technical difficulties with CMOC equipment led to increased perceptions of GSS technical difficulty. Lesson 2.3 The pre-meeting plan is vital, but don’t go overboard. It is accepted as given among experienced GSS users that a pre-activity
plan is vital to the success of a GSS activity. In fact very few unplanned GSS activities result in disaster. Rather, a vaguely planned activity typically leads to a few minutes of confusion and lost effort. Lesson 2.4 People don’t always notice the benefits they derive. GSS users didn’t always notice the benefits they were deriving. When asked how the GSS was working out, they would sometimes respond with something like, “It’s OK, I guess.” When the GSS team asked whether they could have accomplished the same about of work without the GSS, the users would become aware the value they had derived. Lesson 2.5 The non-typist is dead, long live the typist. It was not necessary to simplify the technology to the point of eliminating the keyboard. Throughout the project more than 100 admirals, generals, captains and colonels used the technology. Not one evidenced any reservations about using a computer keyboard. Lesson 3.0 Sometimes usefulness takes a back seat to other considerations. For the COMMAND-NET users, who primarily needed the visible products of the GSS, the utility of the technology clearly drove their acceptance. For the CMOC users, who needed the more sociallyand politically-sensitive invisible products, usefulness was not the only consideration. Considerations that had little to do with utility were often substantial acceptance issues. Lesson 3.1 Usefulness varies with time pressure. Earlier field investigations have reported that under some circumstances GSS usage can reduce labor costs by 50% and project cycle times by 90% (e.g. [11;18;26]). We found that when teams typically reduced by 2/3 rather than by 90%.
Conclusions and Future Directions This paper describes the derivation of TTM from action research in the field. The model may help explain technology acceptance among groups of users in groups and organizations. It may be useful for increasing the speed and reducing the risk of technology transition. However, much work remains to be done before TTM can be judged useful. The next important step for this model must be to develop and validate measures for the crucial causal relationships proposed by the model. TTM must be tested empirically with experiments in the lab and with field-studies to see whether new data support the key relationships it proposes.
0-7695-0001-3/99 $10.00 (c) 1999 IEEE
9
Proceedings of the 32nd Hawaii International Conference on System Sciences - 1999 Proceedings of the 32nd Hawaii International Conference on System Sciences - 1999
This study was instrumental in reshaping our thinking about how to build a self-sustaining and growing community of GSS users. It was particularly intriguing to discover that ad hoc problem-solving with GSS hinders the transition process. This suggests that one could focus on identifying and supporting repeatable processes early in the transition process. One might choose to focus on ad hoc problems only after a community has been established.
References 1. Adams, D., Nelson, R. R. & Todd, P. A. Perceived usefulness, ease of use, and usage of information technology: a replication. MIS Quarterly, 16, , (1992), 227-250. 4. Argyris, C., Putnam, R. & Smith, D. M. Action Science. San Francisco: Jossey-Bass Publishers, (1985). 6. Davis, F. D. A technology acceptance model for empirically testing new end-user information systems: theory and results. Sloan School of Management. Cambridge, MA, Massachusetts Institute of Technology, (1986), 7. Davis, F. D. User acceptance of information technology: system characteristics, user perceptions and behavioral impacts. International Journal of Man-Machine Studies, 38, , (1993), 475-487. 8. Davis, F. D., Bagozzi, R. P. & Warshaw, P. R. User acceptance of computer technology: a comparison of two theoretical models. Management Science, 35, 8, (1989), 982-1003. 9. de Vreede, G.J. Facilitating organizational change: the participative application of dynamic modeling. School of Systems Engineering, Policy Analysis, and Management. Delft, Delft Technical University, (1995), 11. Dennis, A. R., Nunamaker, J. F. Jr., Vogel, D. R. A Comparison of laboratory and field research in the study of electronic meeting systems. Journal of Management Information Systems, 7, 3, (1990-91, Winter), 107-135. 15. Fjermestad, J. & Hiltz, S. R. An Assessment of Group Support Systems Research: Methodology. Journal of Management Information Systems, In Press, , (1998-99, Winter), 18. Grohowski, R., McGoff, C., Vogel, D., Martz, B. Jr., & Nunamaker, J.F. Jr. Implementing Electronic Meeting Systems at IBM: Lessons Learned and Success Factors. Management Information Systems Quarterly, 14, 4, (1990, December), 368-383.
19. Jessup, L. M., and Valacich, J. S. Group Support Systems: New Perspectives. New York: Macmillan Publishing Company, (1993). 20. Mathieson, K. Predicting user intentions: comparing the technology acceptance model with the theory of planned behavior. Information Systems Research, 2, , (1991), 173-191. 21. Moore, G. C. & Benbasat, I. Development of an instrument to measure perceptions of adopting an information technology innovation. Information Systems Research, 2, , (1991), 192222. 22. Nunamaker Jr., J. F., Briggs, R. O., Mittleman, D. D., Vogel, D. R. & Balthazard, P. B. Lessons from a dozen years of group support systems research: A discussion of lab and field findings. Journal of Management Information Systems, 13, 3, (1996-97, Winter). 23. Nunamaker Jr., J. F., Dennis, A. R., Valacich, J. S., Vogel, D. R. & George, J. F. Electronic Meeting Systems to Support Group Work. Communications of the ACM, 34, 7, (1991), 40-61. 24. Olfman, L. & Bostrom, R. P. End-user software training: an experimental comparison of methods to enhance motivation. Journal of Information Systems, 1, , (1991), 249-266. 26. Post, B. Building the Business Case for Group Support Technology, Proceedings of the Twenty Fifth Annual Hawaii International Conference on Systems Science, Vol. IV, (1992, January), 34-45. 28. Taylor, S. A. & Todd, P. A. Process tracing methods in decision support systems research: a test of competing models. Information Systems Research, 6, , (1995), 144-176. 29. Valacich, J., George, J., Nunamaker Jr., J. F. &Vogel, D. R. Physical Proximity Effects on Computer-Mediated Idea Generation. Small Group Research, 25, 1, (1994), 83-104. 30. van Genuchten, M., Cornelissen, W. and van Dijk, C. Supporting Inspections with an Electronic Meeting System, Proceedings of the Thirtieth Annual Hawaii International Conference on System Sciences, II, (1997), 405429. 31. Venkatesh, V. & Davis, F. D. Modeling the determinants of perceived ease-of-use, Proceedings of the International Conference on Information Systems, (1994), 213-227. 32. Vogel, D. R., Nunamaker Jr., J. F., Martz, B. J., Grohowski, R. & McGoff, C. Electronic Meeting System Experience at IBM. Journal of Management Information Systems, 6, 3, (198990, Winter), 25-43.
0-7695-0001-3/99 $10.00 (c) 1999 IEEE
10