License Plate Recognition using Multi-cluster and Multilayer Neural Networks Siti Norul Huda Sheikh Abdullah,Marzuki Khalid and Rubiyah Yusof Centre for Artificial Intelligence and Robotics (CAIRO), Faculty of Electrical Engineering, Universiti Teknologi Malaysia, Jalan Semarak,54100 Kuala Lumpur
[email protected]. ukm. my, marzuki@utmkl. utm. my, rubiyah#utmkl. utm. my Khairuddin Omar Jabatan Sains dan Pengurusan Sistem,Fakulti Teknologi Maklumat, Universiti Kebangsaan Malaysia, 43600 Bangi, Selangor. ko@ftsm. ukm.my
Abstract Vehicle license plat recognition has been a much studied research area in many countries. Due to the different types of license plates being used, the requirement of an automatic license plate recognition systemr is rather different for each country. In this paper, an automatic license plate recognition system is proposed for Malaysian vehicles with standard license plates based on image processing, feature extraction and neural networks. The image-processing library is developed in-house which we referred to as Vision System Development Platform (VSDP). MultiCluster approach is applied to locate the license plate at the right position while Kirsch Edge feature extraction technique is used to extract features from the license plates characters which are then used as inputs to the neural network classifier. The neural network model is the standard multilayered perceptron trained using the back-propagation algorithm. The prototyped system has an accuracy of more than 91%, however, suggestions to further improve the system are dtscussed in this paper based on the analysis of the error. Keywords License plate recognition, clustering, feature extraction, classification.
1. Introduction Automatic license plate recognition system is an important area of research due to its many applications. For local authorities license plate recognition is required for the purposes of enforcement, border protection, vehicle thefts, automatic toll collection, and perhaps traffic control. For others, automatic license plate recognition system can be applied to access control in housing areas, automatic parking control and marketing tools in large shopping complexes, and perhaps for surveillance. Among the commercial license plate recognition systems available worldwide are Car Plate Recognition by J.A.G. Nijhuis et.al.[11], Car Plate Reader (CPR) by Rafael et.al.[7], Optical Car Recognition by Emiris and Koulouriotis [6] and Automatic Number Plate Recognition(ANPR) by ShyangLih Chang et. al.[5] and Mehmwet Sabih Aksoy et. 0-7803-9521-2/06/$20.00 §2006 IEEE.
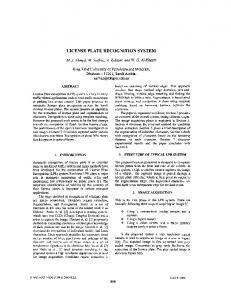
al. [2]. In Malaysia, vehicles license plates are in the form of single or double line with normal fonts which comprise of perhaps 95% of the all the vehicles. There are also special fonts as depicted in Figurel. LPR normally consists of a camera, illumination,
Figure 1(a)Samples of common Malaysia license plates (b) Samples of special Malaysia license plates.
frame grabber, computer, recognition software, hardware (input output adapters) and database as illustrated in Figure 2. LPR employs real time plus artificial intelligence algorithm like hybrid system or Neural Network (NN) which recognizes significant plate numbers and records in the refined databases. This dedicated LPR software covers at least five major processes consecutively; Capturing, Pre-Processing, Segmentation, Feature Extraction and Classification as shown in Figure 3. Usually, targeted functions and specifications that will be embedded into the LPR system are fast recognition alphabet and number with high accuracy recognizing both front and back side, 24 hours non-stop operation and alarm message send out after recognition.
2. Image Segmentation Image segmentation is a process that separates words to single characters for easy identification[3]. In this project, segmentation involves a process of separating a collection of character that has been filtered; to a sequence of characters that will be used in the feature extraction stage. This step is very significant due to overlapping characters that form the license plate. There are three main forms of characters that are overlapping vertically, ligature, diacritics, horizontal overlap, and two connected charac1818
Figure 4.1mage Segmentation using clustering approach.
Figure 2.Elements in LPR
Figure 5.1mportant information for clustering approach.
Figure 3.Process in image processing. ters. The task will be more difficult for those different forms of which are joined. At the moment, LPSeeker applies clustering technique to identify important blobs. After processing image using simple image enhancement technique like Fixed filter, Minimum Filter, Opening and dependent threshold for the LPSeeker image enhancement which are provided in VSDP library (Vision System Development Platform). VSDP is a library that has been developed by CAIRO, UTMKL researchers. After applying above image enhancement, the image is segmented using horizontal scan line profiles and clustering technique. Thoroughly each image is transformed into blob objects and its important information such as location, height and width, are being analyzed by the LPSeeker for the purpose of cluster exercising and choosing the best cluster with winner blobs. The blobs are clustered when difference between blob and cluster heights and difference between maximum Y value of the cluster and blob are less than a constant time to cluster's height as stated in multi-clustering algorithm. Please refer to the multi-clustering algorithm in section 2.1 and picture depicted in Figure 4 and Figure 5. Then these winner blobs are extracted its feature individually before permitting to recognition or classification phase.
2.1. Clustering algorithm
Input: Set original image into a buffer, B1. Output: Get winner clusters and blobs, Cn, Bbl..m Step 1: Calculate total of blobs in the image, n. Step 1.1: From 0 until n, then keep information like minXn, minYn, maxXn, maxYn, heightn, widthn for each blobs into an array. Step 2: Cluster each blobs when difference ( refer equation
0-7803-9521-2/06/$20.00 §2006 IEEE.
(1)) between blob height, height;Bm and cluster height, Hcn and
difference (refer equation (2)) between maximum Y value in
cluster, maxY,-. and maximum Y value of blobs, maxYbm are less than a constant time to the cluster height, Hcn. max YBi -max Yci ( x Hc
IHCi- HBil
ax
Hci
(1)
(2)
where a value is 0.3, 0.5, 1 or 2. Step 3: Choose the cluster, Cn which has the maximum size of blobs, Csize... Step 3.1: Check distance between each winner blobs, maxX. and minXn+i. Step 3.2: Sort the winner blobs according to its minXn. Step 3.3: Segment all sorted winner blobs individually. Step 4: Finish.
3. Feature Extraction Feature extraction is described as functions of the measurements performed on a class of objects that enable class to be distinguished from other classes in the same general category. One of feature extraction objective is to grab only essential and distinguished information or characteristics of the each character to be easily recognized later[3]. Some researchers applied thinning or skeleton[6], Laplacian Edge detector[2], Minimum Area [6], Prewits, Robinson and Sobels [4] edge detector. In our research we concetrated on Kirsch Edge Detection.
3.1. Kirsch Edge Detection Basically kirsch edge detector have eight different kernels to detect eight different directions of edges. A minor research has been conducted to select the best kernel in Kirsch Edge Detector and we found that right vertical, top horizontal, top left diagonal and top right diagonal are the best features to represent character images and inputs to neural network. 1819
Kirsch Edge Detection is a simple algorithm for firstorder differential edge detection. This edge detector is used to detect four directional edges more accurately than other detectors such as Prewitt and Sobel which considers all the eight-neighborhood pixels[14]. The non-linear edge enhancement algorithm defined by Kirsch is shown as equation (3), equation (4), equation (5) and equation (4)follows: G(i, j) =max
} {1,max[15Sk-3TkI] k=O
0,1,2,3,4,5,6,7
(4)
Sk Ak + Ak+I + Ak+2 Ak+3 + Ak+4 + Ak+5 + Ak+6 + Ak+7
(5) (6)
K
=
=
Tk
=
(3)
The G (i7j) is the gradient of the pixel (i,j). The subscripts of A are represented as the neighborhood pixels for the (i7j) as shown in Table 1. We can calculate the directional feature vectors for vertical (equation 7 and 11), horizontal (equation 8 and 12), left-diagonal (equation 9 and 13), and right-diagonal (equation 10 and 14) directions as follows: G(i, j)V
G(i, j)H G(i, j)L
G(i, j)R
Table
1
=
max(I5S2 -3T21, 15S6 -3T61)
(7)
max(I 5So
-3To I, 15S4 -3T4 1)
(8)
max(I5S3 -3T31,15S7 -3T71)
(9) (10)
.
max(I 5S- 3Ti l, 15S5 -3T5 1)
Example showing the eight neighbours of pixel
Ao A7 A6
(ii]) As
(i7j) As
-3 0 -3
-3
L5 -3
A2 A3 A4 3 3
(11)
3]
5 0 -3
5 -3
(12)
5 0 -3
-3 -3
(13)
5 0 -3
5 5 -3
-3_
-3_
I
(14)
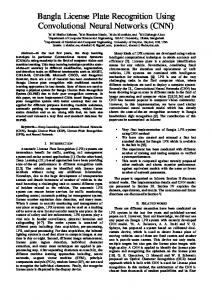
The equations above can be replaced by sinaple convolution masks operation as given in Table 1 and the scale factor of 1/15 was suggested by Pratt[13]. The edges extracted from different classes of characters are not the same and the operation speed is also acceptable. Thus, it could be used as the feature extractor for the character recognition. The results of the Kirsch detectors are shown in Figure 6. Note that after the Kirsch edge detection, the image will change from binary to gray level scale. These values will become the inputs of Neural Network scheme later (Table 2). 0-7803-9521-2/06/$20.00 §2006 IEEE.
Figure 6.(i)Original Image of '4', '6', E' and 'G'(left most). Example feature extracted images using Kirsch Edge Detection using (ii)vertical, (iii)horizontal, (iv)leftdiagonal and (v)right diagonal for letter '4', '6', E'and 'G' consecutively.
3.2. Kirsch Edge algorithm Input: Set Original Image into a buffer, Bi. Output: Display and binarized feature extracted image. Step 1: For counter, i = 1,2,3,4,5,6,7,8 Step 2: Clone original image BI into new buffer, B2. Step 3: Create new Kirsch Edge kernel with size (3,3) for each eight directional edges Ki where j 1,2,3,4,5,6,7,8. Step 3.1: Set kernel for vertical Ki, top horizontal K2, top left diagonal K3 and top right diagonal K4. Step 4: Do convolution buffer B2 with chosen kernel directions of kernel,Kj. Step 5: Display and binaries each feature extracted image. Step 6: Finish.
4. Image Classifications We apply neural network to classify these images and recognize the characters. Here we explain briefly foundation of NN. Mui et.al.[9] presented two important characteristics in NN: learning and generalization. Learning process associates with network architecture that will change the connection structure between units and signal strength in the connection structure. Every input, Xi ,X2 ,...xn has its respective weight Wi,i, W1,27..7W1,n from weight matrix w. This neuron has bias b that will be accumulated with clean input to produce total neuron input value. Total neuron input value is used in the activation function f, and produces one scaled output neuron, a that can be represented by equation(15): a
f(Iwlixi +)
(15)
Output a value depends on the activation function used. Basically there are two types of activation functions: linear and non-linear. Activation function either Binary sigmoid, Bi-polar sigmoid or Hyperbolic tangent, which is suitable with the type of problem solving and desired output range, shall be applied onto the network [8].In our case we applied Binary 1820
sigmoid. We also used random weight control for the first network initializing even though there are other types like Nguyen Widrow [8] and Genetic algorithm [1]. After a few experiments conducted Table 2, we found that using five features: original image and kirsch edge kernel 2, 4, 6 and 8 with 10xlO image size is the most essential input numbers for the neural network scheme. Meanwhile, 200 are the most optimum hidden nodes. We have trained on 200 image sets and stopped training when its mean square errors have reached to 0.0026 values. Since we are dealing with Malaysian license plate, the output nodes have been increased from 33 up to 36 which covers all roman alphabets ( except 0), numbers (from 0 to 9) and backlash ("/ ") . Table 2.Neu ral5 types Network Scheme. x ( 10 x 10 pixel) 500
Input nodes Hidden nodes Output
Learning rate Minimum Error rate
0,1,2,3,4,5,6,7,8,9,A,B,C,D,E,F,G,H,I, J,K,L,M,N,P,Q,R,S,T,U,V,W,X,Y,Z and
200 36 0.05 0.0026
5. Discussions The plate recognizer or 'LPSeeker' has been fully developed by using contemporary techniques such as median filtering and threshold for image processing, clustering for segmentation, kirsch edge detector for feature extractions and neural network. We have also run two separate experiments; fixed and different threshold. From those experiments, we constructed analysis of error tables based on segmentation and classification errors. The prototyped system has an accuracy more than 91%, however, suggestions to further improve the system are discussed in this paper pertaining to analysis of the error. There were two experiments conducted; fixed (value for threshold is 130) and different threshold value experiments. Each experiment had been run onto 1000 off-line image data. Here, we only stated classification, feature extraction and classification time because the experiment has been carried out automatically. These images are captured from frontal and back of Malaysia cars. This time we only concentrated on Malaysia standard car plate images which taken surrounding Kuala Lumpur, Selangor, Pahang, Terengganu and Perak. LPSeeker is developed using Microsoft Visual C++ and VSDP library. VSDP library is a library for image processing and it has consistently developed and updated by CAIRO. As depicted in Table 3, Classification has consumed the highest time which is 2247.68 ms while feature extraction falls the second with 472.02 ms and segmentation is the least with 5.2ms. Classification gains most time due to neural network processing time which requires connecting to the weight database and calculating the current image's weight. From Table 4, out of a thousand images that were been analyzed, 803 images have perfectly recognized 0-7803-9521-2/06/$20.00 §2006 IEEE.
for fixed threshold experiment. This result increased to 919 when different threshold values were used. Therefore, both experiments accuracy percentage are 80.3% and 91.9% correspondingly. Even though, LPSeeker accuracy percentage has achieved more than 80%, they are several issues to be tackled in the case error analysis such as segmentation and classification issues. From Table 4, segmentation error percentage for fixed threshold is about 61.4% while classification error rate is 38.58%. However, when different threshold values are used, its segmentation error percentage has reduced significantly to 12.34% and caused the classification error percentage increased to 87.65%. Here, we can assume that by applying different threshold or perhaps adaptive threshold values can reduce segmentation error percentage. Furthermore, LPSeeker II also needs to give attention to classification errors because adaptive threshold did not show any significant improvement. Segmentation errors are categorized into five classes: NotFound, Missl, Miss2, Miss>-2 and Extra. Meanwhile classification errors are divided into four categories: Wrongl, Wrong2, Wrong>-2 and Wrongseq. Description of each errors are explained briefly in Table 5. Samples of interfaces of those errors are also depicted in Figure 10 and 11. Referring to the segmentation problems of Table 3, there were 26 errors for Type Missl, 30 errors for Type Miss2, 57 errors for Type Miss>-2 and 8 errors for Type Extra in fixed threshold value experiment. These errors were occurred may due to restrictions in clustering approach. Inappropriate threshold causes two and more characters connected and width of the blobs is greater than the height of the blobs. As a result, these connected character blobs will not consider as winner blobs and become missing (8). Clustering success is closely related to the constant value that has been set for grouping the blobs. If the constant value increases, LPSeeker surprisingly can detect almost more than 20 but less that 50 degree of skewed license plate. However, the drawback is sometimes unnecessary blobs will also consider as winner blobs and this error falls into category Extra. On the other hand, if the constant value reduces, this may also lead to missing blobs like Missl, Miss2 and Miss>-2 errors. Fortunately, these segmentation errors were reduced dramatically when different threshold values were used. From Table 3, you can see that out of 121 errors occurred in fixed threshold experiment; only 10 remained as errors when different threshold values were adapted. Therefore, an adaptive threshold system is highly required to be developed such as Otsu Threshold[10], NN Threshold or Rule-based Threshold. On the other hand, classification is another serious issue as depicted in Figure 7and Table 5. There were 56, 9, 11 and 0 errors for Type Wrongl, Wrong2, Wrong>-2 and Wrongseq consecutively when fixed 1821
threshold experiment was conducted. These errors almost remained the same (except for Type Wrongseq) even though different threshold values were used. Errors that fall under category classification may due to segmentation techniques. Quite a number that Type Wrongl, Wrong2 and Wrong>-2 were wrongly recognized because the license plate images were skewed or rotated. Therefore, some of the letters were misclassified. For example, several characters that look similar were detected vice versa like character B or 3 detects as 8, character 5 detects as 6, character 6 detects as G , character A detects as 4, character I detects as 1 (refer to Figure 9). Apart from that, these errors may also due to inappropriate feature extraction technique. Kirsch edge detector is intolerance to rotated images. Kirsch Edge detector also fails to distinguish certain character like 6 and G. Feature representation for 6 and G may return the same binary value. As a result, Kirsch Edge might lead to letter misclassification.
Figure 7.Overall type versus number of errors for fixed and different threshold graph.
Table 3.Average time for five fixed threshold experiments Total Set Average Segmentation Feature Ext raction Classification
25.8 2360.1
5.2 472.02
11238.4
2246 .8
Table 4.Accuracy time for five fixed and different threshold experiments. Detail
total sample data no of correct correct percentage total segmentation error Segmentation error percentage classification error Classification error percentage
Threshold fixed different 1000 1000 803 919
Average
1000 861
80.3%
91.9%
86.1%
61.4%
12.34%
36.88%
38.58%
87.65%
63.12%o
121
76
10
71
65.5
Figure 8Samples of misl(top left), miss2 (top right), miss>-2 (bottom left) and extra character (bottom
73.5
right).
6. Suggestion Firstly, both fixed and different threshold experiment shows that the performance increases if the appropriate threshold is applied before segmenting the characters. Adaptive threshold like Otsu Threshold or Otsu with a revised formula need to be developed for reducing segmentation errors that may lead to misclassification later. Secondly, segmentation algorithm should solve geometric issues from the very beginning. Geometric approach can re-correct the position of coordinates and aid to arrange the character Table 5.Type of errors for fixed and different threshold experiment Error Type NotFound
Miss1 Miss2 Miss>2
Extra
Wrongl Wrong2
Wrong>-2
Wrongseq
Description
Cannot find license plate Miss 1 character Miss 2 characters Miss more than 2 characters More than actual characters total segmentation errors Wrong 1 character Wrong 2 characters Wrong more than 2 characters Wrong sequence of characters total classification errors
Threshold fixed different 1 0 2 26 2 30 57 3 2 8 121 10 52 56 9 6 11 10 0 3 71 76
0-7803-9521-2/06/$20.00 §2006 IEEE.
Average 0.5 14 16 30 65.5 54 7.5 10.5 1.5
73.5
in proper order. Furthermore, geometric approach also helps maintaining uniqueness of each letter characteristics by correcting its structure. Besides that, there are three main approaches of segmentation, which are Histogram Profile Projection1 (HPP), Connected Components Labeling 2 (CCL) and Determining of Segmentation Points3 (DSP)[12].Combination of these three approaches can form better solution in segmentation phase. The third problem may cause by feature extraction. Feature extraction has a good correlation with the success of the recognition. Using other feature extraction, which explains and represents better nature of each character is required. Feature extraction is divided into three styles; grayscale image4, binary 1HPP can be used to segment text-to-text lines, then to words 2CCL can gather all contours of connected components 3DSP is stressed on the determination of definitive segmentation points by searching junction of segments between characters
4Grayscale image consists of several techniques like template matching, deformable templates, unitary transform, zoning, geometric moments and Zernike moments. 1822
Figure 9.Samples of wrongl(top left), wrong2 (top right), wrong-2 (bottom left) and wrongseq (bottom right).
image5 or vector (skeleton) image6 [12].
Lastly, the recognition using neural network can lead to misclassification if errors in segmentation and feature extraction are not solved independently. Otherwise, perhaps other technique to classify can be used like Trace Transform, Polynomial and Bayesian classification.
7. Conclusions and Acknowledgment This paper has generally discussed on concept of license plate recognition, segmentation, feature extraction approach and neural network technique. In conclusion, we can conclude that classification has significantly raised more problems compared to segmentation. Major adjustment must be made to reduce recognition errors. These errors may origin to insufficient segmentation algorithm or inefficient feature extraction method (Kirsch Edge Detector). Special thanks to my friends: Norzi, Faridatul, Norzu and Dilah who had been hardworking in collecting data in various states.
8. References [1] A.C.Tsoi and H.C. Andersen. A constructive
algorithm for the training of a multilayer perceptron based on the genetic algortihm. Master's thesis, Department of Electrical Engineering, University of Quensland, 1994. [2] Mehmwet Sabih Aksoy, Gultekin Cagil, and Ahmet Kursat Turker. Number-plate recognition using inductive learning. Robotics and Autonomous systems, Elsevvier science B. V., 33:149-153, 2000.
[3] B. Al-Badr and S.A.Mahmoud. Survey and bibliography of arabic optical test recognition. Signal Processing., 41:49-77, 1995. [4] Muhammad Safraz andMohammed Jameel and syed A.Ghazi. Saudi arabian license plate recognition system. In IEEE Proceedings of the 2003 International conference on Geometric Modelling and Graphics(GMAG03)., 2003. [5] Shyang-Lih Chang, Li shien Chen, Yun-Chung Chung, and Sei-Wan Chen. Automatic license plate recognition. IEEE Transaction Intelligent transportation system, 5:42-53, 2004. [6] D.M.Emiris and D.E.Koulouriotis. Automated optic recognition of alphanumeric content in car license plates is semi-structured environment. In Proceedings of International Conference on Image Processing., volume 3, pages 50-53, 7-10 Oct 2001. [7] J.Barosso, E.L Dagless, A.Rafel, and J. BulasCruz. Number plate reading using computer vision. In Proceedings of IEEE International symposium on Industrial Electronics., volume 3, pages 761-766, 1997. [8] L.Fausett. Fundamental of Neural Networks: Architechtures, Algortihms, & Applications. Prentice Hall, New Jersey, 1994. [9] L.Mui, A A. Agrarwal, A.Gupta, and P.S.P Wang. An Adaptive Modular Neural Network with Application to Unconstrained Character Recognition In Document Image Analysis., volume 16:1189-1203. World Scientific, 1994. [10] M.Petrou and P.Bosdogianni. Image Processing: the fundamentals. John Wiley & sons Ltd., Eng-
land, 2000. [11] J.A.G. Nijhuis, M.H ter Brugge, and K.A. Helmholt. Car license plate recognition with neural network and fuzzy logic. In IEEE Proceedings of International Conference on Neural Networks., volume 5, pages 2232-2236. IEEE, 27 Nov-1 Dec 1995. [12] O.D.Trier, A.K. Jain, and T. Taxt. Feature extraction methods for character recognitiona survey. Journal of Pattern Recognition,
29(4):641-662., 1996. [13] W.K. Pratt. Digital Image Processing. Wiley, 1978. [14] Yap Keem Siah. A design of an intelligent li-
cense plate recognition. Master's thesis, Universiti Teknologi Malaysia, 2000.
5For binary feature extraction, techniques above are used similarly to grayscale image and plus contour profiles, spline curve and fourier descriptors. 6Vector image includes feature extraction technique such as graph descriptors and discrete feature. 0-7803-9521-2/06/$20.00 §2006 IEEE.
1823