Light Output Measurements of LSO Single Crystals and 4x8 Arrays: Comparison of Experiment with Monte Carlo Simulations A.Kriplani1, S.P.Stoll2, D.J.Schlyer2, S.Shokouhi1, P.Vaska2, A.Villanueva Jr.1, C.L.Woody2, 1 Department of Biomedical Engineering, Health Sciences Center, State University of New York [SUNY] at Stony Brook, Stony Brook, New York 2 Brookhaven National Laboratory, Upton, New York
Abstract--We have made a comparison between experimentally determined light output from various size LSO crystals and the Monte Carlo simulations using the program Opticad. The results show good agreement between the predicted results and the experimental measurements. These results show that it is possible to accurately simulate the light output using these calculations. This allows testing of many parameters quickly and the determination of the critical parameters in maximizing the light output and photoelectron yield from these detector modules. I.
INTRODUCTION
order to design and build an detector system for use in I nsmall animal tomographs, it is necessary to understand the number of photoelectrons which are generated by the combination of scintillation in the crystal, and light amplification by the APD and electronics. Several factors will effect this quantity including the light output of the crystal, the nature of the reflective coating around the crystal, the interface between the crystals and the APD and the efficiency of the APD in generating a signal from the light input. If it is possible to show that a Monte Carlo program such as Opticad [1] can be used to accurately predict these values, it would be possible to use the simulations to evaluate a large number of configurations more quickly and also to predict which parameters are critical to improving the signal. Since the introduction of LSO as a scintillator for PET applications [2], much work has been done to improve the quality of imaging systems using LSO. Some recent efforts have begun using Hamamatsu APD arrays to read out array blocks of LSO crystals [3,4]. The LSO arrays can be Manuscript received October 20, 2003. This work is part of a joint collaboration between Brookhaven National Lab, and Stony Brook University and is supported under a grant from the DOE Office of Biological and Environmental Research and DOE Contract DE-AC02-98CH10886. A. Kriplani is with SUNY @ Stony Brook, Stony Brook, NY USA (telephone: 631-344-4576, e-mail: aarti @bnl.gov). S. P. Stoll is with Brookhaven National Laboratory, Upton, New York 11973 (telephone: 631-344-5331, e-mail:
[email protected]). D. J. Schlyer is with Brookhaven National Laboratory, Upton, New York 11973 (telephone: 631-344-4587, e-mail:
[email protected]) C. L. Woody is with Brookhaven National Laboratory, Upton, New York 11973 (telephone: 631-344-2752, e-mail:
[email protected])
engineered to match pixel layout of the S8550 APD arrays in order to optimize the light collection.
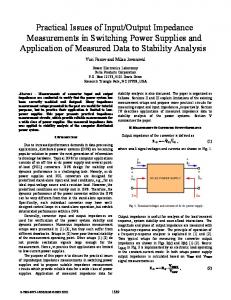
Figure 1. 4 x 8 pixel LSO arrays and the Hamamatsu S8550 APD array (left), and (right) single 5, 10 and 20mm long LSO crystals like those assembled into the arrays . II. METHODOLOGY We studied a sample of single LSO crystals from two manufacturers of crystal arrays for PET detectors: CTI [5] and Proteus [6]. All of the crystals studied measured 2.2 mm x 2.2mm in cross section. The Proteus crystals were 5, 10, and 20 mm long, and the CTI crystals were 18 mm long. The light output from the single crystals was measured by reading out one end of the crystals with a Hamamatsu R1398 PMT (28 mm diameter quartz window). In our PET applications, the crystals are assembled into arrays and coupled to an APD array.
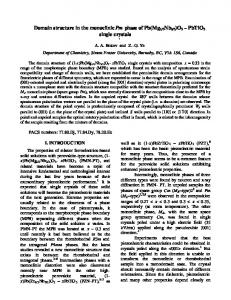
Figure 2. A Schematic representation of the experimental setup used for the single crystal measurements.
300
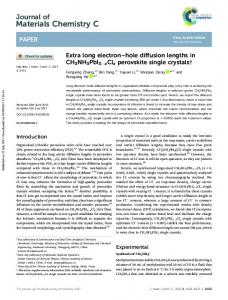
Na-22 spectrum fit of 0.511 MeV gamma peak:
250
centr: 1333 = 2609 pe/MeV fwhm: 154 resolution(fwhm/centr.) : 0.115
200 150 100 50 0 0
500
1000
1500
2000
2500
photoelectrons
Figure 4. Typical Na-22 pulse height spectrum for a single crystal.
100
80
% transmission
350
counts
For this study we used a photomultiplier tube to measure the light output of the single crystals because it allowed full coverage of the readout end of the crystal. A Na-22 (0.511 MeV gamma) “point” source was placed ~ 1 cm. from the end of the crystal. The signal was integrated and digitized with a LeCroy 2249 ADC. All of the crystals were measured with no reflective wrapping and then wrapped in a sheath of 3M Radiant Mirror Film (RMF). The wrapping covered all but the readout end of the crystal. Both configurations were measured with the crystal air coupled and “cookie” coupled to the pmt window. The “cookie” was Sylgard 527 (Dow Corning [7] ) silicone gel (~ 0.6 mm thick). The optical transmission of the Sylgard cookies was measured, and is shown in Fig, 3.
60
LSO emmission - 420 nm
40
CaF2 window alone + ~ 0.1mm cookie (unused) + ~ 0.6 mm cookie (used) + ~ 0.6 mm cookie - (unused)
20
0 200
300
400
500
600
700
800
wavelength (nm)
Figure 3. Optical transmission of Sylgard 527 cookies. The gain curve vs HV of the pmt was measured, and a calibration point was established in order to determine the number of ADC channels per photoelectron for the voltage setting used for these measurements. The ADC used was a LeCroy 2249 with a sensitivity of 0.25 pC/ch. The calibration was determined using an LED and assuming that the width of the LED pulse height distribution is given by Poisson statistics (s/mean = 1/√Npe), and gave a value of 0.815 ch/pe @ 1200V. The pmt was also calibrated by Hamamatsu and has a quantum efficiency of 0.24 @ 420 nm, which is the peak emission wavelength of LSO. A typical pulse height spectrum for a 10 mm wrapped and coupled crystal is shown in Figure 4. The number of photoelectrons per MeV was calculated from the measured position of the 511 keV photopeak as: pe/MeV = [photpk-ped (ch) ] / [0.511 (MeV γ) * 0.815 (ch/pe)]
The light output of some LSO arrays was measured with the LSO arrays coupled with a “cookie” to a Hamamatsu S8550 APD array. The measurements were repeated without the cookie (airgap), The LSO arrays were composed of 5 or 10 mm long LSO crystals with SiO2 (CTI arrays) or 3M RMF reflector (Proteus arrays) between and around the crystals.
The CTI arrays are actually a single block of LSO with slots cut approximately 90% down the length to form the pixels, and reflector packed into the slots. The Proteus arrays were tested in four configurations: (1) the RMF reflector glued to all sides of the crystals except the readout end, (2) no glue between reflector and any sides of the crystal, (3) the reflector glued only to the end opposite the readout, (4) the reflector glued only at the end opposite the readout along with an RMF reflector mask between the crystal and APD array. The mask was used in an attempt to reflect some of the light back into the crystal that would otherwise be lost due to the mismatch between the active APD pixel area (1.6x1.6 mm2) and the crystal pixel area (2.2x2.2 mm2). However, coupling of the mask, crystal and APD proved to be difficult, and in the end, gave poorer results than without the mask. A Ge-68 “flood” source was used to uniformly illuminate the arrays with 511 keV γ‘s. The gain of each APD channel was measured individually, and operated with an average gain of ~ 50. The APD signals were amplified with charge sensitive preamplifiers and 90ns shaping amplifiers, and then integrated and digitized in LeCroy 4300B FERA ADC’s. For each LSO array measurement, the pulse height spectrum was measured for each of the 32 APD/LSO channels. The photoelectrons/MeV and resolution were measured and then averaged over all 32 channels. This process was repeated for several samples and then the average for each group of samples was computed. II. SIMULATIONS OptiCAD is a Monte Carlo type computer program for the layout and analysis of three-dimensional optical systems. The program is structured in a computer-aided design (CAD) format in which the user defines objects, then places and orients them in a global-coordinate system. The program may be used to simulate a wide variety of non-imaging and imaging optical systems. All surfaces may be modified in reflectance and absorbance and diffuse surface scattering may be applied
to any surface. We used OptiCAD to estimate the light collection efficiency in several types of LSO crystals by generating light rays inside the crystal and propagating these rays to the photodetector OptiCad has been used to simulate the process of the scintillation light collection in one pixel of a LSO+PMT detector (2.2x2.2x L). The simulation code was carried out with the following components: 1- An object that represents the 2.2x2.2x L mm LSO scintillation crystal. 2- A volumetric light source: At a random point in a given volume a specified number of photons are generated. 3- An object that represents a layer of silicone cookie between the PMT and he LSO crystal. 4- An object that represents the PMT. 5- A film that is attached to the PMT window. This film detects the number of photons that can reach (after some internal reflections) the PMT. Light was generated isotropically within thin slabs in 1 mm steps along the length of the crystal to estimate the effect of the longitudinal light collection efficiency. Each ray is initially generated with unit energy and is propagated until it is either absorbed on the photodetector or the ray tracing is terminated. At each refractive surface, the ray is split into a primary and secondary descendant (or ghost) according to its energy. The energy split is based on the refractive indicies of the materials at the interface and is a measure of the probability of how the light ray is further propagated. Optical has several parameters that are used to terminate the propagation of the light ray, which include:
We have assumed the intrinsic light output of the LSO to be 25,000 scintillation photons per MeV, and used the known quantum efficiency of 24% at the peak wavelength of the LSO emission for the phototube used in these measurements. A comparison of the results of the OptiCAD simulation with the measured data using these values is given in Figure 4. The photon absorption length at 420 nm has been measured to be 21+/- 1 cm. This gives a bulk absorption coefficient of 0.0048[1/mm] in LSO. The absorption coefficient of the 511 keV gamma can be determined from the effective attenuation length of LSO This gives an attenuation coefficient of 0.086 [1/mm]. A final simulation was conducted of a wrapped 5mm crystal to model a single pixel of a 4x8 array, read out with an APD array. The size of the light collection plane was reduced to correspond to the 1.6 x 1.6 mm APD pixels. III. RESULTS The data from the single crystal light output measurements are given in Table 1. The photoelectrons/MeV numbers are also plotted in Figure 4, as a function of crystal length, along with the corresponding Opticad simulation values.
a) exceeding a maximum number of ray–surface intersections, (maxdepth) b) exceeding a maximum number of ghosts, (maxghost) c) falling below a minimum ray energy for transmission (mintrans) These parameters were tuned in our OptiCAD simulation to give the best agreement with the measured experimental data, and the resulting values were maxdepth = 20(unwrapped)/ 40 (wrapped), maxghost = 2 and mintrans = .01. The light collection efficiency was determined by the ratio of the energy detected at photodetector to the total initial energy (or number of rays) generated. This efficiency can then be used to estimate the number of photoelectrons detected by our measurements. The average light collection efficiency for the single crystal configurations studied was ~ 40% for the wrapped crystals and ~ 20% for the unwrapped crystals. The number of photoelectrons detected is related to the number of scintillation photons produced by the following formula: Npe/MeV = Ng/MeV x efficiency x QE
Figure 4. Single crystal light output measurements and Opticad simulation data plotted as a function of crystal length. The results from the LSO array light output measurements are given in Table 2a and 2b for measurements without (2a.) and with (2b.) Sylgard cookies coupling the APD and LSO array. The Optical Monte Carlo simulation of the Proteus 5 mm long end-glued array with a silicon cookie gave 4202 pe/Mev, in good agreement with the measured value of 4491 given in Table 2b.
Table 1. Summary of light output measurements of single LSO crystals. Crystal length
wrapping
coupling
(fwhm/peak)
unwrapped
Air
1333
0.18
unwrapped
cookie
1483
0.17
3M-RMF
Air
2420
0.12
3MRMF
cookie
2648
0.12
unwrapped
Air
1027
0.17
unwrapped
cookie
1358
0.15
Proteus Group II 5mm
10mm
20mm
3M-RMF
Air
2404
0.12
3MRMF
cookie
2465
0.11
unwrapped
air
1019
0.17
unwrapped
cookie
1515
0.14
3M-RMF
air
2055
0.13
3MRMF
cookie
2394
0.13
Proteus Group I 10mm
unwrapped
Air
1202
0.15
unwrapped
Cookie
1559
0.13
3M-RMF
Air
2403
0.11
3MRMF
Cookie
2991
0.1
the experimental data appears incongruously high. This is not understood, as the same crystals did not exhibit an unusually high light output in the 3 other measurement sets. Table 2. Summary of LSO 4 x 8 pixel array light output measurements with and without silicone “cookie” couplant. 2a. Airgap - no silicone cookie manufac length note turer (mm) CTI 8 slotted block 3371 0.22 Proteus
5 10
glued glued
1804
0.20
Proteus
5 10
no glue no glue
2270 2281
0.19 0.18
Proteus
5 5
end glued, no mask end glued, mask
3016 2771
0.18 0.18
2b. With silicone cookie coupling manufac length note turer (mm) CTI 8 slotted block 2918 0.25 Proteus
5 10
glued glued
1513 2356
0.20 0.19
Proteus
5 10
no glue no glue
3113 2455
0.19 0.17
Proteus
5 5
end glued, no mask end glued, mask
4491 2962
0.16 0.17
CTI Group I 18mm
unwrapped
Air
1108
0.17
unwrapped
cookie
1264
0.16
3M-RMF
air
2247
0.13
3MRMF
cookie
2857
0.12
V. DISCUSSION AND CONCLUSIONS
In general the agreement between the experimental results and the simulation results is quite good. The simulations show a higher number of photoelectrons/MeV with the silicone cookie in place to transmit the light from the crystal to the PMT. The RMF wrapping improves the light collection by almost a factor of 2, in agreement with the experimental data. With the air gap coupling between the crystal and the PMT, the simulation shows good agreement with the “unwrapped” measurement data but a slightly lower efficiency than the experimental data in the “wrapped” case. The simulations show a trend of decrease in the number of photoelectrons/MeV with increase in the length of the crystal in agreement with the experimental data. One exception is the unwrapped, coupled point for the 20 mm crystals. In this case
The good agreement between the experimental measurement of the 5mm LSO array read out with an APD and the simulation of that measurement was also encouraging. While, there were some discrepancies in the relative light yields between the experimental results and the simulation results, the simulations were reasonably accurate in estimating the light collection efficiency and photoelectron yield from a single crystal of LSO attached to a PMT. We will continue to try to improve the simulations with APD readouts by tuning the available parameters and attempting to better understand the function of the reflector and adhesives and how they might behave differently in the single crystal measurements compared to the assembled crystal arrays. This could also help us understand any differences that we observe in the uniformity of the light output of the crystal pixels in an
assembled array, and optimize the design of the arrays to maximize the light collection with the APD array. The good agreement between the measured photoelectron yields and those calculated by Opticad suggests that Opticad can be used to accurately predict photoelectron yields in a variety of different crystal and readout configurations, and to quickly evaluate many parameters which are critical to improving the signal. VI. ACKNOWLEDGEMENTS
The authors sincerely acknowledge CTI. Inc and Proteus for supplying the crystals. This work is part of a joint collaboration between Brookhaven National Lab, and Stony Brook University and is supported under a grant from the DOE Office of Biological and Environmental Research and DOE Contract DE-AC02-98CH10886 VII. REFERENCES [1] [2] [3] [4] [5] [6] [7]
Opticad Corporation, 511 Juniper Drive, Santa Fe, NM 87501 USA H. Suzuki, T.A. Tombrello, C.L. Melcher, and J.S. Schweitzer, “Light Emmission Mechanism of Lu2(SiO4)O:Ce” IEEE Trans. Nucl. Sci., vol. 40, no. 4, pp. 380-383, Aug. 1993. M. Kapusta, P. Crespo, D. Wolski, M. Moszyski, and W. Enghardt, “Hamamatsu S8550 APD arrays for high-resolution scintillator matrices readout” Nucl. Instr. and Meth. A, 504, pp. 139-142, 2003. J.-B. Mosset, S. Saladino, J. -F. Loude, C. Morel, “Characterisation of arrays of avalanche photodiodes for small animal positron emission tomography” Nucl. Instr. and Meth. A, 504, pp. 325-330, 2003. CTI Molecular Imaging Inc., Knoxville, TN. Proteus Inc., Chagrin Falls, OH Dow Corning Corporation, www.dowcorning.com