Computer Applications to Archaeology 2009 Williamsburg, Virginia, USA. March 22-26, 2009. 1. Lighting Systems in Three Dimensional Non-Contact. Digitizing: ...
Lighting Systems in Three Dimensional Non-Contact Digitizing: A View from the Virtual Hampson Museum Project C. Scott Smallwood1, Angelia Payne1, Katie Simon1, Christopher Goodmaster2, Frederick Limp1 and Jackson Cothren1 1
Center for Advanced Spatial Technology, University of Arkansas. Arkansas, USA. 2 GeoMarine, Plano, Texas. USA.
Abstract The Virtual Hampson Museum project, directed by the Center for Advanced Spatial Technology and funded by the Arkansas Natural and Cultural Resources Council, has been an important testing ground for three dimensional noncontact digitizing. The project uses Konica-Minolta Vivid 9i scan system to scan and digitally archive over 800 artifacts from the Hampson Archeological Museum State Park. Being that the VIVID 9i has a 0.3 megapixel on-board camera, the control of the environment around the artifact being scanned is of the utmost importance. Since we lack the ability to adjust the camera accordingly to account for variations in artifact color, a solid lighting system must be used so that the scanner offers the optimal performance. Concerning ourselves both with the quality of surface and color data, we have provided a means through which adequate representation of an artifact can be achieved. In the beginning of the project, data was collected by simply using ambient light. Problems quickly arose from this approach, leaving the artifacts poorly lit, which resulted in darker color data and shadows between scan rotations. Realizing that product photography offered solid methods that could aid us, a large light tent was constructed for use with studio lighting in efforts to diffuse the ambient light, to eliminate shadows and to provide a solid white background. These methods allowed researchers to collect better quality color data that more accurately represented the artifacts from which they were taken. This paper will discuss the route we have taken to gather high quality data and the lighting system necessary to create it. The lighting system has been a cornerstone of gathering the data necessary to make an object ready for public and academic consumption. With an eye to developing a system in which the digitizing of artifacts is efficient across multiple uses and artifact types, a light system must operate as a constant source of reliability. Further improvements will be made to the lighting system that more control can be taken with the on-board camera. These improvements include the re-engineering of the light tent and the number and intensity of lights used during data collection. The end result, with as much possible control over the lighting and camera, is that the process should be able to be repeated with similar returns each time. Key words: 3d imaging, lighting, virtual museums
1
Introduction
Three dimensional non-contact digitizing for the Virtual Hampson Museum Project has facilitated a means to obtaining and disseminating data for view and use by the public and researchers. 1 Among the myriad of goals for the project, the
ability to obtain both a digitial surface model 2 (DSM) and adequate color data for the artifact's texture map to provide an accurate artifactual representation has been an important facet for this project. Yet, representing the artifact's color data in non-contact digitizing can be difficult. This is often times exacerbated by the low resolution of the scanner's on-board digital camera.
1
Angelia M. Payne et al. "Designing the Next Generation Virtual Musuem: Making 3D Artifacts Available for Viewing and Downloading" Paper presented at 37the Annual International Conference on computer Applications and Quanitative Methods in Archeology (CAA). “Making History Interactive” Williamsburg, Virginia, USA March 22-26. 2009.
Computer Applications to Archaeology 2009
2
George Vozikis et al., Laser Scanning: A New Method for Recording and Documentation in Archaeology. FIG Working Week 2004, Athens, Greece. 2004.
http://www.fig.net/pub/athens/papers/wsa1/WSA1_4_Vozikis_e t_al.pdf
Williamsburg, Virginia, USA. March 22-26, 2009
1
Smallwood, Payne, Simon, Goodmaster, Limp and Cothren
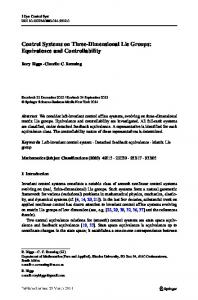
Color data provides an additional layer of analysis that plain, monochromatic DSMs cannot (see fig. 1). For ceramics, especially, color representation can demonstrate the source materials utilized in the vessel's construction (tempering materials, source clays, etc), subtle features not wholly engraved into the artifact, and the possible sourcing of materials to specific archeological site locations. In addition, like ceramics, other representations of other archeological materials are aided by obtaining each's respective color data, providing similar benefits to the researcher analysis or experience of the public viewer.
issues created by the data collection process, possible solutions to Hue Variation, Crosshatching, and Brightness Variation are postulated.
2
Data Collection and Processing
In terms of this project, data management consists of three distinct phases: 1.)acquisition, 2.) processing and 3.)dissemination. For the purposes of this paper, acquisition and processing are the phases to which attention will be provided. Data acquisition took place at the Hampson Museum during two field seasons, consisting of ten weeks each, in the summers of 2007 and 2008. Afterward, data would be processed, utilizing PolyWorks and RapidForm, for the purpose of creating a polygonal mesh of the object. This section aims to describe briefly these two phases of artifact visualization in relation to the Virtual Hampson Museum project. Acquiring data for visualization purposes requires hardware (see Section 3), an understanding of the strengths and weaknesses of said hardware and the development of a standard method through which multiple artifacts of variable shapes and sizes can be acquired. Using this method allows for researchers to control the scanning environment through the use of a light tent. To begin the process, a computer-controlled turntable is placed within the confines of a light tent and a chart is utilized to calibrate the scanner to the rotation axis of the turntable. 3 An artifact will then be placed directly upon the turntable, within the range of the scanner's lens (see fig. 2). Basic-three point ighting is utilitzed around the tent to provide the artifact with a uniform an environment as possible. 4
Figure 1. DSM (left) and color model of a petrified wood celt. To adequately obtain and represent an object's color, the scanning environment in which the object is placed must be strictly controlled through the use of a lighting system. Inasmuch, this paper aims to discuss data collection and processing of three dimensional artifacts and the hardware required to do so. Further attention will be given to the development and refinement of the lighting system utilized by the researchers of the Virtual Hampson Museum project. Finally, examining the
Computer Applications to Archaeology 2009
3
V. Isler et al., Building a 3D Virutal Museum of Native American Baskets," Proceedings of the Third International Symposium on 3D Data Processing, Visualization, and Transmission. Chapel Hill, North Carolina, 2006.
4
"Three-point Lighting" Wikipedi, the Free Encyclopedia. Wikimedia Foundation. 2 Oct 2008.
http://en.wikipedia.org/wiki/Three-point_lighting
Williamsburg, Virginia, USA. March 22-26, 2009
2
Lighting in Three Dimensional Non Contact Digitizing
Figure 2. Artifact placed on computer-controlled turntable (a). Artifact as seen through scanner viewfinder (b). Data acquistion begins after setup A full image of the artifact is gathered by 60o rotations between scans. Each scan is aligned to the calibration measurements previously gathered. For each rotation, six scans are taken for a full 360o (see fig. 3). This process is continued for the remaining parts of the vessel which have not been scanned. The amount of scans per artifact type varies on vessel form; however, most artifacts of the bottle and jar type require 13 scans while a bowl type requires typically 22 scans.
Figure 3. Construction of a "top" rotation from six separate scans: (left) artifact at two scans; (middle) four scans, and (right) six scans. Artifact processing involves the use of automated programs to finalize the product. To complete the visualization and prepare the artifact for dissemination, the individuals scans must be aligned to each other. Extraneous data is removed by automatic overlap reduction alogrithms, followed by a manual removal of similar data. At this point, the color of the vessel is verified by comparing the vessel to field photographs (see fig. 4). Finally, the coordinate system of the data is altered to provide a "face on" view of the item where the Y-Axis is up before creating the object's polygonal mesh.
Computer Applications to Archaeology 2009
Figure 4. Scan detail of artifact after overlap reduction (left; each scan marked as different color) and polygonal mesh of same artifact (right).
3
Hardware
The hardware utilized for the Virtual Hampson Museum project consists of the scanner, turntable and lighting system that was developed for the project. Since hardware is a mjor concern of visualization projects, detail will be given to these materials. This section aims to provide an understanding of what and why we utilize these products. The Konica-Monolta Vivid 9i (see fig. 5) comes with standard manufacturer's specifications that aid in understanding how system operates. The scanner operates best in an ambient lighting condition of 500 lux or less (typical office/lab environment). Unfortunately, the flourescent lights in these environments, when uncontrolled, project a greenish hue onto the artifacts. The scanner records surface data through triangulation with a shared 1/3 frame transfer CCD at 340,000 pixels and color data, which is recorded by the lightreceiving lens. The light-receiving lens is interchangeable, offering differing depths of field and levels of focus. For the Virtual Hampson Museum Project, two lenses were primarily used: the TELE lens (focal distance = 25mm; X/Y/Z input range = 93mm x 69mm x 26mm to 463mm x 347mm x 680mm) and the MIDDLE lens (focal distance = 14mm; X/Y/Z input range = 165mm x 142mm x 42mm to 823mm x 623mm x 1100mm). In addition, the scanner records color with a 0.3 megapixel on-board camera. All data is output at 640 pixels x 480 pixels, while color data is a 24-bit raster scan overlaid onto the DSM.
Williamsburg, Virginia, USA. March 22-26, 2009
3
Smallwood, Payne, Simon, Goodmaster, Limp and Cothren
Figure 7. array.
Figure 5. Konica-Minolta Vivid 9i The light tent and lighting system was developped in respect to the weaknesses of the scanner: the greenish hue given to artifacts scanned in an open environment and the variation caused by vessel shape and uneven lighting. Initially, the light tent (fig. 6) was constructed to give a large space in which the artifact would be placed. The skeleton of the device was made from PVC pipe and then covered with a thin, white cotton sheet. While this solved Hue Variation issues, vessel shape exacerabated Brightness Variation (section 5) in some individuals scans, but most especially in the bowl vessel form. To improve upon this, a professionally made light tent was purchased (fig. 7) that utilizes a translucent light diffusing nylon fabric to better control the scanning environment.
Professional light tent with scanner
In concert with the strengths of the scanner, 5000K flicker-free, white flourescents are utilized with 17” light reflectors (fig. 8). The amount of lights used for the scanning process depend upon vessel color, shape and the amount of ambient light in the room in which the scanning is occuring. Typically, for a low-light environment, all three bulbs will be used in each reflector, regardless of artifact shape or color.
Figure 8. Aluminium 17-inch reflectors.
4 Combining Hardware and Process: Product Photography Methods and Scanning
Figure 6. Light tent with scanner array.
Computer Applications to Archaeology 2009
Effectively capturing an object’s DSM and color data simultenously requires that a lighting system (light tent and diffused lights) that attempts to compensate for the weakness of the scanner’s onboard digitial camera. This hardware, utilized by
Williamsburg, Virginia, USA. March 22-26, 2009
4
Lighting in Three Dimensional Non Contact Digitizing
product photography, offers a means to collecting quality color data through controlling the enivronment in which the artifact will be scanned and providing even lighting of the object during scanning. To that end, the methods must attempt to provide a means of control over variables in the object, the user and the system. Since artifacts vary in size and shape, the placement of the artifact into the light tent is the first and most important step. All light placement and focusing will be done to the location of the artifact in relation to the scanner. The artifact should be placed in the approximate middle of the chosen lens’ range before focusing the scanner on the object. For the Virutal Hampson Museum Project, the majority of the artifacts were digitized with the MIDDLE range lens. For that lens, the object should be placed between 650mm to 750mm from the scanner within the light tent. This distance changes with use of the TELE lens, wihch typically is utilized for small or finely decorated objects. After the artifact has been placed within the scanning environment, light placement and intensity must be considered. This is dependent upon four factors: 1.) physical space; 2.) ambient light; 3.) artifact shape; 4.) and what best illuminates an artifact evenly. Physical space with scanning is always a concern, since the hardware involved do require a fair amount of space. In addition, the ambient light within a room will add to the lights utilized for the scanning process. Artifact shape, however, tends to create the most difficulties for even lightning. Vessels with lugs, handles, steep sides and other designs can, and often, do create shadows and seams on a vessel. To counteract this, most often multiple rotations are taken so that the best data can be selected by the computer. Finally, the amount of lights used and the location of the lights are dependent on what best provides an aritfact with even lighting. If issues with brightness and color are noticeable at this point, it is best to change the setup of the lighting array. After the lights have been placed around the tent, the scanner must be attuned to their location, intensity and temperature. For the Konica-Monolta Vivid 9i, the white balance filter provides an
Computer Applications to Archaeology 2009
automatic means to achieve white balance and should be done at this point.
Figure 9. Encountering brightness variation during a bottom rotation. Data capture begins after the scanner has been white balanced. Before beginning a rotation, a test scan should be run to check for adequate color representation. Once this has been judged to be correct, a full scan rotation can begin. After a full rotation, analyze the data by judging the consistencacy of color temperature in relation to the artifact, consistency of brightness between scans and check for data defects within the DSM such as “crosshatching" (see fig. 9) Once the artifact’s scan is complete, an attempt should be made to maintain the light positioning and intensity by scanning other artifacts of a similar size and shape. Should the lights need to be adjusted in any way, the scanner should be white balanced again before beginning the next artifact.
5
Issues with Lighting
Data defects and issues with color representation are the reasons for the use of a lighting sytem. While a system's use will mostly correct these subsequent problems, attention during scanning must be given to ensure that these problems do not arise. Yet, even though diligence can solve these in field, these problems often arise in the processing stage, especially crosshatching and brightness variation. Early in the Virtual Hampson Museum project, issues with color temperature resulted in artifacts having a green hue in their color data (see fig. 10).
Williamsburg, Virginia, USA. March 22-26, 2009
5
Smallwood, Payne, Simon, Goodmaster, Limp and Cothren
This variation in hue or saturation occured during data capture due to the lack of environmental control. However, this issue was mostly solved by using the lighting system and ensuring white balance in the scanner. However, variation can still occur while using this lighting system, resulting in a desaturated color data return. This can be easily fixed by lowering the amount of light used on the artifact and reapplying white balance to the scanner.
Figure 11: Crosshatching on a bottle. Brightness variation (see fig. 12) provides the most difficult challenge for representing color data. This occurs when the exposure of a scan greatly differes from the other scans around it and is related to 1.)artifact geometry and placement, 2.) lighting placement, and 3.) optimazation of light diffusion. While the causes are known, there is no direct solution. Rather, by altering lighting or artifact placement, the brightness variation between scans might altogether be eliminated or exacerbated. Another option is to use the scanner's Color Read option to recollect the color data. Most often, however, brightness variation will be solved during data processing. Because of the almost unpredictable nature of this problem, brightness variation is a key issue in preventing the scanning process from becoming streamlined.
Figure 10. Variation in hue (left) is fixed by using lighting system (right). Crosshatching is an anomaly that is present often on curved vessels and is not part of the DSM's actual topography. This can occur on any number of scans during a rotation (see fig. 11). These anomalies appear to be an issue between the lighting and the "strength" (Light Density or LD) of the laser, causing the beam to disperse within the scanning environment. A possible solution to correct this anomaly is to double LD in the computer program's scanner settings and then lock that level for an entire rotation. In testing to correct this problem, this reduced the appearance of crosshatching entirely.
Computer Applications to Archaeology 2009
Figure 12. Brightness variation on a bottle as compared to artifact.
6
Conclusions
Collecting quality color data is relatively simple, requiring the controlling over the environment in which the artifact is place and attention to detail, much like artifact photography. As including color offers a more complete representation of an artifact than a monochromatic DSM, utilizing a light system to provide even lighting becomes important and so too do the issues that it creates. Issues with color temperature and crosshatching are rectified by using a professional lighting system, white balance and altering the scanner's settings. Brightness variation, however, must be diminished before this process truly becomes streamlined.
Williamsburg, Virginia, USA. March 22-26, 2009
6
Lighting in Three Dimensional Non Contact Digitizing
Acknowledgements The authors of this paper would like to acknowledge the Arkansas Natural and Cultural Resource Council for the funding of this work. In addition, Marlon Mowdy and Tess Pruett of the Hampson Museum Archeological State Park and Greg Butts, the State Parks Director, for their assistance. Many thanks are also extended to Robert Manifort, for artifact descriptions and his advice on model visualization, and to Tom Green, director, of the Arkansas Archeological Survey.
Bibliography Isler, V., B. Wilson, R. Bajcsy. “Building a 3D Virtual Museum of Native American Baskets.”Proceedings of the Third International Symposium on 3D Data Processing, Visualization, and Transmission. Chapel Hill, North Carolina, 2006. http://ieeexplore.ieee.org/stamp/stamp.jsp?tp=&arnumber=4155825 Payne, Angelia M. et al. "Designing the Next Generation Virtual Musuem: Making 3D Artifacts Available for Viewing and Downloading" Paper presented at 37the Annual International Conference on computer Applications and Quanitative Methods in Archeology (CAA). “Making History Interactive” Williamsburg, Virginia, USA March 22-26. 2009 "Three-point Lighting" Wikipedi, the Free Encyclopedia. Wikimedia Foundation. 2 Oct 2008. http://en.wikipedia.org/wiki/Three-point_lighting Vozikis, Geroge et al., Laser Scanning: A New Method for Recording and Documentation in Archaeology. FIG Working Week 2004, Athens, Greece. 2004. http://www.fig.net/pub/athens/papers/wsa1/WSA1_4_Vozikis_et_al.pdf
Computer Applications to Archaeology 2009
Williamsburg, Virginia, USA. March 22-26, 2009
7