1104
IEEE TRANSACTIONS ON POWER SYSTEMS, VOL. 19, NO. 2, MAY 2004
Linear Performance Indices to Predict Oscillatory Stability Problems in Power Systems Claudio A. Cañizares, Senior Member, IEEE, Nadarajah Mithulananthan, Member, IEEE, Federico Milano, Member, IEEE, and John Reeve, Fellow, IEEE
Abstract—Various indices are proposed and studied to detect and predict oscillatory instabilities associated with Hopf bifurcations (HBs) in power systems. A methodology is also presented to produce a linear profile for these indices. They are based on eigenvalue and singular values of the state and extended system matrices. Their application to several test power systems is presented to demonstrate their usefulness, particularly for online applications. Index Terms—Eigenvalues, Hopf bifurcations, online performance indices, power system oscillations, second-order index, singular values, subsynchronous resonance.
I. INTRODUCTION
N
ONLINEAR phenomena, including bifurcations and chaos, occurring in power system models have been the subject of several studies during the last two decades (e.g., [1]–[7]. Among the different types of bifurcations, saddle-node, limit-induced, and Hopf bifurcations (HBs) have been identified as pertinent to instability problems in power systems [7], [8]. In the case of saddle-node bifurcations, a singularity of a system Jacobian and/or state matrix results in disappearance of steady-state solutions, whereas in the case of certain types of limit-induced bifurcations, the lack of steady-state solutions arises from system controls reaching limits (e.g., generator reactive power limits). Both bifurcation modes typically lead to voltage collapse [9]. HBs, on the other hand, produce limit cycles (periodic orbits) that may lead the system to oscillatory instabilities, as it has been shown in a variety of power system models (e.g., [2], [8], [10], [11]), and observed in practice (e.g., [12], [13]). HBs could arise due to variable net damping, frequency dependence of electrical torque, and voltage control issues (e.g. fast acting automatic voltage regulators in generators) [10], [14], and are typically triggered by system contingencies. In most cases, these bifurcations occur on very stressed systems Manuscript received May 20, 2003. This work was supported in part by NSERC, Canada, and the Electrical and Computer Engineering Department at the University of Waterloo. C. A. Cañizares and J. Reeve are with the Department of Electrical and Computer Engineering, University of Waterloo, Waterloo, ON N2L 3G1 Canada, (e-mail:
[email protected]). N. Mithulananthan is with the Asian Institute of Technology, Pathumthani 12120, Thailand (e-mail:
[email protected]). F. Milano is with the Department of Electrical Engineering, University of Castilla-La Mancha, Ciudad Real 13071, Spain (e-mail:
[email protected]). Digital Object Identifier 10.1109/TPWRS.2003.821460
(i.e., heavily loaded systems). This is a concern nowadays, as many current networks operate near their stability limits due to economical and environmental constraints. Incidents of HB induced system collapses include the Sri Lankan power system disturbance of May 2, 1995 [12], and the Western System Coordination Council (WSCC) system disturbance of August 10, 1996 [13]. With ways of predicting and controlling HBs, the above incidents conceivably could have been avoided by operator action (e.g., load shedding). Further planning studies can then be pursued to place PSS and/or proper FACTS controllers to take care of the oscillation problems in a more permanent basis [15]. The attention of researchers reported in the literature has been more in trying to reveal the presence of HBs, rather than on their prediction. An index to determine the proximity of a system to a HB with respect to a given system parameter would be beneficial, especially as a tool in system operation. While there has been some work done in this area using optimization techniques [16], extensive computations and optimizations are needed every time the topology of the system changes. Methods to detect HBs in general dynamical systems based on using the real part of a “critical” eigenvalue as an index are presented in [17]; however, its nonlinear behavior in some cases makes it impractical for power system applications, as shown in the present paper. A closed-loop monitoring system for detecting impending instability related to HBs in uncertain nonlinear plants is proposed in [18]; an advantage of this methodology is that it gives a warning at a point close to the instability even when no accurate system model is available. However, an earlier prediction of such an event is not possible, as the index is not continuous or smooth. A predictable index with a quasilinear profile is useful in projecting problematic loading levels, for a given generation and load directions, both in planning and operation stages. By predicting a problem (e.g., HB) well in advance, a measure can be devised (e.g., load shedding) to mitigate the problem. In the current paper, linear profile indices are proposed and their practical benefits are demonstrated. This paper is organized as follows: Section II explains briefly the basic theory behind HBs from the point of view of power systems. The proposed indices are discussed in Section III together with a methodology to linearize them. In Section IV, the results obtained for various test systems are presented and discussed, from the point of view of online application of the proposed indices. Finally, the main contributions made in this paper are highlighted in Section V.
0885-8950/04$20.00 © 2004 IEEE
CAÑIZARES et al.: LINEAR PERFORMANCE INDICES TO PREDICT OSCILLATORY STABILITY PROBLEMS IN POWER SYSTEMS
II. HOPF BIFURCATIONS
1105
III. HB INDICES
Power system oscillations problems are classically associated with a pair of complex eigenvalues of system equilibria (operating points) crossing the imaginary axis of the complex plane, from the left half-plane to the right half-plane, when the system undergoes sudden changes (e.g., line outages) [19]. If this particular oscillatory problem is studied using more gradual changes in the system, such as changes on slow varying parameters like system loading, it can be directly viewed as a HB problem [6], [10]. Thus, by predicting or detecting these types of bifurcations well in advance to the onset of a possible oscillatory instability, this type of problem can be avoided. HBs are characterized by periodic orbits or limit cycles emerging around an equilibrium point. These types of bifurcation are also known as oscillatory bifurcations. In order to explain the basic theory behind the HB from the point of view of power system, consider the following DAE model of a power system:
A. Eigenvalue Index (EVI) In [17], the real part of the complex pair of eigenvalues crossing the imaginary axis (critical eigenvalues) is used as an index to predict the HB point. Hence, in this paper, the behavior of the following index is studied in power system applications: (2) where
is the real part of the critical eigenvalue .
B. First Index Since at a HB point the system Jacobian has a simple pair of purely imaginary eigenvalues, the problem can be restated as follows: For the system state matrix , a complex pair of eigenvalues can be rewritten as (3) where ; and are the real and imaginary parts of the critical eigenvalue , respectively; is the associated eigenvector. If real and imaginary and parts are separated from (3), it follows that:
(1) is a vector of state variables, such as generator where internal angles and rotational speed; is a vector of algeis a set braic variables, such as load voltage magnitudes; of uncontrollable parameters, such as active and reactive power load variations; and is a set of controllable parameters, such as AVR set points. When the parameters and/or vary, the equilibrium points ( , ) change, and so do the eigenvalues of the corresponding system state matrix. The equilibrium points are asymptotically stable if all the eigenvalues of the system state matrix have negative real parts. The point where a complex conjugate pair of eigenvalues reach the imaginary axis with respect to the changes in ( , ), say ( , , , ), is known as a HB point. At a HB point ( , , , ), the following conditions are satisfied [17]. . 1) 2) The Jacobian matrix evaluated at ( , , , ) should only have a simple pair of purely imaginary eigenvalues . 3) The rate of change of the real part of the critical eigenvalues with respect to a varying system parameter, say , should be nonzero. If this is the case, there is a limit cycle at ( , , , ) with a period . These conditions imply that a HB corresponds to a system equilibrium state with a pair of purely imaginary eigenvalues with all other eigenvalues having nonzero real parts, and that the pair of bifurcating or critical eigenvalues cross the imaginary axis as the parameters ( , ) change, yielding oscillations in the system.
(4)
Since , at a HB where , the modified matrix becomes singular. Observe that this matrix is also singular at a saddle-node bifurcation, as in this case. Following the same criteria previously proposed to define indices for saddle-node bifurcations [9], the singular value of the modified state matrix is used here as an index for detecting HBs. Thus, the first HB index (HBI) is defined as follows: (5) is the minimum singular value of the modified state where , which becomes zero at a Hopf or saddle-node bimatrix furcation point. C. Second Index The index has the problem that it requires the computation of the state matrix , which is computationally expensive, . This problem as it requires the inverse of the Jacobian can be avoided if the full system matrix is used. Thus, using a generalized eigenvalue formulation, for a complex pair of eigenvalues, it follows that: (6)
1106
IEEE TRANSACTIONS ON POWER SYSTEMS, VOL. 19, NO. 2, MAY 2004
where
, , , and . By separating the real and imaginary parts and rearranging these equations
of functions can be made linear by dividing the function by its gradient at each point [9], since (12) Hence, by following the same idea, a linearized version for each of the , , and indices is proposed here (13)
(7) at a HB, the matrix becomes singular; notice Since that this also holds at a saddle-node bifurcation point. Therefore, the minimum singular value of the modified full Jacobian matrix can be used as another index to indicate proximity to a Hopf or a saddle-node bifurcation. Thus (8) This index is computationally more efficient than , as full . advantage can be taken of the sparsity of and behave similarly Observe that both indices to the singular value index of and , respectively, when the critical eigenvalue is real (the critical eigenvalue is defined here as the eigenvalue closest to the imaginary axis as the system parameter changes). Thus, for
(9) and
(10) D. Linearization Indices based on first-order information such as critical eigenvalues and minimum singular values may be inadequate to predict possible instability problems in practical power systems, due to large discontinuities in the presence of system control limits (e.g., generator limits). However, this problem can be reduced by considering a “second order” index (i.e., an index defined by the index divided by its gradient with respect to the parameter under study), which exploits additional information embedded in these indices, as suggested in [20]. Thus, it has been observed that the critical eigenvalue and minimum singular value of a power system Jacobian can be approximated using the following equation [9]: (11) where stands for the critical eigenvalue or minimum singular value , with suitable values of the scalar positive constants , , and , and being a given varying parameter. These types
(14) (15) It is worth mentioning that these indices can be applied to any nonlinear dynamical system to predict and detect HBs. However, the application to power systems is the primary concern of this paper. IV. SIMULATION RESULTS , , and , as well as , The HB indices , and , were applied to several power system examples. Although most of the examples presented in this section are related to low-frequency oscillations, an example of oscillatory problem associated with subsynchronous resonance phenomena is also presented and discussed. A. Low-Frequency Oscillations In all of the examples discussed in this section, loads were modeled as constant impedance models for stability studies, since these are the less onerous loads for the system (if HB problems are observed with these types of load models, similar problems could be reasonably expected with more stressful loads such as constant power load models). Furthermore, most of the commercial power system analytical tools use this as a default load model for dynamic analyzers. For the associated power flow studies, all of the loads were represented as typical constant real and reactive power models, and these are assumed to change according to
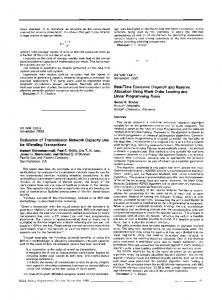
(16) where and are the initial or base real and reactive power levels, respectively, and is the varying parameter representing the loading factor. 1) Three-Bus System: A one-line diagram of the simplest test system used in this paper is shown in Fig. 1 [21]. Both generators were modeled in detail with standard exciters type AC4a [21], and hydraulic governors. The nominal load is 900 MW and 300 Mvar. Fig. 2 shows the corresponding P-V curves at bus 3, for the base case and also for a line 2–3 outage. The real and reactive power required by the system are shared equally by both generators, as the system load increases up to the nose point. The HB points are also depicted in this figure, as well as the load line associated with an impedance load model; the crossing points
CAÑIZARES et al.: LINEAR PERFORMANCE INDICES TO PREDICT OSCILLATORY STABILITY PROBLEMS IN POWER SYSTEMS
1107
Fig. 1. Three-bus test system.
Fig. 3. Locus of the critical eigenvalue for the three-bus system base case.
Fig. 2.
P-V curves at bus 3 for the three-bus system.
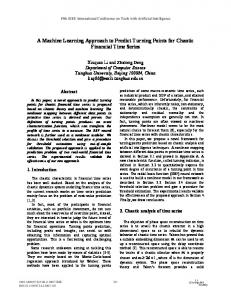
of this line with the corresponding P-V curves define an equilibrium point of the associated dynamic system model. Fig. 3 shows the locus of the critical eigenvalue for the base case. As it can be seen in this figure, only the critical eigenvalue moves to the right as the loading parameter changes, and crosses the imaginary axis creating a HB condition; the rest of the eigenvalues do not change significantly with changes in (the zero eigenvalue is due to the absence of an infinite bus in the eigenvalue computations). A participation factor analysis indicates that the dominant state variables associated with the critical mode (HB modes) are the and of G2. , , and , Figs. 4-7 depict the HB indices and their linearized versions , , and , respectively. In all of these figures, the points at which generators reach reactive power limits are clearly highlighted. The second order or gradient information of the HB indices required for the , , and are calculated nucomputation of merically. All of these indices, especially the linearized ones, show linear profiles with respect to the loading factor . According to the indices, loading the base system beyond 0.45 p.u. is problematic, showing also that a line 2–3 outage could lead the system to an oscillatory unstable condition when the system operates beyond a 0.163-p.u. loading factor level. All of these results were confirmed through time-domain simulations. 2) Two-Area System: Fig. 8 is the one-line diagram of the “classical” two-area system proposed in [19] for oscillation studies. The topology of the system is symmetrical with respect to bus 8; however, the loads and the limits of individual generator are not equal in both areas. All of the generators were modeled in detail with a simple exciter, except for G2 which is modeled without a voltage-control loop. A simple turbine governor is also considered in each of the generators, except
Fig. 4.
Eigenvalue index for the three-bus system.
Fig. 5. HB indices for the three-bus system.
for G3 which is modeled without a governor. The total system load is 2734 MW and 200 Mvar. Figs. 9, 10, and 11 show the corresponding P-V curves, and eigenvalue and HB indices, for the base case and for a line 9–10 outage, and Figs. 12 and 13 show the linearized version of the
1108
IEEE TRANSACTIONS ON POWER SYSTEMS, VOL. 19, NO. 2, MAY 2004
Fig. 6. Linearized eigenvalue index for the three-bus system.
Fig. 7.
Linearized HB indices for the three-bus system.
Fig. 9. P-V curves at bus 11 for the two-area system.
Fig. 10.
Eigenvalue index for the two-area system.
Fig. 11.
HB indices for the two-area system.
Fig. 8. Two-area test system.
eigenvalue and HB indices, respectively; no generator reactive power limits are reached in this case. Once again, the gradient information, which is necessary for obtaining the linearized HB indices, was calculated numerically. Observe the linear behavior of the indices. According to the results, loading the system beyond 0.081 p.u. is not feasible. A participation factor analysis indicates that the dominant state variables associated with the critical mode (HB mode) are and for G3. These results were verified using the time-domain analyses. 3) IEEE 50-Machine System: The IEEE 50-machine system shown in Fig. 14 is an approximated model of an actual power system, and was originally developed for stability studies [22]. It consists of 145 buses and 453 lines, including 52 fixed tap
transformers. There are 60 loads for a total of 2.83 GW and 0.80 Gvar. 1) Case I: Seven of the generators are modeled in detail in this case, including complete models of their exciters. P-V curves including HB points for the base case and for a line 79–90 outage are shown in Fig. 15. The HB indices and the linearized version of the indices are given in
CAÑIZARES et al.: LINEAR PERFORMANCE INDICES TO PREDICT OSCILLATORY STABILITY PROBLEMS IN POWER SYSTEMS
1109
or not, depending on the software package used of the extended matrix information required to compute the and corresponding indices, the latter could not be computed in this particular case.
B. Subsynchronous Resonance Example
Fig. 12. Linearized eigenvalue index for the two-area system.
Fig. 13.
Linearized HB indices for the two-area system.
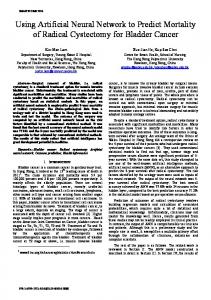
Figs. 16, 17, 18, and 19, respectively; some of the points at which the generators reach reactive limits are also highlighted in all of these graphs. The line 79–90 outage was chosen since this line is one of the most heavily loaded lines in the weakest area of the system. Once again, observe the linear or quasilinear profile of these indices with respect to the loading factor . In this case too, the gradient information of the HB indices with respect to the parameter was calculated numerically. All of the HB points were confirmed by time-domain simulations. 2) Case II: In this case, six generators are modeled in detail with simple exciter models. Figs. 20, 21, 22, and 23 , , and corresponding and depict the results. Observe the general nonlinear profile of , , and indices which, in this case, the is basically due to system modes other than the initial critical eigenvalue or singular value becoming critical as generator limits are encountered. Observe, however, that the presents a slightly better profile than the other indices. It is important to highlight the fact that due to the differences on the types of simplified exciter models available in the commercial software packages used to obtain the results presented in this paper, as well as the availability
Subsynchronous resonance (SSR) is a well-known problem of undamped oscillations that may occur when the transmission line to which the machine is connected is compensated by a series capacitor, as depicted in Fig. 24. In this case, the dynamics of the RLC circuit cannot be neglected, since the line presents two modes whose frequency can be roughly estimated , where is the base frequency in rad/s. as For typical values of the inductive and capacitive reactances, the lower of these two frequencies can be close to one of the mechanical oscillations of the generator shaft. Thus, beyond a certain value of the compensation level, the machine may experience a negative damping of one of the mechanical modes that results in dangerous stress to the shaft. and are used here to predict The HB indices the SSR point, with respect to the capacitor compensation which, in this case, is the parameter . The system model used in this paper is identical to the one presented in [3] and [4]. Thus, a complex mode crosses the imaginary axis as increases, creating a HB associated with a SSR problem, as shown in Fig. 25; observe that a pair of complex eigenvalues with a frequency of , about 26 Hz cross the imaginary axis at which approximately corresponds to a 53% compensation level. (It should be noted that Fig. 25 is somewhat similar to Fig. 2 in values of interest to this paper, that is, the values [4] for the of near the HB associated with the SSR problem, which is is further inwhere the system first becomes unstable. As creased, other bifurcations and larger changes in the frequency of the eigenvalues may be observed in the system, as discussed and depicted in [4].) and , and and are illustrated The in Figs. 26 and 27, respectively. Notice the quasilinear and , which can be used to predict smooth behavior of the the problematic compensation level and, thus, avoid the onset of oscillations. In this case, since the model used does not include algebraic equations, there is no difference between and , and and . C. Discussion Among all indices, the less expensive computationally is clearly ; on the other hand, is computationally less , as shown in Table I, where the time demanding than with respect to the computation of savings of computing are presented. Observe that the savings increase with the size of the power system, as expected, since the calculation of the inverse of the matrix is not needed, exploiting the sparsity calculations. It is also important of the Jacobian in the to highlight the fact that the computational cost of obtaining is the minimum singular values needed for computing not very significant, once the critical eigenvalue is determined, since a simple inverse iteration technique can be readily applied
1110
Fig. 14.
Fig. 15.
IEEE TRANSACTIONS ON POWER SYSTEMS, VOL. 19, NO. 2, MAY 2004
IEEE 50-machine test system.
P-V curve at bus 92 for the IEEE 50-machine system, case I.
to the extended matrix to determine this value in a few iterations. Furthermore, the numerical linearization of all these indices is not significant from the computational point of view, as it only requires simple operations with adjacent index values. The calculation of the proposed indices online requires the state matrix or the extended system matrix , as well as the
value of the critical eigenvalue . The information needed for the construction of these matrices is a fast power flow solution, along with the system topology update, models, and data of machines and other controllers of interest. Typically, these system data, both static and dynamic, are available in modern control centers, and getting fast and multiple power flow solutions is not an issue nowadays. Once the matrices are set up, any efficient eigenvalue algorithm can be used to quickly compute . Thus, a reliable detection of HBs using these indices is certainly feasible. As shown in the several examples discussed in this paper, , , or are adequate for detection of HBs, as they all show a smooth profile with respect to the varying paindex presenting some comrameter in all cases, with the putational advantages. However, these indices do not present a linear profile in all cases (e.g., 50-machine Case II, and SSR example) and, hence, are not always appropriate for making reliable predictions of the onset of HBs. Hence, based on the quasilinear profile of the proposed linearized indices, particuindices, in most cases, and given the fact that larly the the additional computational costs are not excessive, especially , one can reasonably argue that the index for
CAÑIZARES et al.: LINEAR PERFORMANCE INDICES TO PREDICT OSCILLATORY STABILITY PROBLEMS IN POWER SYSTEMS
Fig. 19.
Linearized HB indices for the IEEE 50-machine system, case I.
Fig. 17. HB indices for the IEEE 50-machine system, case I.
Fig. 20.
Eigenvalue index for the IEEE 50-machine system, case II.
Fig. 18.
Fig. 21.
HB index for the IEEE 50-machine system, case II.
Fig. 16.
Eigenvalue index for the IEEE 50-machine system, case I.
Linearized eigenvalue index for the IEEE 50-machine system, case I.
appears to be the best option for a variety of practical power system applications. The power system examples presented here, with different dynamic characteristics as well as varying size and complexity, resemble practical power systems. Hence, the application of the proposed indices to the online monitoring of a practical power
1111
system is shown here to be a feasible proposition. Furthermore, or the in practical systems, information of the value of frequency of the problematic modes are typically known (e.g., WSCC interarea modes; Ontario Hydro local modes); thus, by inserting the expected value of in the state matrices, the and indices can be calculated without actually
1112
Fig. 22.
Fig. 23.
Fig. 24.
Fig. 25.
IEEE TRANSACTIONS ON POWER SYSTEMS, VOL. 19, NO. 2, MAY 2004
Linearized eigenvalue index for the IEEE 50-machine system, case II. Fig. 26.
Eigenvalue index and its linearization for the SSR example.
Fig. 27.
HB index and its linearization for the SSR example.
Linearized HB index for the IEEE 50-machine system, case II.
1 bus system with compensated line.
Generator-
Locus of the critical eigenvalue for the SSR example.
having to compute the critical eigenvalue, thus reducing the
TABLE I TIME SAVINGS OF COMPUTING WITH RESPECT TO HBI
HBI
computational costs associated with determining the value of these indices. In a real scenario, a power system faces varying operation conditions (e.g., load increase with different directions; line outages). Fig. 28 illustrates possible profiles of HB indices for various system conditions (i.e., base case and a line outage case with different load directions). In the case of a change in operating conditions, the proposed HB indices follow a different profile. A possible profile of the HB indices as an operator would see it in real time is depicted in Fig. 29. By monitoring the index online and making predictions based on linear extrapolations of the index, timely remedial measures, such as load shedding, can be implemented when the indices hit a given threshold value.
CAÑIZARES et al.: LINEAR PERFORMANCE INDICES TO PREDICT OSCILLATORY STABILITY PROBLEMS IN POWER SYSTEMS
1113
REFERENCES
Fig. 28. HB index for various operating conditions.
Fig. 29.
HB index as an online operating tool.
The determination of adequate threshold values, however, is certainly not a simple task, as it requires multiple offline simulations for a variety of system operating conditions, as well as a good operational knowledge of the system. Furthermore, observe that the linear extrapolations that would allow operators to somewhat adequately predict possible stability problems at a given operating condition have to be continuously reassessed and weighed against the operators’ knowledge of the system before taking any remedial emergency actions, given the ever changing network conditions. Thus, all of these indices must be considered as additional, albeit important, tools on the operator’s toolbox to help him/her make adequate operating decisions online.
V. CONCLUSION This paper studies and proposes various indices to predict and detect proximity to the HB points in nonlinear systems and, hence, the onset of oscillatory stability problems such as interarea, local mode, and subsynchronous resonance oscillations in power systems. It is shown that of the proposed indices, the index presents certain advantages that make it suitable for online applications, as the smooth and quasilinear behavior of this index allows to reliably predict the onset of oscillatory problems in a variety of practical power system applications.
[1] H. G. Kwatny, A. K. Pasrija, and L. Y. Bahar, “Static bifurcation in electric power networks: loss of steady-state stability and voltage collapse,” IEEE Trans. Circuits Syst., vol. 33, pp. 981–991, Oct. 1986. [2] V. Ajjarapu and B. Lee, “Bifurcation theory and its application to nonlinear dynamical phenomena in an electrical power system,” IEEE Trans. Power Syst., vol. 7, pp. 424–431, Feb. 1992. [3] W. Zhu, R. R. Mohler, R. Spee, W. A. Mittelstadt, and D. Maratukulam, “Hopf bifurcations in a SMIB power system with SSR,” IEEE Trans. Power Syst., vol. 11, pp. 1579–1584, Aug. 1996. [4] Y. Mitani, K. Tsuji, M. Varghese, F. F. Wu, and P. Varaiya, “Bifurcations associated with sub-synchrouous resonance,” IEEE Trans. Power Syst., vol. 13, pp. 139–144, Feb. 1998. [5] N. Mithulananthan, C. A. Cañizares, and J. Reeve, “Hopf bifurcation control in power system using power system stabilizers and static var compensators,” in Proc. North Amer. Power Symp., San Luis Obispo, CA, Oct. 1999, pp. 155–163. [6] J. Li and V. Venkatasubramanian, “Study of Hopf bifurcation in a simple power system model,” in Proc. 39th Conf. Decision Contr., Sydney, Australia, Dec. 2000, pp. 3075–3079. [7] V. Venkatasubramanian, H. Schattler, and J. Zaborszky, “Dynamics of large constrained nonlinear system—a taxonomy theory,” Proc. IEEE: Special Issue on Nonlinear Phenomena Power Syst., vol. 83, no. 11, pp. 1530–1561, Nov. 1995. [8] C. A. Cañizares, F. L. Alvarado, C. L. DeMarco, I. Dobson, and W. F. Long, “Point of collapse method applied to AC/DC power systems,” IEEE Trans. Power Syst., vol. 7, pp. 673–683, May 1992. [9] Voltage Stability Assessment: Concepts, Practices and Tools (2002, Aug.). http://www.power.uwaterloo.ca [Online] [10] E. H. Abed and P. P. Varaiya, “Nonlinear oscillations in power systems,” Int. J. Elect. Power Energy Syst., vol. 6, pp. 37–43, 1984. [11] W. D. Rosehart and C. A. Cañizares, “Bifurcation analysis of various power system models,” Int. J. Elect. Power Energy Syst., vol. 12, pp. 171–182, 1999. [12] N. Mithulananthan and S. C. Srivastava, “Investigation of a voltage collapse incident in Sri Lankan power system network,” in Proc. Energy Manage. Power Delivery, Singapore, Mar. 1998, pp. 47–52. [13] C. Alsberg. (1996, Sept.) WSCC Issues Preliminary Rep. on August Power Outage: PRESS RELEASE. Tech. Rep., WSCC. [Online]http://www.wscc.com/augdist.htm [14] C. D. Vournas, M. A. Pai, and P. W. Sauer, “The effect of automatic voltage regulation on the bifurcation evolution in power systems,” IEEE Trans. Power Syst., vol. 11, pp. 37–43, Nov. 1996. [15] N. Mithulananthan, C. A. Cañizares, J. Reeve, and G. J. Rogers, “Comparison of PSS, SVC and STATCOM controllers for damping power system oscillations,” IEEE Trans. Power Syst., vol. 18, pp. 786–792, May 2003. [16] S. K. Joshi and S. C. Srivastava, “Estimation of closest Hopf bifurcation in electric power system,” in Proc. 12th Power Syst. Comput. Conf., Aug. 1996. [17] R. Seydel, Practical Bifurcation and Stability Analysis: From Equilibrium to Chaos, 2nd ed. New York: Springer-Verlag, 1994. [18] T. Kim and E. H. Abed, “Closed-loop monitoring systems for detecting impending instability,” IEEE Trans. Circuits Syst., vol. 47, pp. 1479–1493, Oct. 2000. [19] P. Kundur, Power System Stability and Control. New York: McGrawHill, 1994. [20] A. Berizzi, P. Finazzi, D. Dosi, P. Marannino, and S. Cors, “First and second order methods for voltage collapse assessment and security enhancement,” in Proc. IEEE/Power Eng. Soc. Winter Meeting, New York, Feb. 1997. [21] Power System Toolbox Version 2.0: Load Flow Tutorial and Functions, Cherry Tree Scientific Software, Colborne, ON, 1991–1999. [22] V. Vittal, “Transient stability test system for direct stability methods,” IEEE Trans. Power Syst., vol. 7, pp. 37–42, Feb. 1992.
Claudio A. Cañizares (SM’00) received the Electrical Engineer diploma from the Escuela Politécnica Nacional (EPN), Quito, Ecuador, in 1984, where he held various teaching and administrative positions from 1983 to 1993. He received the M.Sc. and Ph.D. degrees in electrical engineering from the University of Wisconsin-Madison, in 1988 and 1991, respectively. Currently, he is a Professor and Deputy Chair of the Electrical and Computer Engineering Department at the University of Waterloo, Waterloo, ON. His research activities include the study of stability, control, modeling, and computational issues in power systems.
1114
Nadarajah Mithulananthan (M’02) was born in Sri Lanka. He received the B.Sc. degree in engineering from the University of Peradeniya, Sri Lanka, in 1993, the M.Eng. degree from the Asian Institute of Technology, Bangkok, Thailand, in 1997, and the Ph.D. degree in electrical and computer engineering from the University of Waterloo, Waterloo, ON, Canada, in 2002. Currently, he is an Assistant Professor at the Asian Institute of Technology, Bangkok, Thailand. He was an Electrical Engineer with the Generation Planning Branch of the Ceylon Electricity Board, Sri Lanka, and a Researcher at Chulalongkorn University, Bangkok, Thailand. His research interests include voltage stability and oscillation studies on practical power systems and applications of FACTS controllers in transmission and distribution systems.
Federico Milano (M’03) received the electrical engineering and Ph.D. degrees from the University of Genoa, Genoa, Italy, in 1999 and 2003, respectively. Currently, he is an Assistant Professor of Electrical Engineering at the Universidad de Castilla–La Mancha, Ciudad Real, Spain. From 2001 to 2002, he was a Visiting Scholar with the Electrical and Computer Engineering Department at the University of Waterloo, Waterloo, ON, Canada. His research interests are voltage stability and electricity markets, and computer-based power system analysis and control.
IEEE TRANSACTIONS ON POWER SYSTEMS, VOL. 19, NO. 2, MAY 2004
John Reeve (F’81) received the B.Sc., M.Sc., Ph.D., and D.Sc. degrees from the University of Manchester Institute of Science and Technology (UMIST), Manchester, U.K. Currently, he is an Adjunct Professor in the Department of Electrical and Computer Engineering at the University of Waterloo, where he has been since 1967. He was involved in the development of protective relays with English Electric, Stafford, U.K., from 1958 to 1961, and then he was a Lecturer at UMIST. He was a project manager with Electric Power Research Institute, Palo Alto, CA, from 1980 to 1981, and was with Institut de Recherche d’HydroQuebec (IREQ), QC, Canada, from 1989 to 1990. His research interests since 1961 have been HVDC transmission and high power electronics. Dr. Reeve was chair of the IEEE DC Transmission Subcommittee for eight years, and is a member of several IEEE and CIGRE committees on dc transmission and FACTS. He was awarded the IEEE Uno Lamm High Voltage Direct Current Award in 1996. He is the President of John Reeve Consultants Ltd.