5574 • The Journal of Neuroscience, May 17, 2006 • 26(20):5574 –5581
Behavioral/Systems/Cognitive
Linear Summation of Cat Motor Cortex Outputs Christian Ethier,1 Laurent Brizzi,1 Warren G. Darling,2 and Charles Capaday1 1
Department of Anatomy and Physiology, Faculty of Medicine, Universite´ Laval, Que´bec, Que´bec, Canada G1J 2G3, and 2Department of Exercise Science, The University of Iowa, Iowa City, Iowa 52242
Recruitment of movement-related muscle synergies involves the functional linking of motor cortical points. We asked how the outputs of two simultaneously stimulated motor cortical points would interact. To this end, experiments were done in ketamine-anesthetized cats. When prolonged (e.g., 500 ms) trains of intracortical microstimulation were applied in the primary motor cortex, stimulus currents as low as 10 –20 A evoked coordinated movements of the contralateral forelimb. Paw kinematics in three dimensions and the electromyographic (EMG) activity of eight muscles were simultaneously recorded. We show that the EMG outputs of two cortical points simultaneously stimulated are additive. The movements were represented as displacement vectors pointing from initial to final paw position. The displacement vectors resulting from simultaneous stimulation of two cortical points pointed in nearly the same direction as the algebraic resultant vector. Linear summation of outputs was also found when inhibition at one of the cortical points was reduced by GABAA receptor antagonists. A simple principle emerges from these results. Notwithstanding the underlying complex neuronal circuitry, motor cortex outputs combine nearly linearly in terms of movement direction and muscle activation patterns. Importantly, simultaneous activation does not change the nature of the output at each point. An additional implication is that not all possible movements need be explicitly represented in the motor cortex; a large number of different movements may be synthesized from a smaller repertoire. Key words: population vector hypothesis; motor cortex; cortical circuits; directional motor control; motor cortical function; neuronal ensembles
Introduction Studies involving the superposition of topographical maps of the motor cortex obtained by microstimulation and morphological connectivity maps obtained by tracer injections in physiologically identified sites have shown that motor cortical zones controlling various forelimb segments and those controlling antagonistic muscles are strongly interconnected by intrinsic horizontal collaterals (Huntley and Jones, 1991; Keller, 1993; Tokuno and Tanji, 1993; Capaday et al., 1998). These intracortical connections have been suggested to be the anatomical substrate of muscle synergies involved in coordinated multijoint movements (Huntley and Jones, 1991). Physiological experiments involving single-unit recordings, brain imaging, or magnetic brain stimulation have shown that movements of the arm or hand engage large areas of the motor cortex (Schieber and Hibbard, 1993; Amassian et al., 1995; Sanes et al., 1995; Devanne et al., 2002). Together, the anatomical and physiological data suggest that, during natural movements, widespread motor cortical loci are functionally linked. The purpose of the present study was to further our understanding of the rules by which motor cortical points interact. For example, we have shown that the functional Received Dec. 14, 2005; revised April 12, 2006; accepted April 14, 2006. This work was funded by the Canadian Institutes for Health Research. L.B. was supported by the Fond de la Recherche Me´dicale. The expert and dedicated technical assistance of F. Roy, P. Vachon, and G. Charette is gratefully acknowledged. We thank M. A. Imbeault and R. V. Ung for their participation in some of the experiments. We also thank Dr. C. Van Vreeswijk for his comments and suggestions on a draft of this manuscript. Correspondence should be addressed to Dr. C. Capaday, Centre de Recherche Universite´ Laval Robert Giffard, Brain and Movement Laboratory, F-6500, 2601 de la Canardie`re, Que´bec, Que´bec, Canada G1J 1G3. E-mail:
[email protected]. DOI:10.1523/JNEUROSCI.5332-05.2006 Copyright © 2006 Society for Neuroscience 0270-6474/06/265574-08$15.00/0
linking of cortical points leading to a muscle synergy involves not only the selection of these points by excitation but also their selected release from inhibition (Schneider et al., 2002). Here we sought to determine how the movement evoked by simultaneous microstimulation of two cortical points compares with the movements evoked by each point on its own. As demonstrated recently by Graziano et al. (2002), prolonging the duration of microstimulation to ⬃400 –500 ms, approximately equal to the duration of natural movements, evokes complete and seemingly goaldirected movements in the macaque. We found this to be also true in the ketamine-anesthetized cat. This afforded us a method to experimentally control motor cortex outputs and determine how separate outputs interact. Parts of this work have been published previously in abstract form (Ethier et al., 2004).
Materials and Methods The data reported herein were obtained from experiments on seven male cats weighing between 3.5 and 4.9 kg. The study was approved by the local ethics committee and conformed to the procedures outlined in the Guide for the Care and Use of Laboratory Animals, published by the Canadian Council for Animal Protection. Animal preparation. Details on surgical procedures, electrophysiological methods, and homeostatic measures used in the present study can be found in previous reports from this laboratory (Capaday et al., 1998; Schneider et al., 2001, 2002; Capaday and Rasmusson, 2003). Briefly, the animals were anesthetized with an intramuscular injection of ketamine (33 mg/kg) and xylazine (1 mg/kg). Once the surgical procedures terminated, a perfusion pump was connected to a cannula in the femoral vein, and a steady flow of anesthetic (10 –30 mg/h ketamine, depending on the animal) was delivered throughout the experiment. The animal’s temperature was maintained near 37°C by a heating blanket wrapped around the
Ethier et al. • Linear Summation of Motor Cortex Outputs
animal’s trunk and by an overhead heat lamp. The blood pressure was maintained at ⬃100 mmHg. A long skin incision was made to expose the muscles of the left forelimb and shoulder. A pair of multi-stranded, stainless steel wires, separated by ⬃1.5 cm, was inserted in eight of the following muscles, depending on the animal: the flexor digitorium profondus, the flexor carpi radialis and palmaris longus (PL), extensor carpi radialis longus and brevis (ECRl, ECRb), the lateral head of the triceps (TriLat), the brachialis (Br), the clavobrachialis (CBr), the biceps (Bi), the teres major, the latissimus dorsi (LD), the spinodeltoid (SpD), the pectoralis major (PMj), and the pectoralis minor (PMn). The electromyographic (EMG) signals were amplified by a factor of 1000, high-pass filtered at 20 Hz, rectified, and low-pass filtered at 1000 Hz. Microstimulation procedures. Stainless steel microelectrodes ranging in impedance from 500 k⍀ to 1 M⍀ were used to microstimulate the motor cortex (area 4␥). Trains of stimuli 500 ms in duration were delivered randomly at intervals between 2.5 and 7 s in layer V of the right motor cortex. The duration of single pulses was 0.2 s, and the rate was usually set at 333 Hz. In some experiments, stimulus rates ranging from 50 to 333 Hz were used. Cortical points that evoked distinctly different movements were identified. The output of each cortical point in terms of evoked EMG activity and limb movement (see below) was determined as a function of stimulus intensity or rate. The input/output curves allowed us to determine the range of stimulus intensities that evoked EMG responses whose amplitude were less than the maximum evocable from that point (i.e., stimuli that evoked submaximal responses). Once the input/output properties were measured, two points were simultaneously stimulated at various stimulus intensities to determine the nature of their interaction. Currents as low as 10 A evoked visible coordinated movements, and threshold values were typically between 10 and 20 A. Stimulus currents never exceeded 100 A. Disinhibition of cortical points. In three experiments, local GABAergic synaptic transmission was reduced at an identified cortical point by iontophoretic ejection of the GABAA antagonists bicuculline methiodide or gabazine (Schneider et al., 2002; Capaday and Rasmusson, 2003). The drugs were dissolved at a concentration of 10 mM in distilled water and ejected from micropipettes having tip diameters of ⬃2–3 m with positive current of 100 nA. Gabazine is a specific GABAA receptor antagonist, whereas bicuculline may also block calcium-activated potassium channels (Seutin and Johnson, 1999). However, the results obtained with either drug were similar. Bicuculline effects proved to be reversible after ⬃1 h, whereas those of gabazine were protracted, lasting several hours. Autoradiographic and electrophysiological experiments have shown that bicuculline is bounded in a radius of ⬃600 m from the tip of the micropipette (Jacobs and Donoghue, 1991; Schneider et al., 2002). Analysis of EMG output. The microstimulation-evoked EMG activity was sampled at 2 kHz. The duration of the sampled sweeps was 800 ms, including a 100 ms prestimulus period. Typically eight sweeps were sampled, stored on hard disk, and averaged in real time. The integral of the rectified evoked EMG activity was determined for each muscle. Any background EMG activity preceding the stimulus was subtracted. These integrated EMG (IEMG) values were expressed as eight-dimensional EMG vectors. This representation has been termed a musclecoordination-pattern vector (Valero-Cuevas, 2000). Each element of these vectors represents the net evoked IEMG activity of a muscle. For a ᠬ x is defined by cortical point x, the muscle-coordination-pattern vector M ᠬ x ⫽ IEMG1 ⫻ m the following: M ᠬ 1 ⫹ IEMG2 ⫻ m ᠬ 2 ⫹ . . . ⫹ IEMG8 ⫻ m ᠬ 8, where IEMGi is the value of the integrated EMG activity of the i-th muscle and m1, m2, . . . , m8 are orthogonal unit vectors in muscle space. The muscle-coordination pattern evoked by simultaneous stimulation of ᠬ 1⫹2) was compared with the resultant (M ᠬ res) of the two cortical points (M ᠬ res ⫽ M ᠬ 1⫹ vectors obtained by separate stimulation of the two points (M ᠬ 2). The magnitude as well as the direction of the experimentally deterM ᠬ 1⫹2) was compared with the remined muscle-coordination vector (M ᠬ res). The difference of their direction, or equivalently sultant vector (M the correlation between the vectors, was determined from the dot product given by the following:
ᠬ res 䡠 M ᠬ 1⫹2 M cos ⫽ ᠬ ᠬ 1⫹2 兩 兩Mres兩 兩M
J. Neurosci., May 17, 2006 • 26(20):5574 –5581 • 5575
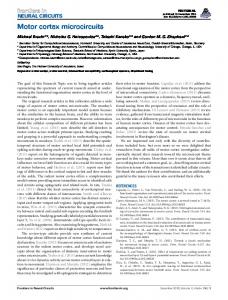
Figure 1. Vector representation of evoked movements. A, Displacement vectors (Dជ) were measured from the initial to the final position attained by the paw. B, The resultant vector (Dជres) is the sum of the vectors (Dជ1 and Dជ2) obtained by stimulation of two points separately. The difference in the direction () of the resultant vector and that obtained by simultaneous stimulation of the two points (i.e., the experimental vector Dជ1⫹2) was determined by the rules of vector algebra. ᠬ 1⫹2 and M ᠬ res represent the Euclidean magnitude of the experiwhere M mental and resultant vectors, respectively. The vector dot product is identically Pearson’s product-moment correlation coefficient (r), for 0-mean vectors. Paw kinematic measurements and analysis. The kinematics of the microstimulation-evoked movements were measured by a small (1 ⫻ 2 cm) six-dimensional electromagnetic sensor (Polhemus, Colchester, VT) placed on the tip of the paw. The kinematic signals were digitized at 120 Hz. Only the position coordinates in three orthogonal (x, y, z) directions were used in the present analysis. The body of the cat was laid on a cushion with its forelimbs hanging perpendicular to the ground and free to move in all directions against gravity. We determined displacement vectors from initial to final paw position (Fig. 1). The coordinates of these vectors were obtained by averaging the final positions attained in four to eight microstimulation trials. The measure of alignment between the resultant and experimental vectors was obtained from their dot product, as discussed above. We used these data to test whether the experimental vector was more closely aligned to the resultant vector in pawfixed or chest-fixed coordinates.
Results Altogether, 98 observations were made on 20 different pairs of cortical points in seven cats. The repertoire of forelimb move-
5576 • J. Neurosci., May 17, 2006 • 26(20):5574 –5581
Ethier et al. • Linear Summation of Motor Cortex Outputs
Figure 3. Distribution of paired points on a surface outline of the cat motor cortex. The motor cortex is bounded laterally by the coronal sulcus (Co.S.). The dashed lines indicate the location of the coronal gyrus. Paired cortical points are identified by a number. Microstimulation pairings are identified by filled circles, and pairings of microstimulation at one point with iontophoresis at another are identified by the ⫻ symbol.
Figure 2. Examples of paw trajectories evoked by ICMS. The trajectories evoked by each stimulus condition are shown in sagittal and horizontal plane (i.e., as seen from the side and above the animal, respectively). Each dot represents the position of the paw at intervals of 33.3 ms. The blue and green traces show the movement evoked by the stimulation of a cortical point on its own, and the red trace is the result of their simultaneous stimulation. The black traces represent the point-by-point addition of the blue and green traces. Res, Resultant trajectory; Pt, point; Ant, anterior; Lat; lateral; Med, medial; Post, posterior.
ments evoked by long-duration intracortical microstimulation (ICMS) included retraction, protraction, abduction, and supination. The evoked movements reflected the animal’s behavioral repertoire, often resembling prey-catching movements, as for example the forward and upward paw movements shown in Figure 2. The movement involved simultaneous extension of the wrist and flexion of the elbow and shoulder. Other typical movements involved extension at the shoulder with flexion of the elbow, leading to retraction of the paw. Shoulder and elbow extension with supination of the forearm was also a commonly evoked movement. In all movements, the motions at the involved joints began and ended almost simultaneously as determined from qualitative video analysis. However, under the conditions of this experiment, the repertoire of evoked movements was more restricted than that observed by Graziano et al. (2002) in alert macaques, in part reflecting the more limited forelimb movement repertoire of cats. The evoked movements proved to be repeatable from trial to trial. On repeated trials with the same stimulation parameters, the average coefficient of variation of movement magnitude was 0.12, and the average ⫾ SD angular difference in direction was 4.5 ⫾ 3.1°. The responses remained nearly constant over the time required to characterize the cortical points individually and stimulate them simultaneously, typically ⬃20 min.
Simultaneous stimulation evokes a blend of the individual movements At the outset of the experiments, we observed that the movement evoked by simultaneous stimulation of two cortical points was clearly a blend of the individually evoked movements. The main characteristics of each movement (e.g., protraction, elbow flexion, abduction, etc.) were preserved during simultaneous stimulation and combined to produce a new movement. For example, when stimulation of a cortical point elicited elbow flexion and another supination of the paw, coactivation of these points evoked elbow flexion and paw supination. Our visual observation of movement combination was confirmed by measurements of the paw trajectories in space. Two examples of paw trajectories are shown in Figure 2. In Figure 2 A, the individually evoked movements were in opposite direction in the sagittal plane; in Figure 2 B, they were in the same direction. In each case, the paw path during combined stimulation was predictable from the individual paths. For example, in Figure 2 A, activation of point 1 evoked mainly an elbow flexion that caused the paw to move forward and up. Stimulation of the second point evoked a response dominated by shoulder retraction. Simultaneous activation of the two cortical points elicited a combined contraction of the elbow flexor and shoulder retractor muscles. The paw followed a path that was close to that predicted by averaging the individual movement paths. Thus, a new movement was generated that comprised the characteristics of the movements evoked by stimulating each point on its own. This phenomenon was consistently observed for all tested pairs of motor cortical points. The distances between pairs of electrically stimulated points ranged between 0.66 and 5.7 mm, with a mean ⫾ SD distance of 2.65 ⫾ 1.52 mm. The distribution of these points on a surface outline of the cat motor cortex is shown in Figure 3. Evoked EMG activities sum nearly linearly The main feature of the evoked EMG activity in a given muscle was a phasic increase of activity followed by tonic activity that lasted for the duration of the stimulation (Fig. 4). In ⬃8% of
Ethier et al. • Linear Summation of Motor Cortex Outputs
J. Neurosci., May 17, 2006 • 26(20):5574 –5581 • 5577
stimulation resulted in an EMG output (93 mV/ms) that was close to the sum of the two. Similarly, when only one of the two points evokes activity in a given muscle, combined stimulation resulted in EMG similar to that elicited from the effective point alone. This is the case for the LD in Figure 4. Almost no response was evoked from point 1, whereas point 2 evoked a response of 44 mV/ms. When the two points were stimulated together, the response was 49 mV/ms. We also found that, to a reasonable approximation, linear summation also holds when excitatory and inhibitory EMG responses are combined. For example, as shown in Figure 4, the ECR muscle was excited by stimulation at point 1 but inhibited by stimulation at Figure 4. Examples of evoked EMG activity. Left, Middle, EMG activity evoked by separate stimulation of two different points point 2. The response to simultaneous (Point 1, Point 2). Right, EMG activity evoked by simultaneous stimulation of the two points (Points 1⫹2). Additional details are stimulation is between the two individual given in Results. responses. When the background level of activity before the inhibitory response was subtracted from the excitatory response, the individual excitatory and inhibitory responses summed nearly linearly. A response of 20 mV/ms was evoked by stimulation of point 1, whereas point 2 reduced the background level of activity by 36 mV/ms. Combined stimulation of the two points reduced the background activity by 15 mV/ms. We determined the correlation of the resultant musclecoordination-pattern vector, obtained by summing responses evoked by stimulation of two cortical points separately, to the vector obtained by simultaneous stimulation of the two cortical points. The average ⫾ SD correlation between predicted and experimental vectors was 0.95 ⫾ 0.05, calculated over 78 paired muscle-coordination-pattern vectors. These high correlation coefficients show that EMG vectors obtained by simultaneous stimulation of two points are predictable from the vectors obtained by separate stimulation of the points but do not provide information on response magnitude. How muscle-coordination-pattern vectors obtained separately are related in magnitude to the vector obtained by simultaneous stimulation is shown in Figure 5. Each of the eight axes in these polar plots (Brochier et al., 2004) indicates the magnitude of the integrated EMG activity evoked in a given muscle. The shape of the figure produced by joining the tips of the vectors with line segments represents the musclecoordination pattern geometrically. Three examples of muscle coordination patterns are shown in Figure 5. Whether the sepaFigure 5. Polar plots of evoked EMG activity and their summation. Each axis represents the rate coordination patterns were different as in Figure 5, A and B, integrated EMG activity of a given muscle. Line segments join the points plotted on each axis, or very similar as in C, combined stimulation produced a coorthus giving a geometrical representation of the evoked muscle-coordination pattern. Graphs in the first two columns represent the muscle-coordination pattern evoked by separate stimuladination pattern that was close to the sum of the individual cotion of two cortical points. Graphs in the third column represent the muscle-coordination patordination patterns. tern obtained when the two points were simultaneously stimulated (Points 1 and 2, red line) Linear summation of separate EMG responses implies that the and the sum expected by addition of the two separate patterns (black dashed lines). Note that relationship between the sum of the separate responses and the the expected and experimentally obtained muscle-coordination patterns are nearly the same. experimentally obtained responses have unit slope. The slope of the regression line relating these two variables was 0.92, and the cases, ICMS produced inhibition of background EMG activity, as y-intercept was ⫺1.86 mV/ms (Fig. 6 A). The analysis is based on can be seen for the ECR muscle in response to stimulation of 343 observations obtained from five animals. The near-unit slope point 2. When two cortical points were simultaneously stimuand near-0 y-intercept show that, under the conditions of this lated, the EMG activity in each muscle was very nearly the sum of experiment, EMG activity evoked by simultaneous stimulation of the individual EMG activities. This was true for the three possible two cortical points is nearly equal to the sum of the individual combinations of individual responses. For example, as shown in responses obtained separately. An analysis of covariance Figure 4, the SpD muscle was activated by each of the two cortical (ANCOVA) shows that the slope of the fitted regression line is points (26 and 60 mV/ms, respectively), and their combined only marginally smaller than 1. The best-fitting regression line
5578 • J. Neurosci., May 17, 2006 • 26(20):5574 –5581
Ethier et al. • Linear Summation of Motor Cortex Outputs
Figure 6. Predicted versus experimentally observed EMG activity of single muscles. A, Scatter plot of predicted versus experimentally obtained integrated EMG responses. Each point represents a single muscle, and data points for different animals are plotted in a different color as shown in the graph legend. The line of unit slope is shown in black. The correlation between predicted and experimental data values in A was r ⫽ 0.86. B, The graph shows that when one of the two cortical points was disinhibited by bicuculline (Bic) or gabazine (Gaz), and the other microstimulated, the combined output was not more than the sum of the separate outputs. The correlation between predicted and experimental data values in B was r ⫽ 0.94.
accounted for 75% of the variance (i.e., R 2 ⫽ 0.75), whereas forcing a line of unit slope accounts for 74% of the variance (i.e., R 2 ⫽ 0.74). Direction of the paw motion can be predicted by vector addition Displacement vectors of microstimulation-evoked movements were determined for each of two cortical points activated on their own and simultaneously. The resultant vector was calculated from the vectors obtained by stimulation of the two cortical points separately and compared with that obtained when the two points were simultaneously stimulated (Fig. 7). For the displacement vectors, the mean ⫾ SD r value for the 69 observations was 0.93 ⫾ 0.08. This corresponds to an average angular separation of 21.6° between the experimentally obtained displacement vectors and the theoretical resultants. The angular separation of the displacement vectors resulting from stimulation of each of the two cortical points on their own was on average 60°, demonstrating that, when the two points were simultaneously activated, the displacement vector converged toward the direction of the theoretical resultant (Fig. 7 A, B). As shown in Table 1, the r value was related to the expected magnitude of the resultant. Predicted and actual displacement vectors were better aligned for larger displacements. This can be explained by the geometrical fact that, for small vectors, a small difference of their tip positions results in a relatively large difference in direction (i.e., angle is proportional to arc length/radius). However, most of our data were obtained when the expected sum of responses would lead to a displacement of 6 cm or more, thus reducing this effect considerably. Overall, the direction of the evoked movement is reasonably predicted by addition of the individual displacement vectors. In addition to direction, we determined how accurately addition of the individual displacement vectors predicts the magnitude of the resultant movement. There is a clear relationship between the magnitude of the movement evoked by the double stimulation and that predicted from activation of the two points separately (Fig. 8), but the experimental displacement magnitudes are lower than expected, particularly for large movements. For most of the data in the low to mid range, the linear model holds and provides an accurate prediction of the movement magnitude. When a linear regression line is fitted to the data points between 3 and 11 cm, an F test shows that the best-fitting slope of
Figure 7. Examples of displacement vectors. Individual displacement (A, B) obtained by stimulation of cortical points on their own are shown in green and blue. The resultant vectors (Dជres) were determined from the individual vectors by the rules of linear algebra and are shown in black. The vectors obtained by stimulation of two points simultaneously are shown in red (i.e., the experimentally obtained vectors). In C, we show a two-dimensional sagittal projection of the three-dimensional displacement vectors obtained by varying the stimulus intensities at two cortical points. The stimulus current (in microamperes) applied simultaneously at each cortical point is shown in the boxes. Except for the combination I1 ⫽ 40 A and I2 ⫽ 14 A, the direction of the movement is smoothly modulated as a function of the relative intensities of the two stimuli. The average ⫾ SD angular separation between the experimental vectors and the resultants (i.e., predicted) in C was 11 ⫾ 2.5°. Med-Lat, Mediolateral; Ant-Post, anteroposterior.
the line is not different from unity ( p ⫽ 0.085). However, a second-order polynomial gives a better fit over the whole range of displacement magnitudes (F ⫽ 26.09; p ⬍ 0.0001). Table 1 summarizes the accuracy of the magnitude predictions for different ranges. For predicted movement amplitudes of ⬎12 cm, the ratio of experimental to predicted amplitude was an average ⫾ SD of 0.71 ⫾ 0.1. Gradation of movement magnitude and direction As demonstrated by Robinson and Fuchs (1969), varying the current intensities at two points simultaneously stimulated in the frontal eye fields, or superior colliculus (Robinson, 1972), evoked graded amplitude and direction of the movements. We observed a similar phenomenon when stimulating the cat motor cortex (Fig. 7C). In this example, the two points evoked a movement separated by an angle of nearly 90° when stimulated on their own. When the current intensity was maintained constant at one point, although progressively increased at the other point, the resulting movement gradually shifted toward the direction evoked by the latter point. The average ⫾ SD angular separation between the experimental vectors and the resultant vectors in Figure 7C was 11 ⫾ 2.5°. We made similar observations in experiments on four pairs of points in three animals. Disinhibition of one of the cortical points does not lead to nonlinear interaction The linear addition of EMG outputs observed with electrical microstimulation implies no interaction between cortical points
Ethier et al. • Linear Summation of Motor Cortex Outputs
J. Neurosci., May 17, 2006 • 26(20):5574 –5581 • 5579
SD distance of 3.4 ⫾ 0.92 mm. The distribution of these points on a surface outline of the cat motor cortex is shown in Figure 3. A few minutes after ejection of either Dexp / Dres ⫾ SD n Dexp 䡠 Dres ⫾ SD antagonist, recurrent spontaneous bursts All data ( Dres range in cm) 69 0.9300 ⫾ 0.0825 0.81 ⫾ 0.19 of synchronized neural activity are gener3 ⬍ Dres ⬍ 6 5 0.8002 ⫾ 0.1273 1.01 ⫾ 0.29 ated. These bursts of activity evoked EMG 6 ⬍ Dres ⬍ 9 14 0.9212 ⫾ 0.0859 0.97 ⫾ 0.13 output and movement. Interestingly, the 6 ⬍ Dres ⬍ 12 13 0.9417 ⫾ 0.0824 0.85 ⫾ 0.20 muscle-coordination pattern and move37 0.9467 ⫾ 0.0585 0.71 ⫾ 0.10 12 ⬍ Dres ments evoked by the spontaneous neural The alignment, or correlation, between the predicted (Dres) and experimentally (D1⫹2) obtained displacement vectors is highest for movements of 6 cm or more. The ratio of vector magnitudes decreases for movements greater than bursts were similar to those evoked by mi12 cm, likely because of rotation limits at one or more joints. crostimulation of the same point, as was also observed for defensive responses mediated from the motor cortex (Cooke et al., 2004). Eight EMG response patterns and movements evoked by the neural bursts were averaged. A cortical point whose output had been characterized previously was then microstimulated, whereas the disinhibited point was spontaneously active. Because the neural bursts were nearly periodic, we could reasonably estimate the time of stimulation to coincide with the onset of a spontaneous burst. It was thus possible to determine the combined output of two cortical points, one of which was disinhibited. In this condition as well the combined, output was nearly the sum of the two separate outputs. In the example shown in Figure 9, point 1 was microstimulated at 20 A, and point 2 was disinhibited by iontophoretic ejection of bicuculline. It can be seen that the combined output, shown as muscle coordination patterns, was nearly the sum of the two separate muscle coordination patterns (Fig. 9). In other words, disinhibition of one of the cortical points did not result in a more than linear interaction with the other. The scatter Figure 8. Magnitude of displacement vectors. Relationship between the magnitude of explot shown in Figure 6 B summarizes the results of these experiperimentally obtained displacement vectors (Dexp ) and its value predicted by vector addition ments. When one of the points was disinhibited by bicuculline, (Dpred ). The black line has unit slope. The gray line is the best-fitting second-order polynomial the slope of the line relating these two variables was 0.86 and 0.93 2 2 ( y ⫽ 0.99 ⫻ x ⫺ 0.016 ⫻ x ) and accounts for 70% of the data variance (i.e., R ⫽ 0.7). when a point was disinhibited by gabazine. These two values were Additional details are given in Results. not significantly different from each other (ANCOVA, F ⫽ 1.07; p ⬎ 0.35), and a single line was fitted to the two sets of data points in Figure 6 B. Table 1. Correlation coefficients and magnitude ratio between experimental and calculated displacement vectors Displacement vectors
Discussion
Figure 9. Summation of EMG activity after disinhibition. A, Microstimulation of point 1 evoked the muscle-coordination pattern shown. B, Within a few minutes of iontophoretic ejection of bicuculline at point 2, spontaneous bursts of intracortical neuronal activity were generated and evoked the shown muscle-coordination pattern. C, Microstimulation of point 1, timed to coincide with a spontaneous burst at point 2, evoked the muscle-coordination pattern shown in red (Points 1 and 2). The dashed black geometric figure in C represents the expected sum of the muscle-coordination patterns shown in A and B. The distance between the points was 3.14 mm.
and summation of their outputs at the ␣-motoneuron pool. Local inhibitory neurons are thought to restrict the interaction between cortical points (Schneider et al., 2002). To determine whether this was the reason underlying the linear summation of responses, cortical points were locally disinhibited by iontophoretic ejection of the GABAA receptor antagonists bicuculline or gabazine. Twenty observations were made on five pairs of points in two animals. The distances between pairs of points tested in this way was between 2.65 and 4.62 mm, with a mean ⫾
The additive nature of motor cortex outputs In this study, we demonstrated that the EMG outputs evoked by simultaneous stimulation of two cortical points are additive and result in a new movement that is a blend of the movements elicited by stimulation of each point on its own. We have shown that this blending of movements can be described in a simple manner by the rules of vector algebra. A surprising result was that, when inhibition at one of the cortical point is reduced pharmacologically, the combined output is not supralinear. In considering the reasons underlying these results and their functional significance, it is important to note that our experiments have dealt with the corticospinal system taken as a whole. This includes the cortical circuitry and the connections made by corticospinal neurons with spinal interneurons. Our results show that the net effect is a nearly linear summation of the separate corticospinal outputs. The fact that the slope relating predicted EMG output and the experimentally observed output was slightly lower than the unit value expected for perfect summation indicates that a slight occlusion of effects may have occurred, possibly in the spinal cord. The corticospinal axons activated by microstimulation of each cortical point probably converge in part on common spinal interneurons, a portion of which may discharge at their maximum rate in response to activation of either cortical point. We were careful to use submaximal intensities at each point during paired
5580 • J. Neurosci., May 17, 2006 • 26(20):5574 –5581
stimulation. Nonetheless, convergence of corticospinal axons on common spinal interneurons may not be avoidable. This does not detract from the value of our results, because such an effect would occur during natural activity. What our results show is that motor cortical outputs sum at the spinal cord, and occlusion would lead to a less than linear summation. The fact that, during twin stimulation, whatever interaction occurred in the motor cortex did not lead to nonlinear effects may be puzzling. Motor cortical points are known to be interconnected by intrinsic long-range axonal collaterals (Huntley and Jones, 1991; Keller, 1993; Capaday et al., 1998), and neural activity spreads over the range of these connections (Baker et al., 1998; Capaday, 2004). The observation is even more puzzling given the lack of effect of reducing inhibition at a cortical point, a condition in which it should have received the full brunt of inputs from the ICMS-activated cortical point. Baker et al. (1998) suggested that the lack of EMG facilitation that they observed with single ICMS pulses delivered to two cortical points 1.5–2 mm apart was attributable to exact cancellation of facilitation within the subliminal fringe surrounding each point and occlusion of effects between the two points. Their proposal is inconsistent with the present results. We have not observed supralinear interactions with submaximal stimulus intensities, submaximal stimulus rates (e.g., 100 Hz), or when reducing inhibition at a cortical point and thereby presumably increasing the size of the subliminal fringe. Furthermore, the distance between the cortical points we studied, up to 5.5 mm, was much larger than in the study of Baker et al. (1998), leaving considerable cortical tissue available for neural interactions. Based on the chart developed by Ranck (1975), we estimate that current spread over a radius of ⬃500 m from the tip of each microelectrode. As a final note on this issue, it should be noted that the effects of trains of ICMS cannot be readily predicted from responses to single pulses. Repetitive stimuli can induce complex phenomena, including EPSP facilitation, synaptic depression, and enhanced spatial spread of activity along the axonal arbors. There is a large body of evidence demonstrating that the recurrent effects of pyramidal tract axons involve a mixture of excitation and inhibition (Phillips and Porter, 1977; Asanuma and Ward, 1981; Rothwell, 1994). We suggest that the interaction between cortical points involves a balance between excitation and inhibition such that the interaction results in near-linear summation of outputs. Detailed analyses of the effects of balancing excitation and inhibition on the firing properties of neurons have been done previously (Capaday, 2002; Chance et al., 2002; Ulrich, 2003; Brizzi et al., 2004; Meunier and Borejsza, 2005; Capaday and Van Vreeswijk, 2006). When a cortical point is disinhibited, the activation threshold of the in situ neurons is reduced and their firing rate increased in response to, for example, corticocortical inputs evoked by ICMS of a nearby point. We suggest that the balance of excitation and inhibition remains in this condition (Shadlen and Newsome, 1994; Chance et al., 2002), and this ensures linear interactions independent of firing rate. Indeed, linearity of interactions in motor cortex may hold down to the single neuron level. For example, Gribble and Scott (2002) have shown that the discharge of some neurons during movements made against viscous loads at the shoulder and elbow was linearly predictable from application of the loads separately to each joint. Comparison of outputs produced by intracortical versus intraspinal microstimulation We suggest that our observations reflect a basic property of the corticospinal system taken as a whole. At the cortical level, as
Ethier et al. • Linear Summation of Motor Cortex Outputs
discussed, the circuitry may be wired so as to ensure linear interaction at the spinal level. This may be a basis for simplifying the coding of motor cortical outputs. The results of a recent study by Aoyagi et al. (2004), using intraspinal microstimulation support this idea. They found that simultaneous stimulation of sites within the intermediate quadrants of the spinal cord resulted in nonlinear summation of outputs and concluded that the spinal circuitry does not automatically compensate for nonlinearities inherent in the musculoskeletal system. Furthermore, Aoyagi et al. (2004) and Mushahwar et al. (2004) did not always obtain convergence of displacement vectors during combined stimulation of spinal sites. In our study, displacement vectors always converged toward the direction of the expected resultant vector. Here we used conditions in which the full expression of neural, muscular, and biomechanical nonlinearities occurred. The evoked limb movements were made against gravity, as would natural movements. Additionally, activation of reflex pathways in the spinal cord likely contributed to the net motor output because, in the ketamine-anesthetized animals, stretch reflexes, flexion reflexes, and reciprocal inhibition between antagonistic muscles are manifest (Capaday et al., 1998; Schneider et al., 2001, 2002). However, in this preparation, there is no discernible effect of proprioceptive inputs on motor cortex neurons and little if any from cutaneous inputs (Capaday and Rasmusson, 2003). Thus, we characterized how separate and controlled corticospinal inputs to the spinal cord interact to produce the motor output. Relevance to the population vector hypothesis Our results provide a neurophysiological basis for, but do not corroborate, the population vector hypothesis of movement direction coding (Georgopoulos et al., 1983, 1986, 1988). Our results show that the linear summation of movement-related neural activities is a valid assumption and importantly that the transformations of motor cortex inputs to the spinal cord leading to motor output remain linear. However, our observations are also consistent with those of Scott et al. (2001). These authors concluded that the population vector does not point in the direction of hand motion but rather is related to the joint mechanical power in different directions of movement, a measure related to muscle activation. The linear addition of muscle activations when two cortical points are stimulated is consistent with this view. The observed linear summation of motor cortex outputs as paw displacement vectors is also relevant to and consistent with theories of movement control that postulate planning of reaches to acquire visual targets as a vector from the initial hand position to the target (Messier and Kalaska, 1997; Vindras and Viviani, 1998; Wang and Sainburg, 2005). Paw motions produced by stimulating two cortical points interact to cause a movement that can be represented as a vectorial sum of movements produced at individual cortical points within a hand-fixed coordinate system. Importantly, the work in humans and subhuman primates underlying these vector theories has focused on movements to visual external targets, whereas our investigation used stimulation of cortical sites to elicit movements. Thus, the present work suggests that movement commands may activate multiple points in motor cortex that will simply sum their outputs to upper limb motoneurons and produce paw/hand movements in particular directions. In summary, we demonstrated that separate corticospinal outputs sum linearly and lead to blending of the movements evoked by the activated cortical points. This suggests that not all movements need be represented in the motor cortex but may be synthesized from a smaller repertoire. We suggest that corticocortical and corticospinal interactions ensure a near-linear out-
Ethier et al. • Linear Summation of Motor Cortex Outputs
put, an operational principle that may simplify the synthesis of motor commands.
References Amassian VE, Cracco RQ, Maccabee PJ, Cracco JB, Henry K (1995) Some positive effects of transcranial magnetic stimulation. Adv Neurol 67:79 –106. Aoyagi Y, Stein RB, Mushahwar VK, Prochazka A (2004) The role of neuromuscular properties in determining the end-point of a movement. IEEE Trans Neural Syst Rehabil Eng 12:12–23. Asanuma H, Ward JE (1981) The pyramidal tract. In: Handbook of physiology, Sec 1, Vol 2, Pt 2 (Brooks VB, ed), pp 703–733. Baltimore: Williams and Wilkins. Baker SN, Olivier E, Lemon RN (1998) An investigation of the intrinsic circuitry of the motor cortex of the monkey using intra-cortical microstimulation. Exp Brain Res 123:397– 411. Brizzi L, Meunier C, Zytnicki D, Donnet M, Hansel D, D’Incamps BL, Van Vreeswijk C (2004) How shunting inhibition affects the discharge of lumbar motoneurones: a dynamic clamp study in anaesthetized cats. J Physiol (Lond) 558:671– 683. Brochier T, Spinks RL, Umilta MA, Lemon RN (2004) Patterns of muscle activity underlying object-specific grasp by the macaque monkey. J Neurophysiol 92:1770 –1782. Capaday C (2002) A re-examination of the possibility of controlling the firing rate gain of neurons by balancing excitatory and inhibitory conductances. Exp Brain Res 143:67–77. Capaday C (2004) The integrated nature of motor cortical function. The Neuroscientist 10:207–220. Capaday C, Rasmusson DD (2003) Expansion of receptive fields in motor cortex by local blockade of GABAA receptors. Exp Brain Res 153:118 –122. Capaday C, Van Vreeswijk C (2006) Direct control of firing rate gain by dendritic shunting inhibition. J Integrative Neurosci, in press. Capaday C, Devanne H, Bertrand L, Lavoie BA (1998) Intracortical connections between motor cortical zones controlling antagonistic muscles in the cat: a combined anatomical and physiological study. Exp Brain Res 120:223–232. Chance FS, Abbott LF, Reyes AD (2002) Gain modulation from background synaptic input. Neuron 35:773–782. Devanne H, Cohen LG, Kouchtir-Devanne N, Capaday C (2002) Integrated motor cortical control of task related muscles during pointing in humans. J Neurophysiol 87:3006 –3017. Ethier C, Imbeault M, Ung RV, Darling WG, Capaday C (2004) Vector addition of motor cortical outputs in the cat. Soc Neurosci Abstr 30:872.14. Georgopoulos AP, Caminiti R, Kalaska JF, Massey JT (1983) Spatial coding of movement: a hypothesis concerning the coding of movement direction by motor cortical populations. Exp Brain Res Suppl 7:327–336. Georgopoulos AP, Schwartz AB, Kettner RE (1986) Neuronal population coding of movement direction. Science 233:1416 –1419. Georgopoulos AP, Kettner RE, Schwartz AB (1988) Primate motor cortex and free arm movements to visual targets in three-dimensional space. II. Coding of the direction of movement by a neuronal population. J Neurosci 8:2928 –2937. Graziano MS, Taylor CS, Moore T (2002) Complex movements evoked by microstimulation of precentral cortex. Neuron 34:841– 851. Gribble PL, Scott SH (2002) Overlap of internal models in motor cortex for mechanical loads during reaching. Nature 417:938 –941. Huntley GW, Jones EG (1991) Relationship of intrinsic connections to fore-
J. Neurosci., May 17, 2006 • 26(20):5574 –5581 • 5581 limb movement representations in monkey motor cortex: a correlative anatomic and physiological study. J Neurophysiol 66:390 – 413. Jacobs KM, Donoghue JP (1991) Reshaping the cortical motor map by unmasking latent intracortical connections. Science 251:944 –947. Keller A (1993) Intrinsic connections between representation zones in the cat motor cortex. NeuroReport 4:515–518. Messier J, Kalaska JF (1997) Differential effect of task conditions on errors of direction and extent of reaching movements. Exp Brain Res 115:469 – 478. Meunier C, Borejsza K (2005) How membrane properties shape the discharge of motoneurons: a detailed analytical study. Neural Comput 17:2383–2420. Mushahwar VK, Aoyagi Y, Stein RB, Prochazka A (2004) Movements generated by intraspinal microstimulation in the intermediate gray matter of the anesthetized, decerebrate, and spinal cat. Can J Physiol Pharmacol 82:702–714. Phillips CG, Porter R (1977) Corticospinal neurones. Their role in movement. London: Academic. Ranck JBJ (1975) Which elements are excited in electrical stimulation of mammalian central nervous system: a review. Brain Res 98:417– 440. Robinson DA (1972) Eye movements evoked by collicular stimulation in the alert monkey. Vision Res 12:1795–1808. Robinson DA, Fuchs AF (1969) Eye movements evoked by stimulation of frontal eye fields. J Neurophysiol 32:637– 648. Rothwell J (1994) Control of human voluntary movement, Ed 2. London: Chapman and Hall. Sanes JN, Donoghue JP, Thangaraj V, Edelman RR, Warach S (1995) Shared neural substrates controlling hand movements in human motor cortex. Science 268:1775–1777. Schieber MH, Hibbard LS (1993) How somatotopic is the motor cortex hand area? Science 261:489 – 492. Schneider C, Zytnicki D, Capaday C (2001) Quantitative evidence for multiple widespread representations of individual muscles in the cat motor cortex. Neurosci Lett 310:183–187. Schneider C, Devanne H, Lavoie BA, Capaday C (2002) Neural mechanisms involved in the functional linking of motor cortical points. Exp Brain Res 146:86 –94. Scott SH, Gribble PL, Graham KM, Cabel DW (2001) Dissociation between hand motion and population vectors from neural activity in motor cortex. Nature 413:161–165. Seutin V, Johnson SW (1999) Recent advances in the pharmacology of quaternary salts of bicuculline. Trends Pharmacol Sci 20:268 –270. Shadlen MN, Newsome WT (1994) Noise, neural codes and cortical organization. Curr Opin Neurobiol 4:569 –579. Tokuno H, Tanji J (1993) Input organization of distal and proximal forelimb areas in the monkey primary motor cortex: a retrograde double labeling study. J Comp Neurol 333:199 –209. Ulrich D (2003) Differential arithmetic of shunting inhibition for voltage and spike rate in neocortical pyramidal cells. Eur J Neurosci 18:2159 –2165. Valero-Cuevas FJ (2000) Predictive modulation of muscle coordination pattern magnitude scales fingertip force magnitude over the voluntary range. J Neurophysiol 83:1469 –1479. Vindras P, Viviani P (1998) Frames of reference and control parameters in visuomanual pointing. J Exp Psychol Hum Percept Perform 24:569 –591. Wang J, Sainburg RL (2005) Adaptation to visuomotor rotations remaps movement vectors, not final positions. J Neurosci 25:4024 – 4030.