Oct 9, 2017 - entire rows or columns are missing from a constituent data matrix. .... 9. Update ËU and ËV to incorporate the new Sx. The algorithm will improve ...
Linked Matrix Factorization Michael J. O’Connell and Eric F. Lock
arXiv:1710.02931v1 [stat.ME] 9 Oct 2017
Division of Biostatistics, University of Minnesota Minneapolis, MN 55455, U.S.A Abstract In recent years, a number of methods have been developed for the dimension reduction and decomposition of multiple linked high-content data matrices. Typically these methods assume that just one dimension, rows or columns, is shared among the data sources. This shared dimension may represent common features that are measured for different sample sets (i.e., horizontal integration) or a common set of samples with measurements for different feature sets (i.e., vertical integration). In this article we introduce an approach for simultaneous horizontal and vertical integration, termed Linked Matrix Factorization (LMF), for the more general situation where some matrices share rows (e.g., features) and some share columns (e.g., samples). Our motivating application is a cytotoxicity study with accompanying genomic and molecular chemical attribute data. In this data set, the toxicity matrix (cell lines × chemicals) shares its sample set with a genotype matrix (cell lines × SNPs), and shares its feature set with a chemical molecular attribute matrix (chemicals × attributes). LMF gives a unified low-rank factorization of these three matrices, which allows for the decomposition of systematic variation that is shared among the three matrices and systematic variation that is specific to each matrix. This may be used for efficient dimension reduction, exploratory visualization, and the imputation of missing data even when entire rows or columns are missing from a constituent data matrix. We present theoretical results concerning the uniqueness, identifiability, and minimal parametrization of LMF, and evaluate it with extensive simulation studies.
1
Introduction
Recent technological advances in biomedical research have led to a growing number of platforms for collecting large amounts of health data. Molecular profiling modalities such as genetic sequencing and gene expression microarrays, and imaging modalities such as MRI scans, yield high-dimensional data with complex structure. Methods that simplify such data by identifying latent patterns that explain most of the variability are very useful for exploratory visualization of systematic variation, dimension reduction, missing data imputation, and other tasks. For a single data matrix X : m × n, this simplification can be accomplished via a principal components analysis (PCA) or via other approaches to low-rank matrix factorization (for an overview see Wall et al. (2003)). For example, X may represent a microarray with expression measurements for m genes for n biological samples. It is also increasingly common to have multiple linked high-dimensional data matrices for a single study, e.g., X1 : m1 × n, X2 : m2 × n, . . . , Xk : mk × n
(1)
with n shared columns. In the multi-source context (1) X1 may represent expression for m1 genes, X2 may represent the abundance of m2 proteins, and X3 may represent the abundance of m3 1
metabolites, for a common set of n biological samples. For multi-source data a straightforward ad-hoc approach is to perform a separate PCA of each matrix Xi (for example, see Zhao et al. (2014)). However, patterns of systematic variability may be shared between blocks; for example, it is reasonable to expect that some sample patterns that are present in gene expression data are also present in proteins. Thus, separate factorizations can be inefficient and underpowered to accurately recover these joint signals, and they also provide no insight into the connections between data matrices that are often of scientific interest. An alternative approach is to perform a single joint PCA analysis of the concatenated data X : (m1 + m2 + · · · + mk ) × n, and this approach as been referred to as consensus PCA (Wold et al., 1996; Westerhuis et al., 1998). However, a consensus PCA approach assumes that all systematic patterns are shared across data matrices, and lacks power to accurately recover signals that may exist in only one data matrix. The recent ubiquity of high-dimensional multi-source data has motivated more flexible methods for scenario (1). A guiding principle for several such methods is to simultaneously model features that are shared across multiple sources (i.e., joint and features that are specific to a particular source (i.e., individual ). Methods that follow this strategy have been developed that extend well-established exploratory techniques such as partial least squares (L¨ofstedt and Trygg, 2011), canonical correlation analysis (Zhou et al., 2015), non-parametric Bayesian modeling (Ray et al., 2014), non-negative factorization (Yang and Michailidis, 2016), and simultaneous components analysis (Schouteden et al., 2014). The Joint and Individual Variation Explained (JIVE) method (Lock et al., 2013; O’Connell and Lock, 2016) is a direct extension of PCA, distinguishing components that explain covariation (joint structure) between the data sources and principal components that explain variation that is individual to each data source. This distinction simplifies interpretation, and also improves accuracy to recover underlying signals because structured individual variation can interfere with finding important joint signal, just as joint structure can obscure important signal that is individual to a data source. Multi-source data integration (1) has been termed vertical integration (Tseng et al., 2015). Related dimension reduction and pattern recognition methods have also been developed specifically for the horizontal integration of a single data source measured for multiple sample groups (Kim et al., 2017; Huo et al., 2016): X1 : m × n1 , X2 : m × n2 , . . . , Xk : m × nk .
(2)
Other integrative approaches have been developed for a collection of matrices that share both dimensions: X1 : m × n, X2 : m × n, . . . , Xk : m × n.
(3)
Population value decomposition (PVD) (Crainiceanu et al., 2011) was designed for the analysis of aligned image populations and produces a joint low-rank factorization for scenario (3) with shared row and column components; similar techniques have also been developed in the computer science literature (Ding and Ye, 2005; Ye, 2005). Another approach for scenario(3) is to treat the data as a single multi-way array (i.e., tensor) X : m × n × k and apply well-established tensor factorizations such as the CANDECOMP/PARAFAC (Harshman, 1970) and Tucker (Tucker, 1966) factorization which extend PCA and related matrix dimension reduction methods to higherorder arrays. Neither PVD nor a tensor factorization approach distinguishes joint and individual structure among the constituent data matrices. The Linked Tucker2 Decomposition (Yokota and Cichocki, 2014) and Bayesian Multi-view tensor factorization (Khan and Kaski, 2014) methods do allow for the decomposition of joint and individual structure, under an extended scenario for (3) where the collection of m × n matrices can be grouped into sets of size di : X1 : m × n × d1 , X2 : m × n × d2 , . . . , Xk : m × n × dk . 2
(4)
Acar et al. (2011) describe a method for the joint factorization of a matrix and a tensor, but their approach does not allow for the decomposition of joint and individual structure. In this article we address the simultaneous low-rank factorization and decomposition of joint and individual structure for the novel context of linked data in which the shared dimensions (e.g., rows or columns) are not consistent across the constituent data matrices. Our motivating example is a large-scale cytotoxicity study (Abdo et al., 2015) that consists of three interlinked high-content data matrices: 1. X : m1 × n1 : A cytotoxicity matrix with a measure of cell death for n1 chemicals across a panel of m1 genetically distinct cell lines, 2. Y : m2 × n1 : A chemical attribute matrix with m2 molecular attributes measured for the n1 chemicals, and 3. Z : m1 × n2 : A genomic matrix with n2 single nucleotide polymorphisms (SNP) measured for each of the m1 cell lines. Note that X shares its row set with Z and its column set with Y , as illustrated in Figure 1. These data were made public as part of a DREAM challenge for open science (Eduati et al., 2015). We are particularly interested in investigating the interaction between chemical toxicity, genomics, and measurable chemical attributes, i.e., what systematic variability in X is shared by Y and Z? We introduce a method called Linked Matrix Factorization (LMF), that gives a unified and parsimonious low-rank factorization of these three data matrices. We also extend the framework of the JIVE method to allow for the decomposition of joint and individual structure in this context with LMF-JIVE. This extension requires new approaches to estimation and new theoretical results concerning the uniqueness, identifiability, and minimal parametrization of the decomposition. We illustrate how the results can facilitate the visual exploration of joint and individual systematic variation. We also describe how the factorization can be used in conjunction with an Expectation-Maximization (EM) algorithm (Dempster et al., 1977) for the principled imputation of missing values and complete analysis of multi-source data, even when entire rows or columns are missing from the constituent data matrices. In what follows we first describe a novel joint low-rank factorization of these data in Section 2, before describing the extension to joint and individual structure in Section 3. In Section 4 we discuss missing data imputation, and in Section 5 we discuss different approaches to select the joint and individual ranks (i.e., number of components) in the factorization. Sections 2, 3, 4, and 5 each include simulation studies, to assess each component of the proposed methodology. In Section 6 we describe the results of the cytotoxicity application, and in Section 7 we give some concluding remarks.
2 2.1
Joint Factorization Model
We will refer to the three matrices involved in the LMF as X, Y , and Z, where X shares its row space with Y and its column space with Z (Figure 1). Let the dimensions of X be m1 × n1 , the dimensions of Y be m2 × n1 , and the dimensions of Z be m1 × n2 . Our task is to leverage shared structure across X, Y , and Z in a simultaneous low-rank factorization. We define a joint rank r
3
Figure 1: The structure of data for which the LMF algorithm was designed to analyze. The X and Y matrices share a sample set and have a common row space. Similarly, the X and Z matrices share a feature set and have a common column space. approximation for the three data matrices as follows: X = U Sx V T + Ex Y = Uy Sy V T + Ey Z = U Sz VzT + Ez where • U is an m1 × r matrix representing the row structure shared between X and Z • V is an n1 × r matrix representing the column structure shared between X and Y • Uy is an m2 ×r matrix representing how the shared column structure is scaled and weighted over Y • Vz is an n2 × r matrix representing how the shared row structure is scaled and weighted over Z • Sx , Sy , and Sz are r × r scaling matrices for X, Y , and Z, respectively, and • Ex , Ey and Ez are error matrices in which the entries are independent and have mean 0. For the remainder of this article we will subsume the scaling matrices Sy and Sz into the Uy and Vz matrices, respectively, for a more efficient parameterization: Y ≈ Uy V T and Z ≈ U VZT . Then, for identifiability of the components it suffices to assume that the columns of U and V are orthonormal and Sx is diagonal (see Section 2.3). For notational convenience we also ˜ = [U Sx Uy ], V˜ = denote the following concatenated matrices that span shared dimensions : U T T T ˜ ˜ [V Sx Vz ], Y = [X Y ] , Z = [X Z]. 4
2.2
Estimation
To estimate the joint structure, we iteratively minimize the sum of squared residuals SSE = ||Ex ||2F + ||Ey ||2F + ||Ez ||2F , using an alternating least squares algorithm, where || · ||F defines the Frobenius norm. Given initial values, the algorithm proceeds by iteratively updating the components U , V , Uy , Vy , and Sx . In practice we first center and scale the three data sets, which prevents any of the matrices from having a disproportionately large influence on the joint components. Next, we initialize V˜ ˜ We initialize as the first r right singular vectors of the singular value decomposition (SVD) of Z. ˜ Sx as the identity matrix, so that V is the first n1 columns of V . We then repeatedly cycle through the following local least-squares minimization steps with other components held fixed: 1. Update Uy via ordinary least squares: Uy = (V T V )−1 V T Y 2. Update U via ordinary least squares: U = (V˜ T V˜ )−1 V˜ T Z˜ 3. Scale U by dividing each column by its Frobenius norm ˜: U ˜ = [U Sx Uy ] 4. Update U ˜ T Y˜ ˜ )−1 U ˜T U 5. Update V via ordinary least squares: V = (U 6. Update Vz via ordinary least squares: Vz = (U T U )−1 U T Z 7. Scale V by dividing each column by its Frobenius norm 8. Update Sx via least squares; define W : np × r such that the i’th column of W is the vectorization of the product of the ith columns of U and V , W [, i] = vec(U [, i]V [, i]T ), then the diagonal entries of Sx are (W T W )−1 W T vec(X) ˜ and V˜ to incorporate the new Sx . 9. Update U The algorithm will improve the SSE at each step until convergence, resulting in the following rank r estimates for the joint structure: J x = U Sx V T Jy = Uy V T Jz =
2.3
(5)
U VzT .
Diagonalizing Sx
Importantly, by constraining Sx to be a diagonal matrix we do not limit our solution space, as shown in Proposition 1. This simplifies the parameterization, facilities the identifiability of the components, and improves computation time by only estimating the diagonal elements of Sx . This property does not extend to other scenarios where constituent data matrices share both rows and columns (3), such as the PVD factorization (Crainiceanu et al., 2011). Proposition 1. Assume we have a decomposition in the form of Equation (5). Then the decomposition can be rewritten such that Sx is a diagonal matrix.
5
Proof. Let Sx∗ be a matrix of rank r. Suppose a set of matrices has the decomposition U ∗ Sx∗ V ∗T , Uy∗ V ∗T , and U ∗ Vz∗T . Then we can take a rank r SVD of Sx∗ . For this SVD, let P = the left singular vectors, Q = the right singular vectors, and Sx = the singular values. If we let U = U ∗ P and V = V ∗ Q, then, we can rewrite this matrix decomposition as U Sx V T , where Sx is a diagonal matrix because it represents the singular values of Sx∗ . Then we can set Uy = Uy∗ P and Vz = Vz∗ Q. This gives us a decomposition in the form of Equation 5 in which Sx is diagonal.
2.4
Simulation Study
We ran a simulation to test the ability of the LMF algorithm to recover the true underlying joint structure of the data. To generate the data, we simulated from the model, generating random matrices for the joint components. There were 100 simulated data sets. All elements of the joint structure components, U , Sx , V , Uy , and Vz , were simulated from a Normal(0, 1) distribution. Error matrices were simulated from a Normal(0, 1) distribution. The simulated data sets had 50 rows and 50 columns, and the rank of the joint structure was 2. The LMF algorithm was run with a convergence threshold of .00001 and a maximum 5000 iterations. We evaluated the performance of the LMF algorithm in these simulations by two criteria. First, we calculated the relative reconstruction error, which measures the algorithm’s ability to retrieve the true joint structure of the data. We scale the reconstruction residuals by the total structure to get the relative reconstruction error: Erec =
kJx − Jxtrue k2F + kJy − Jytrue k2F + kJz − Jztrue k2F kJxtrue k2F + kJytrue k2F + kJztrue k2F
where Jxtrue = U Sx V T , Jytrue = Uy V T , and Jztrue = U VzT . For the second criterion we consider the relative residual error, which measures the amount of variability in the data that is captured by the estimated joint structure: Eres =
kJx − Xk2F + kJy − Y k2F + kJz − Zk2F . kXk2F + kY k2F + kZk2F
Over the 100 simulations, the mean reconstruction error was 0.122 with a standard deviation of 0.042. The mean residual error was 0.588 with a standard deviation of 0.074. This relatively small value for the mean reconstruction error in contrast to the mean residual error suggests that the LMF algorithm does a good job of recovering the underlying joint structure even in the presence of random noise. We also ran a simulation with varying error variance to see how differences in error variance affect the accuracy of the decomposition. This simulation was similar to the above simulation, but instead of the error matrices being drawn from a normal(0,1) distribution, they were drawn i from a normal(0, σ 2 ) distribution, where σ 2 took on a value of 100 for the ith simulated data set, varying between 0.01 and 1. The relationship between error variance (σ 2 ) and reconstruction error is shown in Figure 2a, and the relationship between error variance and residual error is shown in Figure 2b. These results demonstrate that in the presence of minimal noise the data are exactly captured with the converged low rank approximation; with increasing noise both the reconstruction error and residual error increase linearly, but the reconstruction error remains small.
6
●
0.4
0.04
●
●●
●● ●
●
● ●
●
●
Residual Error
●
0.01
●
●
●●●● ●
●
●
0.0
0.2
●● ● ● ●●
● ●● ●
●
●
● ● ● ●
●
●●
● ●
●
●
● ● ●●●
●
●
●
●
●
●
●
●
0.8
● ●● ●
● ●
●
0.6
● ●
●
0.4
●
1.0
●● ● ● ● ● ●● ● ● ● ● ● ● ●●● ●● ●●●●
0.0
0.2
Error Variance
● ● ●● ● ● ●● ●● ●● ●
●● ● ● ●●
● ●● ●
● ● ● ●●
● ● ●
●
● ● ●
●● ● ●
●
●
●● ●
●
●●
●
●
●
0.0
● ● ●●● ●● ●● ● ● ● ● ●● ●● ●● ●● ●
●
● ● ● ●
●●●
● ● ●
●
●
● ●
0.1
●
●
0.00
● ●
●
●
●
●● ●
●
●
●
0.3
●
0.2
●
0.02
Reconstruction Error
0.03
●
●
●
●
●●
0.4
0.6
0.8
1.0
Error Variance
(a)
(b)
Figure 2: The relationship between the error variance of a data set and the reconstruction error (a) or residual error (b) in the LMF decomposition.
3
Joint and Individual Decomposition
3.1
Model
We extend the joint factorization approach of Section 2 to also allow for structured low rank variation that is individual to each data matrix, as follows: T X = U Sx V T + Uix Six Vix + Ex
Y = Uy Sy V T + Uiy Siy ViyT + Ey Z = U Sz VzT + Uiz Siz VizT + Ez where the individual components are given by • Uij for j = {x, y, z}, matrices representing the row structure unique to each matrix • Sij for j = {x, y, z}, matrices representing the scaling for the individual structure of each matrix, and • Vij for j = {x, y, z)}, matrices representing the column structure unique to each matrix. We define this joint and individual factorization as LMF-JIVE. In practice, we do not estimate the scaling matrices Six , Siy , and Siz , and instead allow them to be subsumed into the row and column structure matrices.
7
3.2
Estimation
To estimate the joint and individual structure, we extend the alternating least squares algorithm from Section 2.2. Define the low rank approximations for individual structure T Ax = Uix Six Vix
Ay = Uiy Siy ViyT
(6)
Az = Uiz Siz VizT . Let r be the rank of joint structure as defined in Section 2, and let rx , ry , and rz be the ranks of the individual structure Ax , Ay , and Az , respectively. The estimation algorithm proceeds by iteratively updating the components of {Jx , Jy , Jz } and {Ax , Ay , Az } to minimize the total sum of squared residuals until convergence. Thus, to estimate joint structure we define the partial residuals X J = X − Ax , Y J = Y − Ay , and Z J = Z − Az . We similarly define X I = X − Jx , Y I = Y − Jy , and Z I = Z − Jz . In practice we center and scale the three data sets, as for the joint LMF model. We also initialize V˜ , Sx , and Uy as in the joint LMF model (see Section 2.2). For LMF-JIVE, we must also initialize Ax , Ay , and Az to matrices of zeros. We then repeat the following steps until convergence (when the total sum of squares for the joint and individual estimates between the current iteration and the previous iteration is less than a chosen threshold) or until we reach the maximum number of iterations: 1. Set X J = X − Ax , Y J = Y − Ay , and Z J = Z − Az . 2. Define concatenations Y˜ = [(X J )T (Y J )T ]T and Z˜ = [X J Z J ]. 3. Update U via ordinary least squares: U = (V˜ T V˜ )−1 V˜ T Z˜ 4. Scale U by dividing each column by its Frobenius norm. ˜ = [U Sx Uy ] 5. Update U ˜T U ˜ )−1 U ˜ T Y˜ 6. Update V via ordinary least squares V = (U 7. Update Vz via ordinary least squares: Vz = (U T U )−1 U T Z J 8. Scale V by dividing each column by its Frobenius norm. 9. Update Uy via ordinary least squares: Uy = (V T V )−1 V T Y J 10. Update Sx via least squares; define W : np × r such that the i’th column of W is the vectorization of the product of the ith columns of U and V , W [, i] = vec(U [, i]V [, i]T ), then the diagonal entries of Sx are (W T W )−1 W T vec(X) ˜ and V˜ with the newly updated Sx . 11. Recalculate U 12. Set X I = X − Ax , Y I = Y − Ay , and Z I = Z − Az . 13. Update Ax via a rank rx SVD of X I , wherein Uix gives the right singular vectors, Vix gives the left singular vectors, and Six gives the singular values. 14. Update Ay via a rank ry SVD of Y I , and update Az via a rank rz SVD of Z I
8
After convergence, we suggest applying the following transformation to assure that the joint and individual structures are orthogonal for Y and Z: R Jy⊥ = Jy + Ay PJR , A⊥ y = Ay − Ay P J C Jz⊥ = Jz + PJC Az , A⊥ z = A z − PJ A z .
(7)
Here, PJC = U U T is the projection onto the column space of Jx , and PJR = V V T is the projection onto the row space of Jx . This transformation makes the joint and individual structures identifiable; this and other properties are investigated in Sections 3.3 and 3.4. The main scientific rationale for the orthogonalizing transformation is that any structure in the individual matrices that is in the column or row space of Jx should reasonably be considered joint structure. In the preceding algorithm we begin with the estimation of joint structure. We could alternatively estimate the individual structure first, by initializing Jx , Jy , and Jz to matrices of zeros and having steps 12 and 13 precede step 1 in the algorithm. We also consider this alternative approach in Section 3.4.
3.3 3.3.1
Theoretical Results Uniqueness
Below we show that the LMF-JIVE decomposition for the structure of matrix X is unique and identifiable. The proof rests on the defining assumption that shared row and column spaces are the same for joint structure, but different for individual structure. Theorem 1. Assume X = Jx + Ax , Y = Jy + Ay , and Z = Jz + Az where row(Jx ) = row(Jy ) , row(Ax ) ∩ row(Ay ) = {0} , row(Jx ) ∩ row(Ax ) = {0} and col(Jx ) = col(Jz ) , col(Ax ) ∩ col(Az ) = {0} , col(Jx ) ∩ col(Ax ) = {0}. If also X = Jx∗ + A∗x , Y = Jy∗ + A∗y , and Z = Jz∗ + A∗z where row(Jx∗ ) = row(Jy∗ ) , row(A∗x ) ∩ row(A∗y ) = {0} , row(Jx∗ ) ∩ row(A∗x ) = {0} and col(Jx∗ ) = col(Jz∗ ) , col(A∗x ) ∩ col(A∗z ) = {0} , col(Jx∗ ) ∩ col(A∗x ) = {0}, then Jx = Jx∗ and Ax = A∗x . Proof. We first show that Jx and Jx∗ have the same row and column spaces. By Theorem 1.1 in the supplement of Lock et al. (2013) there exists a unique orthogonal decomposition of X and Y: T
X = Jx⊥ + A⊥ x
Jx⊥ A⊥ = 0m1 ×m1 x
Y = Jy⊥ + A⊥ y
Jy⊥ A⊥ = 0m2 ×m2 y
T
such that row(Jx ) = row(Jx⊥ ) and row(Jx∗ ) = row(Jx⊥ ). Thus row(Jx ) = row(Jx⊥ ), and by a symmetric argument col(Jx ) = col(Jx∗ ). We next show that Ax and A∗x have the same row and column spaces, by showing that they have the same null spaces. Define the nullspace of Ax , N (Ax ) = {v ∈ Rn1 : Ax v = 0}, and take v ∈ N (Ax ). If v ∈ N (Jx ), then Xv = Jx v + Ax v = 0 + 0 = 0, 9
and v ∈ N (Jx∗ ) because row(Jx ) = row(Jx∗ ). So, v ∈ N (A∗x ) because 0 = Jx∗ v + A∗x v = A∗x v. If v ∈ / N (Jx ), then Xv = Jx v ∈ col(Jx ). So, because col(Jx ) = col(Jx∗ ),
Jx∗ v + A∗x v ∈ col(Jx∗ ).
Thus A∗x v = 0, because col(Jx ) ∩ col(Ax ) = {0}, and we again conclude v ∈ N (A∗x ). It follows T that N (Ax ) ⊆ N (A∗x ); symmetric arguments show N (A∗x ) ⊆ N (Ax ), N (ATx ) ⊆ N (A∗x ), and T T N (A∗x ) ⊆ N (ATx ). Thus N (Ax ) = N (A∗x ) and N (ATx ) = N (A∗x ), so row(Ax ) = row(A∗x ) and col(Ax ) = col(A∗x ). Define Jdiff = Jx − Jx∗ and Adiff = Ax − A∗x , and consider that Jdiff + Adiff = X − X = 0m1 ×n1 . Note that row(Jdiff ) ⊆ row(Jx ) because row(Jx ) = row(Jx∗ ), and row(Adiff ) ⊆ row(Ax ) because row(Ax ) = row(A∗x ), so row(Jdiff ) ∩ row(Adiff ) = {0}. For any v ∈ Rn1 , Jdiff v + Adiff v = 0, and therefore Jdiff v = 0 and Adiff v = 0. It follows that Jdiff = Adiff = 0m1 ×n1 , and thus Jx = Jx∗ and Ax = A∗x . By the inherent identifiability of the decomposition for X, it follows that the entire LMFJIVE decomposition is identifiable under the orthogonal transformations of structured variability in Y and Z in Equation (7). The proof is given in Corollary 1. Corollary 1. Assume {Jx , Ax , Jy , Ay , Jz , Az } and {Jx∗ , A∗x , Jy∗ , A∗y , Jz∗ , A∗z } satisfy the conditions of Theorem 1. Assume, in addition, that the joint and individual structures for Y and Z are orthogonal for both decompositions: T
T
Jy ATy = 0m2 ×m2 , JzT Az = 0n2 ×n2 , Jy∗ A∗y = 0m2 ×m2 , Jz∗ A∗z = 0n2 ×n2 . Then {Jx , Ax , Jy , Ay , Jz , Az } = {Jx∗ , A∗x , Jy∗ , A∗y , Jz∗ , A∗z }. Proof. By Theorem 1, Jx = Jx∗ and Ax = A∗x . Define PJR as the projection onto the row space of X. Then, Jy + Ay = Jy∗ + A∗y → (Jy + Ay )PJR = (Jy∗ + A∗y )PJR → Jy PJR + 0 = Jy∗ PJR + 0 → Jy = Jy∗ . Thus, Ay = A∗y , and an analogous argument shows that Jz = Jz∗ and Az = A∗z .
10
3.3.2
Orthogonality
In the classical JIVE algorithm for vertical integration, the joint and individual structures were restricted to be orthogonal for identifiability and a parsimonious decomposition. For LMF-JIVE we restrict the joint and individual structures for Y and Z to be orthogonal, and thus but not for X, which shares a joint row space and column space. As shown in Section 3.3.1, orthogonality between joint and individual structure in X, in either the row space or the column space, is not needed for identifiability of the decomposition. Thus, variation in Y and Z is parsimoniously decomposed into joint, individual and residual variability, e.g., ||Y ||2F = ||Jy ||2F +||Ay ||2F +||Ey ||2F ; however, this is not the case for X in general: ||X||2F < ||Jx ||2F + ||Ax ||2F + ||Ex ||2F . Interestingly, no such decomposition exists or post-hoc transformation of the converged result exists for X that would yield an orthogonal and parsimonious decomposition. We show this in Theorem 2 with a proof by contradiction. Theorem 2. Assume we have X = Jx + Ax , Y = Jy + Ay , and Z = Jz + Az where row(Jx ) = row(Jy ) col(Jx ) = col(Jz ) rank(Jx ) = rank(Jy ) = rank(Jz ) = r If we also have
Jx∗ ,
Jy∗ ,
Jz∗ ,
A∗x , A∗y , and A∗z such that row(Jx∗ ) = row(Jy∗ ) col(Jx∗ ) = col(Jz∗ )
rank(Jx∗ )
= rank(Jy∗ ) = rank(Jz∗ ) = r
and all of the joint and individual matrices are orthogonal: row(Jx∗ ) ⊥ row(A∗x ) col(Jx∗ ) ⊥ col(A∗x ) row(Jy∗ ) ⊥ row(A∗y ) col(Jz∗ ) ⊥ col(A∗z ) Then
Jx∗
+
A∗x
6= Jx + Ax = X.
Proof. We claim that there exist X = Jx∗ + A∗x , Y = Jy∗ + A∗y , and X = Jy∗ + A∗y that meet the following conditions: row(Jx∗ ) = row(Jy∗ ) col(Jx∗ ) = col(Jz∗ ) rank(Jx∗ ) = rank(Jy∗ ) = rank(Jz∗ ) = r We also claim that the joint and individual estimates J ∗ and A∗ are orthogonal: row(Jx∗ ) ⊥ row(A∗x ) col(Jx∗ ) ⊥ col(A∗x ) row(Jy∗ ) ⊥ row(A∗y ) col(Jz∗ ) ⊥ col(A∗z ) Using a result from Lock et al. (2013), the only estimate that satisfies row(Jx∗ ) = row(Jy∗ ) and row(Jx∗ ) ⊥ row(A∗x ) under these conditions is Jx∗ = Jx + Ax PJR , where PJR is the orthogonal projection onto the row space of Jx . Similarly, the conditions col(Jx∗ ) = col(Jz∗ ) and col(Jx∗ ) ⊥ col(A∗x ) imply that the estimate is Jx∗ = Jx + PJC Ax . However, this implies that Ax PJR = PJC Ax , which is not necessarily true in general. Therefore, such an estimate does not exist. 11
3.4
Simulation Study
Here we present a simulation study to test the ability of the LMF-JIVE algorithm to recover the true structure of the data. Our simulation design is analogous to that in Section 2.4, but allows for simulated data sets to have both joint and individual structure. There were 300 simulated data sets, with three different variability settings representing equal joint and individual variability, higher joint variability, and higher individual variability. For the first 100 simulations, all elements of the joint structure components, U , Sx , V , Uy , and Vz , and the individual structure components, Uix , Vix , Uiy , Viy , Uiz , and Viz , were simulated from a Normal(0, 1) distribution. For the next 100 simulations, the joint components were simulated from a Normal(0, 9) distribution, while the individual structure components were simulated from a Normal(0, 1) distribution. In the last 100 simulations, the joint components were simulated from a Normal(0, 1) distribution, and individual components were simulated from a Normal(0, 9) distribution. Error matrices were simulated from a Normal(0, 1) distribution. As with the previous simulation, the simulated data sets had 50 rows and 50 columns, and the rank of the joint structure was 2. The rank of the individual structure was also 2 for all three matrices. We chose rank 2 for all structures in the simulation for simplicity, but the algorithm is not limited to situations of equal rank and rank selection is explored in Section 5. For these simulations, we applied three different versions of the LMF or LMF-JIVE algorithms. First, we used the LMF algorithm with only joint structure (JO). We also applied LMF-JIVE, initializing by estimating (1) joint structure first (JF) or individual structure first (IF). We evaluated these algorithms by the same metrics as in the joint structure only simulation: reconstruction error and residual error, as follows: P true 2 k2F ) kF + kAi − Atrue i i=x,y,z (kJi − Ji Erec = k2F k2F + kAtrue k2F + kAtrue kJxtrue k2F + kJytrue k2F + kJztrue k2F + kAtrue z y x Eres =
kJx + Ax − Xk2F + kJy + Ay − Y k2F + kJz + Az − Zk2F . kXk2F + kY k2F + kZk2F
The results are given in Table 1. In general either of the LMF-JIVE settings performed better than the LMF-only settings, demonstrating the value of distinguishing joint and individual structure. However, the relative performance of joint-first or individual-first estimation for LMFJIVE depended on the context, with individual-first estimation performing better in scenarios with higher individual signal and joint-first estimation performing better in scenarios with higher joint signal. This demonstrates that the algorithm does not always converge to a global leastsquares solution. Thus, the results can be explained because the initial iteration will capture more variability with whichever component is estimated first. For this reason, we recommend using whichever order estimates the structure with the largest variance first or using both models and comparing them in terms of converged SSE. Between the joint and individual models, the mean residual error is comparable but those the better performing approach in terms of signal recovery tends to have a lower residual error. This is what we should expect, because the algorithm is supposed to be minimizing over the residual error. This is smaller than the residual error for the joint only model, which is also expected, since we simulated data with both joint and individual structure.
4
Imputation
In this section, we use the LMF and LMF-JIVE frameworks to introduce an imputation method for linked data with various forms of missingness, including missing rows and columns. Our 12
Table 1: Reconstruction error and residual error for 3 different variations of the LMF algorithm under equal joint and individual variance, higher joint variance, and higher individual variance. Key: JO = joint only algorithm; JF = joint structure estimated first; IF = individual structure estimated first.
Erec Mean (St. Dev.) Equal Variance Higher Joint Higher Ind Eres Mean (St. Dev.) Equal Variance Higher Joint Higher Ind
JO 0.7246 (0.1701) 0.0098 (0.0019) 1.643 (0.0272) JO 0.4950 (0.0613) 0.0126 (0.0021) 0.3591 (0.0269)
JF 0.1846 (0.2003) 0.0017 (0.0008) 0.9870 (0.2284) JF 0.1646 (0.0205) 0.0038 (0.0005) 0.0096 (0.0018)
IF 0.7079 (0.7783) 1.997 (0.0085) 0.0505 (0.0259) IF 0.1787 (0.0201) 0.0041 (0.0007) 0.0057 (0.0007)
approach extends similar methods that have been created for data imputation with a single matrix using an SVD. We extend an EM algorithm to iteratively impute the missing values using the SVD and compute the SVD given the imputed values (see (Kurucz et al., 2007; Fuentes et al., 2006). Thus, our method proceeds by iteratively updating missing values with successive applications of LMF-JIVE. Here we focus on missing data in X because of our interest in the imputation of cytotoxicity data; however, it is straightforward to extend the approach to impute missing data in Y or Z as well.
4.1
Algorithm
The imputation algorithm begins by initiating all of the missing values in the data. For single missing values, the entries are set to the mean of the row and column means for that position. If a full row is missing, each entry is set to the column mean for each column. Similarly if a full column is missing, each entry is set to its respective row mean. Finally, for the entries where both the row and the column are entirely missing, the entries are set to the full matrix mean. For a matrix X: ˆ ij = X ¯ if row i and column j are both missing X ˆ ij = X ¯ i. if row i is non-missing but column j is missing X ˆ ij = X ¯ .j if row i is missing but column j is non-missing X ˆ ij = (X ¯ i. + X ¯ .j )/2 if row i and column j are both non-missing X After initializing the matrix, we do the following: ˆ Let Jx be the joint 1. Compute the LMF-JIVE decomposition using the imputed matrix X. component estimate for X and Ax be the individual component estimate for X. 2. Impute the missing values using the decomposition in step 1. For missing entries in X, set ˆ ij . Xij = X 3. Repeat steps 1 and 2 until the algorithm converges. We used the squared Frobenius norm of the difference between the current and previous estimates of X as our convergence criterion, ˆ (t) − X ˆ (t−1) k2 < 0.0001. with a threshold of 0.0001. For the tth iteration, we stop if kX F
13
This imputation strategy can be considered an EM algorithm, under a normal likelihood model. To formalize this, let µx = U SV +Ux Sx Vx , µy = U SV +Uy Sy Vy , and µz = U SV +Uz Sz Vz give the mean for each entry in a random matrix. Assume that the residuals from this model are independent and normally distributed with means µx , µy , and µz for X, Y , and Z, respectively, and variance σ 2 . The log likelihood for this model is given below. Note that the values in X, Y , and Z are conditionally independent given the parameter space {U, S, V, Ux , Sx , Vx , Uy , Sy , Vy , Uz , Sz , Vz }, so the likelihood can be written as a product of independent normal likelihoods. It is easy to see that this likelihood is maximized when the total sum of squared residuals is minimized, which is accomplished by the alternating least squares method implemented by the LMF algorithm. Thus, step (1.) in the algorithm above corresponds to an M-step. Step (2.) corresponds to an E-step, where the expected values for X, Y , and Z are given by their means µx , µy , and µz . logL(U, S, V, Ux , Sx , Vx , Uy , Sy , Vy , Uz , Sz , Vz ; X, Y, Z) Y 2 Y 2 Y 2 1 1 1 ∝ log [e− 2σ2 (Xij −[µx ]ij ) ] [e− 2σ2 (Yij −[µy ]ij ) ] [e− 2σ2 (Zij −[µz ]ij ) ] i,j
i,j
i,j
X X 1 X (Yij − [µy ]ij )2 + (Zij − [µz ]ij )2 ] = − 2 [ (Xij − [µx ]ij )2 + 2σ i,j i,j i,j In practice the residual variance σ 2 may not be the same across data matrices. However, when X, Y and Z are normalized to have the same Frobenius norm, the M-step (1.) can be considered to optimize a weighted log-likelihood in which the likelihood for each data matrix are scaled to contribute equally.
4.2
Simulation
We generated 100 data sets using a simulation scheme analogous to that in Section 3.4 under each of 6 settings (2 different matrix dimensions for Y and Z and 3 different noise variances). In each setting, the X matrix dimensions were 50 × 50. The Y matrix was m2 × 50, where m2 was 30 or 200. Similarly, the Z matrix was 50 × n2 , where n2 was 30 or 200. In all simulations, m2 and n2 were equal. We varied the non-shared dimensions of Y and Z to see the effect of having more data in Y and Z on the imputation accuracy for X. We also varied the variance of the noise matrices among 0.1, 1, and 10. The ranks (r, rx , ry , and rz ) were each chosen from a Uniform({0, 1, 2, 3, 4, 5}) distribution. For each simulation we randomly set 3 rows, 3 columns, and up to 50 additional entries to missing. We compared 3 different methods for imputation: LMF-JIVE, LMF with only joint structure (LMF), and SVD. We then evaluated the methods using two different error calculations: the sum of squared errors for the imputed X matrix compared to the simulated X matrix and the sum of squared errors for the imputed X matrix T compared to the true underlying structure of the X matrix (Xtrue = U Sx V T +Uix Six Vix ). These values were computed separately for the two types of missing entries (those missing an entire row/column and those missing single entries). Error(X) = k(Xest − X)[missing values]k2F /kX[missing values]k2F
(8)
Error(Xtrue ) = k(Xest − Xtrue )[missing values]k2F /kXtrue [missing values]k2F A summary of the results are given in Table 2. Generally, the LMF-JIVE imputations performs better than the SVD imputation, indicating that incorporating information from Y and Z 14
Table 2: Results of the imputation simulations. Error(X) shows how well each method imputed the simulated data set, while Error(Xtrue ) shows how well each method imputed the true underlying structure of the simulated data set when excluding random noise. Each value is the mean from 100 simulations. The oracle is calculated as kEx [missing values]k2F /kX[missing values]k2F and represents the best the imputation can do because of the random noise.
Individual Missing m2 , n2 Var(Noise) 30 0.1 200 0.1 30 1 200 1 30 10 200 10 Row/Column Missing m2 , n2 Var(Noise) 30 0.1 200 0.1 30 1 200 1 30 10 200 10
SVD 0.025 0.028 0.232 0.222 1.061 1.139 SVD 1.022 1.023 1.022 1.018 1.016 1.014
Error(X) LMF LMF-JIVE 0.031 0.024 0.028 0.032 0.274 0.218 0.215 0.198 1.185 0.931 0.927 0.85 Error(X) LMF LMF-JIVE 0.968 0.572 1.698 0.594 3.967 0.667 7.971 0.618 7.652 1.124 5.399 0.877
SVD 0.007 0.007 0.068 0.067 1.144 1.288 SVD 1.022 1.024 1.027 1.021 1.050 1.038
Error(Xtrue ) LMF LMF-JIVE 0.013 0.005 0.006 0.010 0.120 0.051 0.058 0.039 1.495 0.803 0.815 0.580 Error(Xtrue ) LMF LMF-JIVE 0.965 0.563 1.731 0.584 4.788 0.601 9.639 0.536 22.804 1.328 14.088 0.663
Oracle 0.018 0.022 0.174 0.165 0.640 0.631 Oracle 0.019 0.023 0.175 0.175 0.650 0.632
can improve accuracy. This is especially helpful for the full row/column missing values, where the SVD imputation can not do better than mean imputation because there is no information present for estimating those entries with an SVD (so the SVD error is always greater than 1). An exception is when there is high noise and the dimensions of Y and Z are small, in which case LMF and LMF-JIVE may be overfitting. LMF with joint structure universally performed worse than LMF-JIVE for this study, demonstrating the benefit of decomposing joint and individual structure.
5
Rank Selection Algorithms
Selection of the joint and individual ranks for LMF-JIVE must be considered carefully, to avoid misallocating joint and individual structure. Several rank selection approaches have been proposed for JIVE and related methods for vertical integration, including permutation testing (Lock et al., 2013), Bayesian information criterion (BIC) (O’Connell and Lock, 2016; Jere et al., 2014), and likelihood cross-validation (Li and Jung, 2017). Here we propose and implement two approaches to rank selection in the LMF-JIVE context: (i) a permutation testing approach extending that used for JIVE (Section 5.1), and (ii) a novel approach based on cross-validated imputation accuracy of missing values (Section 5.2). Our results suggest that the two approaches give similar overall performance regarding rank recovery; approach (i) is well-motivated if a rigorous and conservative statistical approach to the identification of joint structure is desired, whereas approach (ii) is well-motivated if missing value imputation is the primary task.
15
5.1 5.1.1
Permutation Test Algorithm
We generate a null distribution for joint structure by randomly permuting the rows of Z and the columns of Y to break any associations between the matrices while maintaining the structure within each matrix. We generate a null distribution for individual structure by an appropriate permutation of the entries within a matrix, under the motivation that individual low-rank approximations should give correlated structure that is not explained by the joint approximation. We iterate between selecting the joint rank from {X J , Y J , Z J }, updating the LMF-JIVE decomposition, and selecting the individual ranks from {X I , Y I , Z I }, until the selected ranks remain unchanged. The joint rank is estimated as follows: 1. Let rmax be the maximum possible (or plausible) joint rank (r) for the data. ˜ = X J , Y˜ = Y J , and Z˜ = Z J . 2. Initialize X 3. Compute the sum of squared residuals for a rank 1 LMF approximation of the data: ˜ 2F + kJy − Y˜ k2F + kJz − Zk ˜ 2F SSR = kJx − Xk ˜ =X ˜ −Jx , Y˜ = Y˜ −Jy , 4. Subtract the joint structure from step 3 from X J , Y J , and Z J . Set X and Z˜ = Z˜ − Jz . 5. Repeat steps 3 and 4 (rmax − 1) times. 6. Permute the columns of Y and the rows of Z by sampling without replacement, yielding Yperm and Zperm . 7. Set Y˜ = Yperm , and Z˜ = Zperm . 8. Repeat steps 3 and 4 rmax times using the simulated data set. 9. Repeat steps 6 through 8 for 99 more permutations. 10. Select r as the highest rank such that the SSR of the true data is higher than the 95th percentile of the SSRs for the permuted data. To estimate the individual ranks of the data sets, we permute all entries of X I , the entries within each row in Y I , and the entries within each column in Z I . We compute an SVD of rank ri,max for each of the true data matrices i = X, Y, Z, and also for each of the permuted matrices. For each matrix, r is then chosen to be the highest rank such that the rth singular value of the true data is higher than the 95th percentile of the rth singular values for the permuted data sets. 5.1.2
Simulation
We used a simulation to test the permutation rank selection algorithm. We simulated 100 data sets with randomly chosen joint and individual ranks from independent Uniform({0, 1, 2, 3, 4, 5}) distributions. As in Section 3.4, all elements of the joint structure components, U , Sx , V , Uy , and Vz , and the individual structure components, Uix , Vix , Uiy , Viy , Uiz , and Viz , were simulated from a Normal(0, 1) distribution. The simulation showed that the permutation test tends to underestimate joint rank, and it tends to overestimate the individual rank. It underestimated joint rank in 76% of the simulations. 16
It overestimated the individual ranks for X, Y , and Z by 51%, 59%, and 68%, respectively. The individual rank of X was estimated better than the other ranks, with 43% of simulations getting the correct rank and a mean absolute deviation of 0.85.
5.2 5.2.1
Cross-validation Algorithm
We consider the following forward selection algorithm based on cross-validation missing value imputation to choose the ranks: 1. Randomly set a portion (full rows, full columns, and some individual entries) of the matrix entries to missing. 2. Use the imputation algorithm described in Section 4 to estimate the full matrix, Xest . 3. Compute the sum of squared error (SSE0 = k(Xest − X)k2F ) for the null imputation with ranks r, rx , ry , rz = 0, 0, 0, 0. 4. Add 1 to each rank and compute the SSE for each resulting imputed matrix. 5. If no models were better than SSE0 , then choose that model’s ranks and stop. 6. Otherwise, choose the model with the lowest SSE and set SSE0 to that model’s SSE. 7. Repeat steps 4 through 6 until adding 1 to any rank does not decrease the SSE of the imputation. While we chose forward selection here, stepwise selection and an exhaustive search of all possible combinations are also possible. We tested the stepwise selection and got almost equivalent results, indicating that the algorithm was seldom taking backwards steps. A more exhaustive search would have probably yielded more accurate results, as the SSE was higher for our selected ranks than when using the true ranks in many of the cases; however, this would have required running the algorithm for 64 rank combinations, which is computationally infeasible. 5.2.2
Simulation
We tested this cross-validation approach using 100 simulated data sets generated as in Section 5.1.2. In contrast to the permutation test, the cross-validation method tended to overestimate the joint rank and underestimate the individual ranks. It correctly estimated joint rank in 30% of simulations and overestimated it in 58%. The mean absolute deviation for the estimated rank from the true joint rank was 1.17. The estimates for the individual structure of X were closer, with 58% capturing the true rank and an mean absolute deviation of 0.74. The Y and Z individual ranks were underestimated 61% and 62% of the time, respectively. They had a mean absolute deviation of 1.26 (for Y ) and 1.21 (for Z).
6
Application to Toxicology Data
We applied the LMF-JIVE algorithm to the toxicity (X), chemical attribute (Y ), and genotype data (Z). Previous investigations of these data (Abdo et al., 2015; Eduati et al., 2015) and similar data (Lock et al., 2012) have found clear evidence of systematic cell-line variability in toxicity for several chemicals, but the genetic drivers of this variability have not been well
17
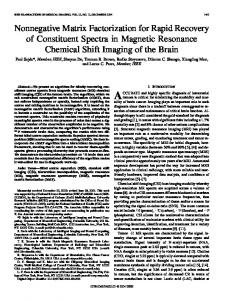
characterized. Various analyses presented in Eduati et al. (2015) show that molecular chemical attributes are significantly predictive of overall (mean) chemical toxicity. We are interested in assessing the combined predictive power of chemical attributes and genetics on toxicity using a fully multivariate and unified approach, and we are also interested more generally in exploring patterns of systematic variability within and across these three linked data matrices. For 751 cell lines, the cytotoxic effect of each of 105 different chemicals was quantified by log(EC10 ), where EC10 is the dose concentration that results in a 10% decrease in cell viability; these values make up the toxicity matrix X : 751 × 105. Approximately 1.3 million SNPs were available for each of the 751 cell lines. SNP values were of the form z = {0, 1, 2}, where z gives the number of minor alleles. We first removed all SNPs with missing values across any of the 751 cell lines, and removed those SNPS with a minor allele frequency less than or equal to 5/751 ≈ 0.007. To identify a set of SNPs with potential relevance to cell toxicity, we performed a simple additive linear regression to predict toxicity from SNP for each (SNP, chemical) pair. Those SNPs with an association p-value less than 10−8 for any chemical were included, resulting in 441 SNPs Z : 751×441. For each of the 105 chemicals, data were available for 9272 quantitative structural attributes defined using the Simplex representation for molecular structure (SIRMS) (Kuz’min et al., 2008). Attributes with value 0 for at least 100 chemicals were removed, leaving 2092 attributes. These values were log-transformed (y = log(y + 1) and centered so that each attribute had mean 0. To identify a set of attributes with potential relevance to cell toxicity, we performed a simple additive linear regression to predict toxicity for each (attribute, cell line) pair. Those attributes with an association p-value less than 10−3 for any cell line were included, resulting in 105 attributes Y : 105 × 105. All three matrices (X, Y , and Z) were centered to have overall mean 0, and scaled to have the same Frobenius norm. We conducted a robust 20-fold cross-validation study to assess the accuracy of recovering underlying structure via missing data imputation. For each fold 5% of the columns of X (chemicals) were withheld as missing, 5% of the rows of X were withheld as missing, and 5% of the entries of X from the remaining rows and columns are randomly selected to be withheld as missing. The folds were non-overlapping, so that each entry of X has its column missing exactly once, its row missing exactly once, and its value missing (with most other values in its row and column present) exactly once, over the 20 folds. For each fold we impute all missing values as described in Section 4.1, using either a joint-only LMF for {X, Y , Z}, an SVD approach for X only, or a joint and individual LMF-JIVE approach. We select the model ranks via the forward-selection approach of Section 5.2, using the mean squared error for imputed values (averaged over row-missing, column-missing, and entrywisemissing imputations) as the selection criteria. This results in a joint factorization with rank r = 4, an SVD factorization with rank rX = 5, and a joint and individual factorization with ranks r = 3, rX = 4, rY = 2, and rZ = 6. The relative imputation accuracy (Equation (8) for each method is shown in Table 3, broken down by accuracy in imputing entry-wise missing values, column-wise missing, row-wise missing, and values that are missing their entire row and column. The joint and individual factorization approach performed comparatively well for all types of missing data, demonstrating that it is a flexible compromise between the joint only and individual only (SVD) approaches. SVD imputation performed better than joint imputation for entry-wise missing data, and similarly to joint and individual imputation. This suggests that the attributes (Y ) and genetics (Z) provide little additional information on the toxicity for a given [cell line, chemical] pair, given other values in X. However, where no toxicity data are available for a given cell line and chemical, imputation accuracy is substantially improved with the joint approaches that use Y and Z (here SVD imputation using X only can perform no better than a relative error of 1, because there is no data for the given row and column). Figure 3 shows heatmaps of data for each of the linked matrices, as well as heatmaps from
18
Table 3: Relative error for missing data imputation under different factorization approaches.
Missing chemical and cell line Missing chemical Missing cell line Missing entry
LMF 0.878 0.898 0.203 0.164
SVD 1.02 1.02 0.208 0.112
LMF-JIVE 0.854 0.875 0.201 0.114
their low-rank approximations resulting from the joint and individual factorizations with the selected ranks. The toxicity data has several chemicals that are universally more toxic across the cell line panel and several chemicals that are universally less toxic; but there are also some chemicals that demonstrate clear and structured heterogeneity across the cell lines. The chemical attribute heatmap shows distinctive patterns corresponding to more toxic and less toxic chemicals. Patterns in the SNP data that are associated with toxicity are less visually apparent. However, a plot of the cell line scores for the first two joint components in Figure 4 reveals a prominent racial effect; cell lines that are derived from individual from native African populations are distinguished from cell lines derived from non-African populations. The effect of race on toxicity is not strongly detectable when considering each chemical independently; under independent t-tests for African vs. non-African populations, the smallest FDR-adjusted (Benjamini and Hochberg, 1995) p-value is 0.05. However, a permutation-based test using Distance Weighted Discrimination (Wei et al., 2016) for an overall difference between African and non-African populations across the 105 chemicals is highly significant (p-value< 0.001), reinforcing the finding that toxicity profiles can differ by race. DATA APPROXIMATION
SNPs
Chemicals
SNPs
Cell lines
Chemicals
Attributes
Attributes
Cell lines
Figure 3: Heatmaps of the toxicity, attribute, and genotype data matrices (left) and their lowrank approximations (right).
19
Figure 4: First two cell-line components of joint structure; ’+’ denotes a cell line derived from a native African population, ’O’ denotes a cell line derived from a non-African population.
7
Discussion
With a dramatically increasing number of modalities for collecting high-content and multi-faceted data efficiently, large multi-source and interlinked data sets are becoming increasingly common. Methods that can appropriately address these data without simplifying their structure are needed. Although our development for this article was motivated by a cytotoxicity study, the methodology is relevant to potential applications in a wide range of other fields. Most notably, new methods for simultaneous horizontal and vertical integration are needed for integrating molecular “omics” data across multiple disparate sample sets, e.g., the integration of multi-omics molecular data across multiple disparate types of cancer (pan-omics pan-cancer). LMF improves on previous methods for horizontal or vertical integration only, to allow for bidimensional integration. The LMF and LMF-JIVE decompositions can be used for exploratory analyses, missing data imputation, dimension reduction, and for creating models using the joint or individual components. Although we have proposed two rank selection methods for LMF in this paper, both of them tend to be overly conservative. Other approaches may be more accurate; for example, some form of efficient search may perform better than forward selection for the cross-validation rank selection approach. It may also be possible to create a model-based approach, such as the BIC approach for JIVE described in Jere et al. (2014) and O’Connell and Lock (2016). As shown in Section 3.4, the LMF-JIVE algorithm does not always reach a global optimum. Therefore, it may be beneficial to try different starting values for the U or V matrix estimates. Another option is to try both estimating joint structure first and estimating individual structure first, as in Section 3.4. The LMF algorithm is estimated via a squared residual loss function, which is best motivated under the assumption that the data are normally distributed. While this is a reasonable assumption for many applications, it may not be appropriate for some contexts. For example, for categorical or count data, a model-based approach with alternative likelihoods for each dataset may be more appropriate. This idea is explored for the context of vertical integration in Li and 20
Gaynanova (2017). Adjusting the LMF algorithm to accommodate other likelihoods is an area for future research. Another exiting direction of future work for the integration of linked data are extensions to higher-order tensors (i.e., multi-way arrays). Current multi-source decomposition methods, including LMF, are limited to two-dimensional tensors (matrices). However, multi-source data sets may involve data with more than two dimensions. For example, for the cytotoxicity data analyzed here, the toxicity matrix is a summary of toxicity data for multiple concentrations of each chemical. However, we could avoid this summary and work with the individual concentrations, which would give us a 3-dimensional tensor for toxicity (cell lines × chemicals × concentrations). Then we would have a multi-way, multi-source problem that we could solve using LMF if we had a method for handling joint and individual tensor decompositions. Additionally, a multi-source data decomposition for higher-order tensors could have potential applications in MRI studies and personalized medicine. LMF provides an important first step toward more general higher-order data integration, because it allows multiple dimensions to be shared, which is is likely to be encountered for multi-source tensor data.
8
Availability
R code to perform the LMF and LMF-JIVE algorithms, including code for rank selection and missing value imputation, are available online at https://github.com/lockEF/LMF.
21
References Abdo, N., Xia, M., Brown, C. C., Kosyk, O., Huang, R., Sakamuru, S., Yi-Hui, Z., Jack, J. R., Gallins, P., Xia, K., et al. (2015). Population-based in vitro hazard and concentration-response assessment of chemicals: the 1000 genomes high-throughput screening study. Environmental Health Perspectives (Online), 123(5):458. Acar, E., Kolda, T. G., and Dunlavy, D. M. (2011). All-at-once optimization for coupled matrix and tensor factorizations. arXiv preprint arXiv:1105.3422. Benjamini, Y. and Hochberg, Y. (1995). Controlling the false discovery rate: a practical and powerful approach to multiple testing. Journal of the Royal Statistical Society: Series B, 57(1):289–300. Crainiceanu, C. M., Caffo, B. S., Luo, S., Zipunnikov, V. M., and Punjabi, N. M. (2011). Population value decomposition, a framework for the analysis of image populations. Journal of the American Statistical Association, 106(495):775–790. Dempster, A. P., Laird, N. M., and Rubin, D. B. (1977). Maximum likelihood from incomplete data via the em algorithm. Journal of the royal statistical society. Series B (methodological), pages 1–38. Ding, C. and Ye, J. (2005). 2-dimensional singular value decomposition for 2d maps and images. In Proceedings of the 2005 SIAM International Conference on Data Mining, pages 32–43. SIAM. Eduati, F., Mangravite, L. M., Wang, T., Tang, H., Bare, J. C., Huang, R., Norman, T., Kellen, M., Menden, M. P., Yang, J., et al. (2015). Prediction of human population responses to toxic compounds by a collaborative competition. Nature biotechnology. Fuentes, M., Guttorp, P., and Sampson, P. D. (2006). Using transforms to analyze space-time processes. MONOGRAPHS ON STATISTICS AND APPLIED PROBABILITY, 107:77. Harshman, R. A. (1970). Foundations of the PARAFAC procedure: Models and conditions for an “explanatory” multi-modal factor analysis. UCLA Working Papers in Phonetics, 16:1–84. Huo, Z., Ding, Y., Liu, S., Oesterreich, S., and Tseng, G. (2016). Meta-analytic framework for sparse k-means to identify disease subtypes in multiple transcriptomic studies. Journal of the American Statistical Association, 111(513):27–42. Jere, S., Dauwels, J., Asif, M. T., Vie, N. M., Cichocki, A., and Jaillet, P. (2014). Extracting commuting patterns in railway networks through matrix decompositions. In 13th IEEE International Conference on Control, Automation, Robotics and Vision (ICARCV), pages 541–546. IEEE. Khan, S. A. and Kaski, S. (2014). Bayesian multi-view tensor factorization. In Joint European Conference on Machine Learning and Knowledge Discovery in Databases, pages 656–671. Springer. Kim, S., Kang, D., Huo, Z., Park, Y., and Tseng, G. C. (2017). Meta-analytic principal component analysis in integrative omics application. Bioinformatics. Kurucz, M., Bencz´ ur, A. A., and Csalog´any, K. (2007). Methods for large scale svd with missing values. In Proceedings of KDD cup and workshop, volume 12, pages 31–38. 22
Kuz’min, V., Artemenko, A. G., and Muratov, E. N. (2008). Hierarchical QSAR technology based on the simplex representation of molecular structure. Journal of computer-aided molecular design, 22(6-7):403–421. Li, G. and Gaynanova, I. (2017). A general framework for association analysis of heterogeneous data. arXiv preprint arXiv:1707.06485. Li, G. and Jung, S. (2017). Incorporating covariates into integrated factor analysis of multi-view data. Biometrics. Lock, E. F., Abdo, N., Huang, R., Xia, M., Kosyk, O., O’Shea, S. H., Zhou, Y.-H., Sedykh, A., Tropsha, A., Austin, C. P., et al. (2012). Quantitative high-throughput screening for chemical toxicity in a population-based in vitro model. Toxicological Sciences, 126(2):578–588. Lock, E. F., Hoadley, K. A., Marron, J. S., and Nobel, A. B. (2013). Joint and individual variation explained (JIVE) for integrated analysis of multiple data types. The annals of applied statistics, 7(1):523. L¨ ofstedt, T. and Trygg, J. (2011). OnPLS – a novel multiblock method for the modelling of predictive and orthogonal variation. Journal of Chemometrics, 25(8):441–455. O’Connell, M. J. and Lock, E. F. (2016). R.JIVE for exploration of multi-source molecular data. Bioinformatics, 32(18):2877–2879. Ray, P., Zheng, L., Lucas, J., and Carin, L. (2014). Bayesian joint analysis of heterogeneous genomics data. Bioinformatics, 30(10):1370–1376. Schouteden, M., Van Deun, K., Wilderjans, T. F., and Van Mechelen, I. (2014). Performing disco-sca to search for distinctive and common information in linked data. Behavior research methods, 46(2):576–587. Tseng, G. C., Ghosh, D., and Zhou, X. J. (2015). Integrating Omics Data. Cambridge University Press. Tucker, L. R. (1966). Some mathematical notes on three-mode factor analysis. Psychometrika, 31(3):279–311. Wall, M. E., Rechtsteiner, A., and Rocha, L. M. (2003). Singular value decomposition and principal component analysis. In A practical approach to microarray data analysis, pages 91–109. Springer. Wei, S., Lee, C., Wichers, L., and Marron, J. (2016). Direction-projection-permutation for highdimensional hypothesis tests. Journal of Computational and Graphical Statistics, 25(2):549– 569. Westerhuis, J., Kourti, T., and MacGregor, J. (1998). Analysis of multiblock and hierarchical pca and pls models. Journal of Chemometrics, 12(5):301–321. Wold, S., Kettaneh, N., and Tjessem, K. (1996). Hierarchical multiblock pls and pc models for easier model interpretation and as an alternative to variable selection. Journal of Chemometrics, 10(5-6):463–482. Yang, Z. and Michailidis, G. (2016). A non-negative matrix factorization method for detecting modules in heterogeneous omics multi-modal data. Bioinformatics, 32(1):1–8.
23
Ye, J. (2005). Generalized low rank approximations of matrices. Machine Learning, 61(1-3):167– 191. Yokota, T. and Cichocki, A. (2014). Linked Tucker2 decomposition for flexible multi-block data analysis. In International Conference on Neural Information Processing, pages 111–118. Springer. Zhao, Q., Shi, X., Xie, Y., Huang, J., Shia, B., and Ma, S. (2014). Combining multidimensional genomic measurements for predicting cancer prognosis: observations from tcga. Briefings in bioinformatics, page bbu003. Zhou, G., Cichocki, A., Zhang, Y., and Mandic, D. P. (2015). Group component analysis for multiblock data: Common and individual feature extraction. IEEE Trans Neural Netw Learn Syst. Advance online publication.
24