Everglades of southern Florida has been extended to create a new model ..... FISHES. on-line, 2002. ... mation Systems and Agent-Based Modeling Tech-.
Linking Hydrologic Modeling and Ecologic Modeling: An Application of Adaptive Ecosystem Management in the Everglades Mangrove Zone of Florida Bay Jon C. Cline a , Jerome J. Lorenzb and Eric D. Swainc a
Department of Biology Case Western Reserve University 10900 Euclid Avenue Cleveland, Ohio 44106-7080, U.S.A. b
National Audubon Society 115 Indian Mound Tavernier, Florida 33070, U.S.A. c
U.S. Geological Survey 9100 NW 36th Street, STE 107 Miami, Florida 33178, U.S.A. Abstract: The Across Trophic Levels System Simulator (ATLSS) is a suite of ecological models designed to assess the impact of changes in hydrology on biotic components of the southern Florida ecosystem. ATLSS implements a multimodeling approach that utilizes process models for lower trophic levels, structured population models for middle trophic levels (fish and macroinvertebrates), and individual-based models for large consumers. ATLSS requires hydrologic input to assess the effects of alternative proposed restoration scenarios on trophic structure. An ATLSS model (ALFISH) for functional fish groups in freshwater marshes in the Everglades of southern Florida has been extended to create a new model (ALFISHES) to evaluate the spatial and temporal patterns of fish density in the resident fish community of the Everglades mangrove zone of Florida Bay. The ALFISHES model combines field data assessing the impact of salinity on fish biomass with hydrologic data from the Southern Inland and Coastal System (SICS) model. The estuarine landscape is represented by a grid of 500 × 500-meter cells across the coastal areas of the Florida Bay. Each cell is divided into two habitat types; flats, which are flooded during the wet season, and creeks, which remain wet and serve as refugia during the dry season. Daily predictions of water level and salinity are obtained from the SICS model output, which is resampled at the 500-meter spatial resolution of the ALFISHES model. The model output may be used to assess the impact of changes in hydrology on fish biomass and its availability to wading bird and other consumer populations. With the development of restoration scenario capabilities in the SICS model, the SICS/ALFISHES coupling should prove an effective tool for evaluating the potential impact of water management policies on the wading bird population in the Everglades mangrove zone. Keywords: Everglades; Spatially explicit model; mangrove zone; Fish; Scenario evaluation
1
I NTRODUCTION
Wading birds have long been a predominant feature of the Everglades mangrove zone of Florida Bay. In particular, the Roseate Spoonbill (Ajaia ajaja), a key indicator species due to its strong site fidelity [Lorenz, 2000], has been in decline in recent
years. It has been proposed [Lorenz et al., 2002] that changes in the natural pattern of water delivery from the freshwater marshes to the mangrove zone have played a significant role in the decline of the local Roseate Spoonbill population, due to reduced availability of local estuarine fish, its primary food source.
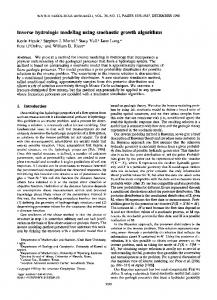
Directly or indirectly, small estuarine fish are an important food source for many wading birds, crocodiles, and large predatory fish in the southern Everglades mangrove zone. Changes in hydrology upstream have increased salinity and altered flooding regimes. A study of the impact of hydrology on the community of small mangrove fish in Taylor Slough and C-111 basins [Lorenz, 1999] suggests these changes may have altered the composition of the resident fish community and affected the relative availability of prey base fish. Thus the ability to link the predicted hydrology to the ecological response of fish populations is an important part of evaluating the effectiveness of water-delivery schemes. The U. S. Geological Survey has developed two separate models applicable to the southern Everglades. The Southern Inland and Coastal System (SICS) model [Swain, 1999; Swain et al., 2004] is a hydrodynamic surface-water flow model modified for wetlands application and recently coupled to a ground-water model to account for leakage and salinity transfer. The Across Trophic Levels System Simulator (ATLSS) is a suite of ecological models designed to assess the impact of changes in hydrology on biotic components of the southern Florida landscape [DeAngelis et al., 1998; DeAngelis et al., 2002]. Both SICS and ATLSS are essential parts of restoration planning in South Florida. ATLSS implements a multimodeling approach that utilizes process models for lower trophic levels, structured population models for functional groups of fish and macroinvertebrates, and individual-based models for large consumers. To simulate the dynamics of the estuarine fish community, an existing ATLSS model (ALFISH version 5.0.0) for functional fish groups in freshwater marshes in the Everglades (multicolored areas in Figure 1) was extended to create a new model (ALFISHES) [Cline and Swain, 2002] to evaluate the spatial and temporal patterns of fish density in the Everglades mangrove zone of Florida Bay. ALFISHES requires input from a hydrologic model to assess the effects of alternative proposed restoration scenarios on trophic structure. The areal distribution of water depths and salinity computed by SICS is used to drive the various components of ALFISHES. This information represents the most complete application to date of the hydrodynamic and transport equations to represent the wetland flow and salinity movement in the coastal area of the southern Everglades.
PRIVATE WCA 1
WCA 2A Mullet Slough
WCA 3A North WCA 2B
Central BCNP BCNP ME (N41)
WCA 3A South
URBAN
South BCNP (N41) WCA 3B South BCNP BCNP ME (S41) (S41) East Slough Shark Slough
EXPLANATION Field Site ALFISHES Model Boundary
Shark Slough ME
NE Shark Slough
NE Taylor Slough LP Key/STS
Eastern Panhandle Highway Creek
Joe E. Panhandle ME Cape Sable LP Key/STS Taylor Bay Bay River lorida ME F
N
Figure 1: Subregions for Fish Model with ALFISHES Study Area (ME: Mangrove Estuary; STS: South Taylor Slough) and Field Sites (from left to right: TR, JB, HC)
2
MODEL DESCRIPTION AND SOLUTION METHODS
The restoration of the South Florida Everglades ecosystems requires linking landscape changes associated with environmental management with changes in key biotic components of the landscape [DeAngelis et al., 2002]. The management process involves developing scenarios of landscape change, developing and applying a suite of hydrologic and ecological models to project the impact of different scenarios on the Everglades ecosystem, and applying a decision framework analyze model output and evaluate management alternatives (see Figure 2). ALFISHES is designed to utilize the ATLSS modeling infrastructure to implement individual model components and to integrate these components into a single framework. The ATLSS modeling framework combines functionality associated with traditional Geographic Information System (GIS) software with an agent-based modeling approach [Duke-Sylvester and Gross, 2002]. The fish model landscape consists of multiple grid layers including static layers such as vegetation
80°45´
80°50´
80°40´
80°30´
80°35´
80°25´
25°25´
Levee 31W
ad
Ro
Mai n P a
90
d un So
Royal Palm Ranger Station
98
rd Ca
rk
Ro
ad
Taylor Slough Bridge
80
Old Ingraham Highway
25°20´ 70
ugh
C-1 11
West Highway Creek
1
Taylor Slo
60
East Highway Creek Sound
50
25°15´
Barnes
40
y Joe Ba 30
West Lake
148
Lon
gL
20
ake
140
FLORIDA BAY
25°10´
Oregon Creek
Stillwater Creek
10
Shell Creek 1 1
10
20
30
Alligator Creek
40
50
0
1
2
3
4
5 MILES
60
McCormick Creek
Base from U.S. Geological Survey digital data, 1972 Universal Transverse Mercator projection, Zone 17, Datum NAD 27
0 1 2 3 4 5 KILOMETERS
70
80
90
Taylor River
100
East Creek
110
120
Mud Creek
130
Trout Creek
EXPLANATION EVERGLADES NATIONAL PARK APPROXIMATE AREA OF TAYLOR SLOUGH BOUNDARY OF SOUTHERN INLAND AND COASTAL SYSTEMS (SICS) STUDY AREA
BUTTONWOOD EMBANKMENT LOCATION OF SURFACE CHANNELS
Figure 3: Southern Inland and Coastal Systems (SICS) study area with 305 meter square grid overlay (USGS, U.S. Geological Survey; NPS, National Park Service; SFWMD South Florida Water Management District).
Figure 2: Decision Process for Ecosystem Restoration (adapted from [DeAngelis et al., 2002; Pearlstine et al., 2004]).
types and topography, combined with dynamic layers such as hydrology and fish biomass. The ATLSS C++ landscape classes [Duke-Sylvester and Gross, 2002], which provide a common interface for manipulating spatial data, are the primary means of communicating spatial information between different model agents. ALFISHES consist of the following components: • hydrology component: spatially-explicit time series of water depth and salinity • landscape component: distribution of marsh or mangrove habitat within a single landscape cell • lower trophic level components: food base for small fish • fish component: fish population model
The following subsections describe SICS and the ALFISHES model components in more detail. 2.1
The Hydrology: the SICS Numerical Model
The Southern Inland and Coastal Systems (SICS) model is used to represent the hydrology of the
model area (Swain and others, 2003). SICS utilizes a two-dimensional, dynamic surface-water model, called SWIFT2D, coupled to a three-dimensional ground-water model, called SEAWAT. This coupled model has several features which allow it to produce an advanced simulation. Both the surface-water and ground-water models simulate salinity transport and the effects on fluid density. The formulations have been modified to account for wind forcing, coastal creek flows, evapotranspiration, and leakage between the surface-water and ground-water. The model area is discretized into a 305 meter square grid as shown in figure 3. The surface-water model operates on a timestep of 7.5 minutes and the ground-water model has a 1 day timestep. A simulation period of 7-years, 1996-2002 inclusive, has been developed and verified. For the purpose of supplying data for ecological models, 1 day averaged values are output from the simulation. In order to utilize the SICS model to analyze possible changes to the system resulting from ecosystem restoration scenarios, it is necessary to modify the boundaries of the SICS model to reflect regional changes to the south Florida hydrologic system. The boundaries of the SICS model are shown in figure 4. The boundary modifications are accomplished by utilizing results from the South Florida Water Management Model (SFWMM) which represent the modifications to the hydrologic system proposed for restoration purposes. The SFWMM is a much coarser model and uses a 2 mile by 2 mile grid size. Analysis of the SFWMM indicates that the produced water-levels are more accurate than the discharges, thus the water-levels produced on
80°50´
80°40´
80°45´
80°30´
80°35´
80°25´
25°25´ S-175
Levee 31W
Mai
n P a
Taylor Slough Bridge discharge
25°20´
C-111 water level
Old Ingraham Highway CY2
CY3
NP67
S-18C
ugh
NP46
27
L-31W discharge
1
C-1 11
Taylor Slo
C-111 discharge
S-197
East Highway Creek
Barnes Sou
NMP (Nine Mile Pond)
25°15´
West Highway Creek Long Sound
y Joe Ba West Lake
Trout Creek Culverts beneath
Taylor River
US-1 water level
McCormick Creek
25°10´
nd
rk
Ro ad
Taylor Slough Bridge
FLORIDA BAY Florida Bay water level
Buoy Key 0 1 2 3 4 5 KILOMETERS 0
1
2
3
4
5 MILES
Butternut Key Whipray Basin
Base from U.S. Geological Survey digital data, 1972 Albers Equal-Area Conic projection, Datum NAD 1983 Standard Parallels 29°30´ and 45°30´, central meridian 23°00´
EXPLANATION
EVERGLADES NATIONAL PARK APPROXIMATE AREA OF TAYLOR SLOUGH NO-FLOW BOUNDARY BOUNDARY OF SOUTHERN INLAND AND COASTAL SYSTEMS (SICS) STUDY AREA
SPECIFIED WATER-LEVEL MODEL CELL SPECIFIED FLUX MODEL CELL OFFSHORE WATER-LEVEL STATION EVERGLADES NATIONAL PARK WATER LEVEL STATION COASTAL FLOW AND STAGE STATION (U.S. GEOLOGICAL SURVEY)
Figure 4: Southern Inland and Coastal Systems (SICS) study area and selected data-collection sites. (USGS, U.S. Geological Survey; NPS is National Park Service).
Figure 5: Southern Inland and Coastal Systems (SICS) study area with the SFWMM 2 × 2 mile grid overlay. (USGS, U.S. Geological Survey; NPS is National Park Service).
the 2 × 2 mile SFWMM grids are interpolated to develop new boundary data for the SICS model (see Figure 5). Replacing the SICS model field-data-produced boundaries with interpolated water-level values from the SFWMM model for the base case, produces very similar results. This indicates that using the SFWMM boundaries is a valid approach. Several different restoration scenarios are to be tested in this manner. A primary scenario is referred to as D13R, which describes hydrologic conditions that are expected to exist in the year 2050 if the Comprehensive Everglades Restoration Plan (CERP) is implemented. This plan involves removal of canal sections and new hydraulic control structures and operating rules. 2.2
The Landscape Fish Model: ALFISHES
The model components of ALFISHES are designed to incorporate the impact of local hydrologic conditions, including salinity levels, on fish population dynamics. The basic model architecture and behavior is derived from ALFISH. ALFISHES is designed to mimic the behavior of the ALFISH in the freshwater marsh habitat in the northern edge of the SICS/ALFISHES modeling area. Since the ALFISHES modeling area straddles a dynamic salinity gradient that characterizes the estuarine ecotone between the Everglades freshwater marshes and Florida Bay, salinity plays a significant role in model dynamics. Along the gradient from freshwa-
Figure 6: SICS vegetation map (adapted from [Carter et al., 1999] with the SICS and ALFISHES study areas.
ter marsh to the estuarine mangrove zone, increasing salinity is associated with changes in the composition of the habitat structure, the lower trophic level, and the small fish community. The Hydrology: Linking SICS and ALFISHES to Model Dynamics. ALFISHES requires input from a hydrologic model, such as SICS, that includes salinity. In order to process hydrologic output for ALFISHES, output from SICS simulations representing different water management scenarios is archived. A collection of programs utilizing the ATLSS landscape library was developed to resample the SICS output at the 500-meter spatial resolution of the ALFISHES model and build spatial data sets representing the time series of water depths and salinity in the model area. These spatial data sets are used as input for the ALFISHES model.
Figure 7: Hydrology of dwarf mangrove creek habitat. (adapted from Lorenz [2000])
The mangrove zone landscape model is based on data collected at field sites [Lorenz, 1999] and the static SICS vegetation map [Carter et al., 1999] (see Figure 6). Each cell in the model landscape represents a 500 ×500-m cross-section of the Everglades mangrove zone. The impact of hydrology in the single cell fish model of DeAngelis et al. [1997] was captured by dividing the habitat within the cell into three parts: marsh, pond, and solution holes. The marsh areas reflood periodically, while the ponds and solution holes serve as refugia during periods of low water. The field sites are located in dwarf mangrove (Rhizophora mangle) habitat and are characterized by deep creeks surrounded by flats that are flooded seasonally [Lorenz, 1999]. When the sites flood, the fish spread across the flats. The fish either retreat to refugia (in this case, creeks), or retreat to neighboring spatial cells, or die, if the cell dries out (Figure 7). 3
MODEL ARCHITECTURE AND IMPLEMENTATION
The ATLSS model components are agent-based and use a library of C++ landscape classes to model landscape and hydrologic data [Duke-Sylvester and Gross, 2002]. The ATLSS landscape class library provides common interface for manipulating spatial data, a generic IODevice class for managing data input and output, a generic Metadata class for describing spatial data and other basic data types, and support for manipulating time series of spatial datasets. More details about the ATLSS approach are available at http://atlss.org/. ALFISHES (see Figure 8) incorporates some addi-
Figure 8: Classes of the ALFISHES model
tional features not provided by the original ATLSS framework: support for XML (eXensible Markup Language)-base metadata, abstract interfaces for generic components (e.g. a generic hydrologic model interface), support for a model repository allowing dynamic loading of model components specified by metadata, and a CORBA-based clientserver implementation that combines a Java-based GUI (Graphical User Interface) for visualizing spatial data, a C++-based simulation server. These additional features are provided by SimApp [Cline et al., 2000], a CORBA-based framework for spatially-explicit ecological simulations. SimApp is an object-oriented framework for spatially-explicit modeling that combines support for implementing a suite of meta-models in a distributed computing environment via XML and CORBA. This approach allows for a more modular and scalable computing approach that supports using different applications in concert for data visualization, data analysis, and model computation. 4
CONCLUSIONS AND FUTURE WORK
Prior to the coupling of SICS and ALFISHES, the Everglades mangrove zone had been excluded from the ATLSS modeling work in support of CERP. With the incorporation of different water management scenarios from the SFWMM into the bound-
ary conditions for SICS, the combination of SICS and ALFISHES may provide a platform for establishing the link between water management and the viability of key indicator species such as spoonbills.
DeAngelis, D., L. Gross, M. Huston, W. Wolff, D. Fleming, E. Comiskey, and S. Sylvester. Landscape modeling for everglades ecosystem restoration. Ecosystems, 1:64–75, 1998.
The ability to produce reliable projections of both fish abundances and fish availability during the spoonbill nesting season remains a primary objective of the modeling effort. The hydrologic and landscape components developed for ALFISHES may be used to facilitate development or refinement of other models of wildlife populations in the Everglades mangrove zone such as the American crocodile (Crocodylus acutus).
Duke-Sylvester, S. M. and L. J. Gross. Integrating spatial data into an agent-based modeling system: Ideas and lessons from the development of the across-trophic-level system simulation. In Gimblett, H. R., editor, Integrating Geographic Information Systems and Agent-Based Modeling Techniques for Simulating Social and Ecological Processes, pages 125–136. Oxford University Press, Oxford, 2002.
ACKNOWLEDGMENTS Support for this work was provided by the U.S. Geological Survey, Biological Resources Division and Water Resources Division. We particularly appreciate the advice and support of Don DeAngelis. R EFERENCES Carter, V., N. Rybicki, J. Reel, H. Ruhl, D. Stewart, and J. Jones. Classification of Vegetation for Surface-Water Flow Models in Taylor Slough, Everglades National Park. Technical report, U.S. Geological Survey, 430 National Center, Reston, VA 20192, December 1999. Cline, J., F. Guichard, and S. A. Levin. SimApp: an object-oriented framework for spatial simulations with applications to marine metacommunities. PISCO/Mellon Symposium, Corvallis, Oregon, 14-20 December, 18 December 2000. Cline, J. C. and E. D. Swain. Linkage of Hydrologic and Ecological Models: SICS and ALFISHES. on-line, 2002. Second Federal Interagency Hydrologic Modeling Conference, Las Vegas, Nevada, July 28 to August 1, 2002. DeAngelis, D. L., W. F. Loftus, J. C. Trexler, and R. E. Ulanowicz. Modeling fish dynamics and effects of stress in a hydrologically pulsed ecosystem. Journal of Aquatic Ecosystem Stress and Recovery, 6:1–13, 1997. DeAngelis, D. L., S. Bellmund, W. M. Mooij, M. P. Nott, E. J. Comiskey, L. J. Gross, M. A. Juston, and W. F. Wolff. The Everglades, Florida Bay, and Coral Reefs of the Florida Keys: An ecosystem sourcebook, chapter Modeling Ecosystem and Population Dynamics on the South Florida Hydroscape, pages 239–258. CRC Press, Boca Raton, FL, 2002.
Lorenz, J. J. Impacts of water management on Roseate Spoonbills and their piscine prey in the coastal wetlands of Florida Bay. PhD thesis, University of Miami, 2000. Lorenz, J. J., J. C. Ogden, R. D. Bjork, Powell, and G. V. N. Powell. The Everglades, Florida Bay, and Coral Reefs of the Florida Keys: An ecosystem sourcebook, chapter Nesting patterns of Roseate Spoonbills in Florida Bay 1935-1999: implications of landscape scale anthropogenic impacts, pages 563–606. CRC Press, Boca Raton, FL, 2002. Lorenz, J. J. The response of fishes to physicochemical changes in the mangrove of northeast Florida Bay. Estuaries, 22(2B):500–517, September 1999. Nutaro, J. Adevs: A discrete event system simulator, 2001. http://www.ece.arizona.edu/˜nutaro/. OpenGIS Cosortium Inc. Opengis implementation specification: Grid coverage. www, 2001. Pearlstine, L., F. Mazzotti, and D. DeAngelis. A review: Spatially explicit decision support sytems for landscape habitat assessment and restoration, 2004. Submitted. Swain, E. Numerical Representation of Dynamic Flow and Transport at the Everglades/Florida Bay Interface. Technical report, U.S. Geological Survey, 9100 NW 36th St. #107, Miami, FL 33157, December 1999. Swain, E. D., M. A. Wolfert, J. D. Bales, and C. R. Goodwin. Two-dimensional hydrodynamic simulation of surface-water flow and transport to florida bay through the southern inland and coastal systems (sics). Water-Resources Investigations Report 03-4287, U.S. Geological Survey, Tallahassee, Florida, 2004.