Hindawi Publishing Corporation Advances in Computer Engineering Volume 2015, Article ID 261094, 8 pages http://dx.doi.org/10.1155/2015/261094
Research Article Linux Low-Latency Tracing for Multicore Hard Real-Time Systems Raphaël Beamonte and Michel R. Dagenais Computer and Software Engineering Department, Polytechnique Montreal, C.P. 6079, Station Downtown, Montr´eal, QC, Canada H3C 3A7 Correspondence should be addressed to Rapha¨el Beamonte;
[email protected] Received 29 March 2015; Revised 21 July 2015; Accepted 29 July 2015 Academic Editor: Ying-Tung Hsiao Copyright © 2015 R. Beamonte and M. R. Dagenais. This is an open access article distributed under the Creative Commons Attribution License, which permits unrestricted use, distribution, and reproduction in any medium, provided the original work is properly cited. Real-time systems have always been difficult to monitor and debug because of the timing constraints which rule out any tool significantly impacting the system latency and performance. Tracing is often the most reliable tool available for studying real-time systems. The real-time behavior of Linux systems has improved recently and it is possible to have latencies in the low microsecond range. Therefore, tracers must ensure that their overhead is within that range and predictable and scales well to multiple cores. The LTTng 2.0 tools have been optimized for multicore performance, scalability, and flexibility. We used and extended the real-time verification tool rteval to study the impact of LTTng on the maximum latency on hard real-time applications. We introduced a new real-time analysis tool to establish the baseline of real-time system performance and then to measure the impact added by tracing the kernel and userspace (UST) with LTTng. We then identified latency problems and accordingly modified LTTng-UST and the procedure to isolate the shielded real-time cores from the RCU interprocess synchronization routines. This work resulted in extended tools to measure the real-time properties of multicore Linux systems, a characterization of the impact of LTTng kernel and UST tracing tools, and improvements to LTTng.
1. Introduction Tracing is a method to study the runtime behavior of a program’s execution. It consists in recording timestamped events at key points of the execution. Because it can be used to measure latency, tracing is a fundamental tool for debugging and profiling real-time systems. To be suitable for real-time system instrumentation, a tracer must have low-overhead and consistent maximum latency in order to minimize execution timing changes and maintain determinism. The Linux Trace Toolkit next generation (LTTng) is a high performance tracer optimized for Linux. It supports both kernel and userspace tracing with coherent timestamps, which allow observing system-wide execution. The userspace tracing component of LTTng, LTTng-UST, allows instrumenting applications, thus correlating application and kernel events during specific tasks. Earlier results for LTTng-UST show that the maximum tracepoint execution delay is 300 times the average [1]. Our goal was to assess the newer version
of LTTng-UST 2.0 for use in real-time systems. Our contribution consists in a methodology to measure LTTng-UST tracepoint latency characteristics in a real-time environment, the npt open source tool, and modifications to LTTng and CPU shielding configuration to improve its real-time behavior. We set up a real-time environment based on Linux PREEMPT RT and assessed its performance [2]. We then measured the latency distribution in this real-time setup and compared it to results obtained on a regular setup. We developed the Non-Preempt Test (npt) tool to address these specific measurement requirements and thus were able to validate a real-time system and its tracing impact. In addition, we proposed and applied modifications to LTTng-UST in order to lower maximum latency and evaluate its effectiveness. We present related work in Section 2. We detail the test environment and the methodology in Section 3. Baseline results are shown in Section 4 while results obtained with our proposed improvements to LTTng-UST are presented and
2 discussed in Sections 5 and 6. Future work and the conclusion are in Section 7.
2. Related Work This section presents the related work in the two main areas relevant for this paper, real-time systems and software userspace tracing. 2.1. Existing Real-Time Validation Tools. To evaluate the realtime properties of the tracer, timing properties of the test setup must be validated. It consists in measuring latencies induced by the hardware and the operating system. We mainly used the rt-tests suite and related tools to perform the validation. In this section, the different tools corresponding to our needs are presented. 2.1.1. Hardware. Abnormal hardware latencies can occur in misconfigured hardware or hardware unable to do realtime work. To measure these, we used the hwlat detector kernel module [3]. This module uses the stop machine() kernel call to hog all of the CPUs during a specified amount of time [4]. It then polls in a tight loop the CPU timestamp counter (TSC) for a configurable period and looks for the discrepancies in the TSC data. If there is any gap, this means that the polling was interrupted which, in a tight loop in kernel mode with interrupts disabled, could only be a nonmaskable system management interrupt (SMI). SMIs are hardware interrupts used at the CPU level to perform different tasks such as reporting hardware errors and doing thermal throttling or system health checks [5]. The nature of these interrupts causes latencies that are hard to detect. Only an elimination process allows detecting such latencies while running applications. For this reason, we want to avoid SMIs during real-time application work. The hwlat detector kernel module thus allows identifying and rejecting or reconfiguring computers with abnormal hardware latencies. Hwlatdetect is a python script to simplify the use of the hwlat detector module. 2.1.2. Software. Cyclictest is a tool to verify the software real-time performance by running multiple processes on different CPUs, executing a periodic task [6]. Each task can have a different period. The priority of each process can be set to any value up to real time. The performance is evaluated by measuring the discrepancy between the desired period and the real one. The preempt-test tool [7] is also interesting. This tool is not part of the rt-tests suite but was analyzed before the development of the Non-Preempt Test tool presented in Section 4.1. It allows verifying if a higher priority task is able to preempt a lower priority one by launching threads with increasing priorities. It also measures the time it takes to preempt lower priority tasks. 2.2. Existing Software Userspace Tracers. In this section, we present characteristics of currently available software tracers with a userspace component.
Advances in Computer Engineering Some existing implementations of tracers rely on either blocking system calls, string formatting, or achieving thread safety by locking the shared resources for concurrent writers. For example, the logging framework, Poco::Logger, is implemented this way [8]. This category of tracer is slow and unscalable and thus is unsuitable for use in real-time and multicore environment. Feather-trace [9] is a low-overhead tracer implemented with thread-safe and wait-free FIFO buffers. It uses atomic operations to achieve buffer concurrency safety. It has been used to analyze locking in the Linux kernel. However, it does not support variable event size, since the reservation mechanism is based on array indexes. Also, the timestamp source is the gettimeofday() system call, which provides only microsecond precision instead of nanosecond. Paradyn modifies binary executables by inserting calls to tracepoints [10, 11]. The instrumentation can be done at runtime [12] or using binary rewriting in order to reduce the runtime overhead. This technique has been used to monitor malicious code. While the framework offers an extensive API to modify executables, it does not include trace buffer management, event types definition, or trace write mechanisms. Therefore, the missing components must be implemented separately. Perf [13] is a built-in Linux kernel tracer. It was originally designed to access the performance counters in the processors, but its use has since been extended to access the Linux kernel tracepoints. Being bundled with the kernel makes it readily accessible. Perf can be used as a regular tracer but has been optimized for sampling. For instance, perf has a limited multicore scalability for tracing [14]. Sampling is a different technique, which sacrifices accuracy for low average overhead. However, sampling is problematic in real-time systems as, in those systems, the worst-case overhead is the limiting factor, and sampling only gives us information about the average case. More specifically, an interrupt is used to sample data, a significant perturbation for a real-time system. SystemTap is a monitoring tool for Linux [15]. It works by dynamically instrumenting the kernel using Kprobes [16]. It also provides a way to instrument userspace applications using uprobes since Linux kernel 3.8. In both cases, the instrumentation is done in a special scripting language that is compiled to produce a kernel module. The analysis of the data is bundled inside the instrumentation itself and the results may be printed on the console at regular interval. Hence, the analysis is done in flight and there are no facilities, as far as we know, to efficiently serialize raw events to stable storage. Moreover, even if it is possible to determine precise places to put userspace probes to be statically compiled, these probes nonetheless incur an interrupt, just as for the dynamic probes, which is problematic for real-time tracing. LTTng-UST provides macros to add statically compiled tracepoints to a program. Produced events are consumed by an external process that writes them to disk. Unlike Feathertrace, it supports arbitrary event types through the Common Trace Format [17]. The overall architecture is designed to deliver extreme performance. It achieves scalability and waitfree properties for event producers by allocating per-CPU ring-buffers. In addition, control variables for the ring-buffer
Advances in Computer Engineering are updated by atomic operations instead of locking. Moreover, important tracing variables are protected by read-copy update (RCU) data structures to avoid cache-line exchanges between readers occurring with traditional read-write lock schemes [18, 19]. A similar architecture is available at the kernel level. Since both kernel and userspace timestamps use the same clock source, events across layers can be correlated at the nanosecond scale, which is really useful to understand the behavior of an application. LTTng is thus the best candidate to work on real-time tracing. The rest of this paper focuses on LTTng version 2.2 which we used to perform our experiments.
3. Test Environment We used the tools presented previously to validate our test setup. The system consists of an Intel Core i7 CPU 920 2.67 GHz with 6 GB of DDR3 RAM at 1067 MHz and an Intel DX58SO motherboard. Hyperthreading was disabled as it introduces unpredictable delays within cores by sharing resources between threads, both in terms of processing units and in terms of cache. This is something to avoid in real-time systems. As expected, running hwlatdetect to verify the hardware latency did not find any problem; it measured no latencies for a duration of twenty-four hours. The hwlat detector module often allowed us to find unexpected latencies on particular setups in our initial studies. This module thus helped us to choose a computer able to do real-time work. The cyclictest tool was then used to verify the software latency. As the documentation of rt-tests specifies that cyclictest has been developed primarily to be used in a stressed environment, we made the test using rteval. The rteval tool is a python script written to run multiple threads which will load the system and run cyclictest in a separate thread at the same time. It then produces a report giving information about the system tested and the results obtained under load. We fixed portability problems on cyclictest and performed the tests on the two different kernels used in the rest of this paper, the 3.8.13 stable kernel (hereinafter referred to as standard kernel) and the 3.8.13 stable kernel with the rt11 PREEMPT RT patch (hereinafter referred to as PREEMPT RT patched kernel or RT kernel). We chose to do our tests on both these kernels to compare the performance of LTTng in a non-real-time environment versus a hard real-time one. We also expected that if LTTng was able to reach very good performance on a nonoptimized system, it would most likely be able to reach it on a real-time one. Both kernels were compiled with uprobes support to be able to trace with SystemTap as well. Table 1 shows the results of the cyclictest executions run by rteval on these kernels during one hour. These executions have been performed running hackbench [20] and a kernel compilation load (make -j8 to use 8 compilation threads). The cyclictest application was executed with command line arguments, -i100 to set the base interval of the first thread, -m to prevent the memory used by cyclictest
3 Table 1: Results of the Cyclictest executions performed on our standard (std) and PREEMPT RT patched (rt) kernels. CPU core Minimum Average Maximum
0 1 1 2 2 17 8
Latencies in 𝜇s 1 2 1 1 1 1 2 2 2 3 18 16 5 7
3 1 1 2 2 35 5
Kernel type std rt std rt std rt
from being paged out, -p95 to set the priority to real time, and - -smp to activate the standard options to test an SMP system. The results obtained show latencies up to 18 𝜇s for three of the four CPU cores on which cyclictest was running with the standard kernel. The fourth shows a latency about two times higher than the other cores. The results are better on the PREEMPT RT patched kernel. The maximum latency reached is 8 𝜇s, instead of 18 𝜇s on the standard kernel. We also see that the maximum of the processor with the worst latency under the PREEMPT RT patched kernel is lower than the maximum of the processor with the best latency under the standard kernel (almost twice lower). The PREEMPT RT patched kernel should thus be able to handle real-time tasks much better than the standard kernel.
4. Baseline Results In this part, we present the performance of LTTng in our test environment. To do so, we first introduce the Non-Preempt Test tool, developed for this purpose, and then present and discuss our latency results. 4.1. The Non-Preempt Test Tool. One condition we wanted to test was the nonpreemption of a high priority process. To do so, we developed the Non-Preempt Test application or npt. To isolate the effect of different latency sources, the tool can optionally first set up an ideal environment by disabling the interrupt requests (IRQs) (only when compiled with the enable-cli-sti command line option). The IRQs are hardware signals sent to the processor in order to interrupt the running process to run the corresponding handler. Such events can add latency. In our case, we wanted to separate the latencies caused by the rest of the system from those linked to tracing, to be able to analyze the tracer. Even if disabling the IRQs is not mandatory, it allows isolating the factors that can cause unwanted latencies. For this reason, they were disabled for the experiments presented in this paper. The tool then locks the process memory into RAM to prevent it from being swapped (with mlockall). The core of the application loops and calculates the time gap between the start of two consecutive loops, using the rdtsc instruction to get the Time Stamp Counter [21] of the CPU. This is similar to the hwlat detector module in kernel mode. In an ideal situation, this time gap will be very short, just the time to execute the few instructions in the loop.
4
Advances in Computer Engineering
CPUSET “system”
CPUSET “npt”
CPU0
CPU1
System processes
npt
CPUSET “lttng”
CPUSET “idle”
CPU2
CPU3
LTTng
idle
(1) 𝑖 ← 0 (2) 𝑡0 ← read 𝑟𝑑𝑡𝑠𝑐 (3) 𝑡1 ← 𝑡0 (4) tracepoint 𝑛𝑝𝑡𝑠𝑡𝑎𝑟𝑡 (5) while 𝑖 ≤ 𝑙𝑜𝑜𝑝𝑠 𝑡𝑜 𝑑𝑜 do (6) 𝑖←𝑖+1 (7) 𝑑𝑢𝑟𝑎𝑡𝑖𝑜𝑛 ← (𝑡0 − 𝑡1 ) × 𝑐𝑝𝑢𝑃𝑒𝑟𝑖𝑜𝑑 (8) tracepoint 𝑛𝑝𝑡𝑙𝑜𝑜𝑝 (9) CalculateStatistics(𝑑𝑢𝑟𝑎𝑡𝑖𝑜𝑛) (10) 𝑡1 ← 𝑡0 (11) 𝑡0 ← read 𝑟𝑑𝑡𝑠𝑐 (12) end while (13) tracepoint 𝑛𝑝𝑡𝑠𝑡𝑜𝑝 Algorithm 1: Tracepoints in npt.
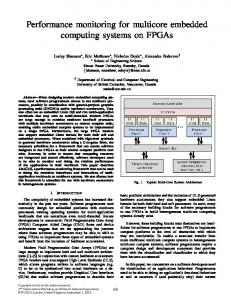
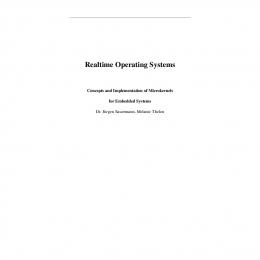
At the end of its execution, npt computes latencies statistics for each loop and generates a histogram showing the different latencies reached and the number of times each one was reached. The npt tool was primarily designed to be executed in a CPU shielded environment, where one or more CPUs are exclusively dedicated to the real-time task. This is highly recommended but not mandatory, as npt automatically asks to be pinned on a specific CPU. Our CPU shielding configuration puts all the system processes on cpu0 and npt on cpu1, as shown in Figure 1. The npt tool version 1.0 was used for the tests presented in this paper. The rdtsc time source is a precise counter and its frequency is fixed. Even in cases where it is not synchronized between cores, this does not affect our experiment because npt is guaranteed to always be scheduled on the same CPU by setting its own CPU affinity (with sched setaffinity). Moreover, this is reinforced by the CPU shielding. In order to reduce the effect of transient state, npt also uses an empty loop to stress the CPU before getting its frequency, as presented in [22]. The frequency can then be recovered from /proc/cpuinfo, which is the default behavior of npt, but we choose to evaluate it for more accuracy (using the eval-cpu-speed command line option). The CPU stress allows removing any effect of the frequency scaling, even if it is not disabled. However, the effect of the Intel Turbo Boost Technology is not managed yet. We finally discard the first five iterations of the benchmark (this number is configurable). The study of the pipeline warm-up latency is beyond the scope of this paper. This tool is ideal to test the performance of the kernel and userspace LTTng tracers as it is easy to extend and add tracepoints in the main loop, while identifying any latency added by the tracer, as shown in Algorithm 1. The session daemon of LTTng is put on cpu2 during the tracing tests, to be CPU independent of npt and the system processes. The session daemon spawns the consumer daemons and thus they will also run on cpu2. 4.2. Latency Results. Figure 2 presents the histograms generated by npt for an execution with 108 loops without tracing.
Number of loops
Figure 1: The cpusets organization for the running tests.
10 8 6 4 2 0
109 108 107 106 105 104 103 102 101
0
1
2
3
4
5
6
7
8
9
10
Latency (𝜇s) Standard Linux kernel Linux kernel with PREEMPT_RT patch
Figure 2: Histograms generated by npt for 108 loops on standard and PREEMPT RT patched kernels.
As we can see, there is no latency peak. These results indicate a good hardware and software basis, thus insuring that any added latency will be caused by the tracer. In order to see the baseline performance of LTTng-UST and SystemTap, we ran npt for 108 loops with each tracer, one after the other, and then compared the results. We started our tests on kernel 3.2 at first, but as SystemTap needs uprobe to trace userspace we then moved to kernel 3.8. This change caused a serious performance regression in LTTng, resulting in dropped events, which we were able to trace to a change in the fadvise system call included in the first 3.8 stable release [23]. We then choose to remove the fadvise call from LTTng for our tests, as it was not necessary in our case. Table 2 shows the data obtained. We can see in the table that the maximum latency of SystemTap is almost twenty times larger than the one of LTTng on a standard kernel and around forty times larger on a PREEMPT RT patched kernel. Moreover, the variance of the results obtained for SystemTap is much larger than the one obtained for LTTng. As the maximum
Advances in Computer Engineering
5 109 108 107 106 105 104 103 102 101
Latencies in ns Standard PREEMPT RT patched Tracer LTTng SystemTap LTTng SystemTap Minimum 270.0 581.6 262.5 911.2 Mean 498.2 777.0 497.6 1028 Maximum 82 180 1 498 000 35 260 1 476 000 Variance 3.620 23.36 4.872 33.74 std deviation 60.17 152.8 69.80 183.7 Kernel
Number of loops
Table 2: Statistics per loop, in nanoseconds, generated by npt for 108 loops on both standard and PREEMPT RT patched kernels for both LTTng-UST 2.2 and SystemTap 2.2.1.
10 8 6 4 2 0
0
1
2
3
4
5
6
7
8
9
10
Latency (𝜇s)
5. Reducing Maximum Latency The results presented in the previous section led us to modify LTTng-UST to create a test version in which the synchronization between the application and the consumer is removed to dissociate the work of npt and LTTng. Instead of using the kernel polling call in the consumer, we first changed it to active polling for the sake of this experimentation. Using active polling, the consumer would continuously check if the buffers were full and thus run at 100% of the CPU. However, with our shielded environment, it would not
Standard Linux kernel Linux kernel with PREEMPT_RT patch
Figure 3: Histograms generated by npt for 108 loops on standard and PREEMPT RT patched kernels with LTTng kernel tracing.
Number of loops
latency and the variance are important values for a real-time application, LTTng is a better choice than SystemTap for this study. Figures 3, 4, and 5 present the generated histograms for executions of npt with 108 loops with, respectively, kernel, UST, and kernel and UST tracers active. We verified that no event was lost for each of the generated traces by using the babeltrace tool, which provides a command line interface to read Common Trace Format (CTF) traces. As we can see, LTTng-UST adds many nondeterministic peaks to the execution of npt, up to 82 𝜇s on the standard kernel and 35 𝜇s on the PREEMPT RT patched one. On both kernels, using kernel tracing alone does not seem to have any impact on the execution of npt. Latency peaks show that the impact is more important on the UST side, likely because there is an UST tracepoint directly added into the loop, therefore slowing it. As these peaks were also visible in the execution of npt with both kernel and UST tracers, we used this trace to analyze the execution of npt on cpu1. Doing so, we identified that, at some point, npt was scheduled out from its CPU, and a lower priority kworker thread was scheduled for a short amount of time, before npt returned back to its execution. This priority inversion was also the occasion for the kernel to do all its pending work, including the RCU interprocess synchronization routines to update and free unused data structures, taking a significant amount of time. This point was in fact the exact moment where the application was using a write call. This call is part of UST and aims to inform the consumer using a nonblocking write call on its control pipe that the current tracing subbuffer in the application is full.
10 8 6 4 2 0
109 108 107 106 105 104 103 102 101
0
10
20
30
40 50 Latency (𝜇s)
60
70
80
Standard Linux kernel Linux kernel with PREEMPT_RT patch
Figure 4: Histograms generated by npt for 108 loops on standard and PREEMPT RT patched kernels with LTTng-UST tracing.
have any impact on the npt execution. This implementation was then improved to a timed polling using a sleep call to relieve the CPU which was running the LTTng-UST consumer. The timed polling, using delays selected between 20 and 200 microseconds, gave results as good as those of the active polling, while avoiding overloading the hosting CPU. For its part, the application (through the UST library) will not contact the consumer anymore to inform it of the subbuffers state. We also discovered that the getcpu call in glibc version 2.13 was not a VDSO function yet and thus was adding latency to LTTng. We upgraded our system to use glibc version 2.16 which corrects this behavior for our tests. After further tests, these LTTng-UST design changes were included in LTTng version 2.2 as a new read-timer command line parameter, after the conference paper introducing them [24]. Without this parameter, LTTng 2.2 has
Advances in Computer Engineering
10 8 6 4 2 0
109 108 107 106 105 104 103 102 101
Number of loops
Number of loops
6
0 10 20 30 40 50 60 70 80 90 100 110 120 130 140 Latency (𝜇s)
10 8 6 4 2 0
109 108 107 106 105 104 103 102 101
0
109 108 107 106 105 104 103 102 101
10
20
30
50 60 40 Latency (𝜇s)
15
20 25 Latency (𝜇s)
30
35
40
70
80
Writer LTTng UST Timer LTTng UST
Figure 7: Histograms generated by npt for 108 loops on a PREEMPT RT patched kernel with writer and timer LTTng-UST tracing.
Number of loops
Number of loops
Figure 5: Histograms generated by npt for 108 loops on standard and PREEMPT RT patched kernels with LTTng-UST and kernel tracings.
0
10
Writer LTTng UST Timer LTTng UST
Standard Linux kernel Linux kernel with PREEMPT_RT patch
10 8 6 4 2 0
5
10 8 6 4 2 0
109 108 107 106 105 104 103 102 101
0
1
2
3
4 6 5 Latency (𝜇s)
7
8
9
10
Standard Linux kernel Linux kernel with PREEMPT_RT patch
Figure 6: Histograms generated by npt for 108 loops on a standard kernel with writer and timer LTTng-UST tracing.
Figure 8: Histograms generated by npt for 108 loops on standard and PREEMPT RT patched kernels with timer LTTng-UST tracing.
the same behavior as LTTng 2.1. Figures 6 and 7 show the difference of added latencies using or not the read-timer command line parameter of LTTng-UST on a standard and a PREEMPT RT patched kernel, respectively. To avoid confusion, we will thereafter use the terms “timer LTTng-UST” when using the read timer mode and “writer LTTng-UST” otherwise. On the standard kernel, the maximum latency is lowered from 82 𝜇s to 7 𝜇s, while on the PREEMPT RT patched kernel it is lowered from 35 𝜇s to 6 𝜇s. If we compare the results of the timer LTTng-UST on both kernels in Figure 8, we can see that, unlike the writer LTTng-UST results shown in Figure 4, these are much more consistent between kernels. Moreover, Table 3 shows the statistics obtained from the execution of npt for the writer and timer designs of LTTng
for comparison purposes. We can see that even if the minimum duration is higher with the timer version for the standard kernel, the maximum duration, the variance, and the standard deviation, which are the most important values in a real-time system, are lower.
6. Real-Time Tracing Limits We have seen in the previous section that the proposed design modification allows us to trace an application with a heavy UST load. However, LTTng still has limits when it comes to tracing the userspace application and the kernel at the same time. In the extreme case where an application would generate tracing events at the maximum rate, in a tight infinite loop, the system may be overwhelmed. In that case, where
Advances in Computer Engineering
7
Table 3: Statistics per loop, in nanoseconds, generated by npt on both standard and PREEMPT RT patched kernels for both writer and timer versions of LTTng-UST. Kernel
Standard
Latencies in ns PREEMPT RT patched
Writer
Timer
Writer
Timer
Minimum Mean Maximum
270.0 498.2 82 180
369.4 424.2 7569
262.5 497.6 35 260
258.0 286.8 6409
Variance std deviation
3.620 60.17
1.063 32.60
4.872 69.80
0.4541 21.31
Number of loops
LTTng-UST 2.2
10 8 6 4 2 0
109 108 107 106 105 104 103 102 101
0
1
2
3
4 5 6 Latency (𝜇s)
7
8
9
10
Standard Linux kernel Linux kernel with PREEMPT_RT patch
Figure 9: Histograms generated by npt for 108 loops on standard and PREEMPT RT patched kernels with timer LTTng-UST and kernel tracing.
Table 4: Millions of tracepoints per second we are able to generate without any drops, in our system, with userspace and kernel tracing active, using 32 subbuffers of 1 MB for UST and 32 subbuffers of 4 MB for the kernel. Kernel Standard PREEMPT RT
All tracepoints 2.0 2.2
Syscalls only 2.4 2.9
events, which will lighten the stress on the storing mechanism of LTTng. We started a series of tests using this new option to find by binary search the number of UST events we could generate per second without discarding any of them. We chose to use 32 subbuffers of 1 MB for the UST trace and 32 subbuffers of 4 MB for the kernel one. The kernel trace was started by enabling all the tracepoints currently available in LTTng-modules 2.2. The kernel was idle during our tests. We also ran our tests using only syscalls tracepoints to lighten the work of the kernel consumer. In real-life situations, one would not use all the kernel tracepoints but choose those which are really useful to the analysis of the behavior of his program. In such situations, as fewer events would be generated on the kernel side, we expect to be able to use a greater tracepoint frequency on the userspace tracing side. The results of these tests are presented in Table 4. For both standard and PREEMPT RT patched kernels, we can see that LTTng is able to support a pretty heavy tracing charge on the userspace side, even when tracing the kernel, allowing tracing very demanding real-time applications. As expected, this charge is higher when using fewer kernel tracepoints.
7. Conclusion and Future Work events cannot be consumed as fast as they are generated, either the generating program should be temporarily blocked or some of the events generated will be dropped. Npt is just such an atypical application doing almost nothing but generating events in a tight infinite loop. Interestingly, when only UST is used, npt on cpu1 generates a maximum volume of tracing data, but the consumer daemon on cpu2 is still able to cope with this very large volume. However, when kernel tracing is added, cpu2 has the added burden of generating kernel tracing data and consuming this additional tracing data and becomes overwhelmed. In this latest case, even if we can reach latencies as low as 6 𝜇s, as shown in Figure 9, the UST part of the tracer drops many events, giving the priority to the kernel trace. Since it is useful to have a trace with both correlated tracers (userspace and kernel), we wanted to know what is the maximum charge our setup can handle without dropping events. In most cases, a trace without any discarded events has more value than a trace with discarded ones. To measure the maximum load, we added a new tracepoint maximum frequency command line parameter to the npt tool, allowing limiting the maximum number of times a tracepoint will be called per second. This test aims to restrain the frequency of
We have presented the effects of tracing with LTTng on both standard and PREEMPT RT patched Linux kernels by using the Non-Preempt Test (npt) application. We changed the way the userspace instrumented application interacts with LTTng userspace tracer (UST) to reduce and improve the determinism of the added latency. Our results were promising and thus integrated upstream in the new LTTng 2.2 release, allowing us to lower the maximum latencies to 7 𝜇s for the standard kernel and 6 𝜇s for the PREEMPT RT patched one when using only userspace tracing. We also were able to determine the stress limits of LTTng when tracing both userspace and kernel by limiting the UST tracepoints frequency. We believe that LTTng has a great potential for tracing real-time systems. Therefore, we are viewing the real-time work described in this paper as the beginning of a larger project. We intend to pursue our investigations to find if we can lower even more the LTTng latency and create new test cases in npt to be able to evaluate more easily a real-time system and its real-time behavior. The latest version of npt can be obtained from http://git.dorsal.polymtl.ca/?=npt.git. Another feature of LTTng that could be useful for realtime applications tracing is being developed to take snapshot
8
Advances in Computer Engineering
traces, allowing only storing the trace events in the vicinity of an identified problem. [13]
Disclosure This work represents the views of the authors and does not necessarily represent the view of Polytechnique Montreal. Linux is a registered trademark of Linus Torvalds. Other company, product, and service names may be trademarks or service marks of others.
Conflict of Interests The authors declare that there is no conflict of interests regarding the publication of this paper.
[14]
[15]
[16] [17]
[18]
Acknowledgments This research is supported by OPAL-RT, CAE, the Natural Sciences and Engineering Research Council of Canada (NSERC), and the Consortium for Research and Innovation in Aerospace in Qu´ebec (CRIAQ).
[19]
[20]
References [1] M. Desnoyers and M. R. Dagenais, “The LTTng tracer: a low impact performance and behavior monitor for GNU/Linux,” in Proceedings of the Linux Symposium, vol. 1, pp. 209–224, Ottawa, Canada, July 2006. [2] N. Litayem and S. Ben Saoud, “Impact of the linux real-time enhancements on the system performances for multi-core intel architectures,” International Journal of Computer Applications, vol. 17, no. 3, pp. 17–23, 2011. [3] The hwlat detector module documentation, November 2011, https://www.kernel.org/pub/linux/kernel/projects/rt/2.6.33/ patch-2.6.33.9-rt31. [4] Stop machine.h, https://git.kernel.org/cgit/linux/kernel/git/stable/linux-stable.git/tree/include/linux/stopmachine.h?id=v3.8.13. [5] K. Mannthey, Running without Systems Management Interrupts, 2009, http://linuxplumbersconf.org/2009/slides/KeithMannthey-SMI-plumers-2009.pdf. [6] Cyclictest, 2012, https://rt.wiki.kernel.org/index.php/Cyclictest. [7] Preemption Test, 2012, https://rt.wiki.kernel.org/index.php/ PreemptionTest. [8] Applied Informatics Software Engineering GmbH, POCO C++ Libraries, 2012, http://pocoproject.org/. [9] B. Brandenburg and J. Anderson, “Feather-trace: a light-weight event tracing toolkit,” in Proceedings of the 3rd International Workshop on Operating Systems Platforms for Embedded RealTime Applications, pp. 61–70, July 2007. [10] B. P. Miller, M. D. Callaghan, J. M. Cargille et al., “The paradyn parallel performance measurement tool,” IEEE Computer, vol. 28, no. 11, pp. 37–46, 1995. [11] A. R. Bernat and B. P. Miller, “Anywhere, any-time binary instrumentation,” in Proceedings of the 10th ACM SIGPLANSIGSOFT Workshop on Program Analysis for Software Tools (PASTE ’11), pp. 9–16, ACM, Szeged, Hungary, September 2011. [12] R. Wism¨uller, M. Bubak, W. Funika, and B. Bali´s, “A performance analysis tool for interactive applications on the grid,”
[21]
[22]
[23]
[24]
International Journal of High Performance Computing Applications, vol. 18, no. 3, pp. 305–316, 2004. J. Edge, “Perfcounters added to the mainline,” 2009, http://lwn .net/Articles/339361/. M. Desnoyers, “A new unified Lockless Ring Buffer library for efficient kernel tracing,” 2010, http://www.efficios.com/pub/linuxcon2010-tracingsummit/presentation-linuxcon-2010-tracingmini-summit.pdf. F. C. Eigler, “Problem solving with systemtap,” in Proceedings of the Linux Symposium, vol. 1, pp. 261–268, Ottawa, Canada, July 2006. R. Krishnakumar, “Kernel korner: kprobes—a kernel debugger,” Linux Journal, vol. 2005, no. 133, p. 11, 2005. M. Desnoyers, Common Trace Format (CTF) Specifications, 2011, http://git.efficios.com/?p=ctf.git;a=blob;f=common-traceformat-specification.md. P. E. McKenney and J. Walpole, “Introducing technology into the linux kernel: a case study,” ACM SIGOPS Operating Systems Review, vol. 42, no. 5, pp. 4–17, 2008. M. Desnoyers, P. E. McKenney, A. S. Stern, M. R. Dagenais, and J. Walpole, “User-level implementations of read-copy update,” IEEE Transactions on Parallel and Distributed Systems, vol. 23, no. 2, pp. 375–382, 2012. C. Williams and D. Sommerseth, “Manpage for hackbench,” http://man.cx/hackbench(8). Intel Corporation, IntelR 64 and IA-32 Architectures Software Developer’s Manual, 253669-033US, Intel Corporation, Santa Clara, Calif, USA, 2009. A. Thankashan, “High Performance Time Measurement in Linux,” 2010, http://aufather.wordpress.com/2010/09/08/highperformance-time-measuremen-in-linux/. M. Gorman, “mm/fadvise.c: drain all pagevecs if POSIX FADV DONTNEED fails to discard all pages,” February 2013, https://git.kernel.org/cgit/linux/kernel/git/stable/linux-stable. git/commit?id=bb01afe62feca1e7cdca60696f8b074416b0910d. R. Beamonte, F. Giraldeau, and M. Dagenais, “High performance tracing tools for multicore linux hard real-time systems,” in Proceedings of the 14th Real-Time Linux Workshop (OSADL ’12), Chapel Hill, NC, USA, October 2012.
International Journal of
Rotating Machinery
Engineering Journal of
Hindawi Publishing Corporation http://www.hindawi.com
Volume 2014
The Scientific World Journal Hindawi Publishing Corporation http://www.hindawi.com
Volume 2014
International Journal of
Distributed Sensor Networks
Journal of
Sensors Hindawi Publishing Corporation http://www.hindawi.com
Volume 2014
Hindawi Publishing Corporation http://www.hindawi.com
Volume 2014
Hindawi Publishing Corporation http://www.hindawi.com
Volume 2014
Journal of
Control Science and Engineering
Advances in
Civil Engineering Hindawi Publishing Corporation http://www.hindawi.com
Hindawi Publishing Corporation http://www.hindawi.com
Volume 2014
Volume 2014
Submit your manuscripts at http://www.hindawi.com Journal of
Journal of
Electrical and Computer Engineering
Robotics Hindawi Publishing Corporation http://www.hindawi.com
Hindawi Publishing Corporation http://www.hindawi.com
Volume 2014
Volume 2014
VLSI Design Advances in OptoElectronics
International Journal of
Navigation and Observation Hindawi Publishing Corporation http://www.hindawi.com
Volume 2014
Hindawi Publishing Corporation http://www.hindawi.com
Hindawi Publishing Corporation http://www.hindawi.com
Chemical Engineering Hindawi Publishing Corporation http://www.hindawi.com
Volume 2014
Volume 2014
Active and Passive Electronic Components
Antennas and Propagation Hindawi Publishing Corporation http://www.hindawi.com
Aerospace Engineering
Hindawi Publishing Corporation http://www.hindawi.com
Volume 2014
Hindawi Publishing Corporation http://www.hindawi.com
Volume 2014
Volume 2014
International Journal of
International Journal of
International Journal of
Modelling & Simulation in Engineering
Volume 2014
Hindawi Publishing Corporation http://www.hindawi.com
Volume 2014
Shock and Vibration Hindawi Publishing Corporation http://www.hindawi.com
Volume 2014
Advances in
Acoustics and Vibration Hindawi Publishing Corporation http://www.hindawi.com
Volume 2014