history-based confidence estimator we present in this pa- ... to load value prediction, is keeping a small history re- ...... [DEC92] Digital Equipment Corporation.
Load Value Prediction Using Prediction Outcome Histories Martin Burtscher and Benjamin G. Zorn Technical Report CU-CS-873-98 Department of Computer Science University of Colorado Boulder, Colorado 80309-0430 {burtsche, zorn}@cs.colorado.edu Abstract Due to their occasional very long latency, load instructions are among the slowest instructions of current highperformance microprocessors. Unfortunately, their long latency also delays the execution of all the dependent instructions, which can significantly affect system performance. Load value prediction alleviates this problem by allowing the CPU to speculatively continue processing without having to wait for the memory access to complete. Today’s load value predictors can only correctly predict about 40 to 70 percent of the load instructions. Confidence estimators are employed to estimate how likely a prediction is to be correct and to keep the predictor from making a (probably incorrect) prediction if the confidence is below a preset threshold. Despite its simplicity, the adaptive prediction outcome history-based confidence estimator we present in this paper outperforms other proposed mechanisms and reaches average prediction accuracies over SPECint95 in excess of 99%, even with small predictor sizes. A detailed pipeline-level simulation shows that a load value predictor equipped with our confidence estimator not only outperforms other predictors by more than 65% when a re-fetch misprediction recovery policy is used, but is also the only predictor that yields a genuine speedup for all eight SPECint95 programs.
1. Introduction Due to their occasional long latency, load instructions have a significant impact on system performance. If the gap between CPU and memory speed continues to widen, the load latency will become even longer. Since loads are also among the most frequently executed instructions [LCB+98], improving their execution speed should significantly improve the overall performance of the CPU. Most load instructions tend to fetch the same values repeatedly. For example, about half of all the load in-
structions of SPECint95 retrieve the same value that they did the previous time they were executed. This behavior is referred to as value locality [LWS96, Gab96]. Context-based load value predictors try to exploit the value locality. For instance, a very simple predictor could always predict the previously loaded value. We named this scheme Basic LVP (last value predictor). To reduce the number of mispredictions, load value predictors normally consist of two main parts: a value predictor that predicts a value based on previously loaded values and a confidence estimator (CE), which decides whether or not to make a prediction using the predicted value. All previously proposed predictors and our own contain these two parts in some form. Nevertheless, to our knowledge, we are among the first to use this nomenclature. The CE only allows predictions to take place if the confidence that the prediction will be correct is high. This is important because sometimes the value predictor does not contain the right information to make a correct prediction. In such a case, it is better not to make a prediction because incorrect predictions slow down the processor more than making no prediction at all. Most CEs allow some variability in setting the confidence level above which predictions will be attempted. Setting this threshold to a higher level increases the probability that the attempted predictions will be correct (higher accuracy) but at the same time results in more missed opportunities for making correct predictions (lower coverage). CEs are similar to branch predictors because both have to make binary decisions (predict or don’t-predict and branch taken or not-taken, respectively). One very successful idea in branch prediction, which is also applicable to load value prediction, is keeping a small history recording the most recent prediction outcome (success or failure) [SCAP97]. The intuition is that the past prediction behavior tends to be very indicative of what will happen next. For example, if a prediction was successful the last few times, there is a good chance that it will be successful again. Hence, the prediction-outcome history,
Load Value Prediction Using Prediction Outcome Histories
as we termed it, represents a measure of confidence. If load values are predicted quickly and correctly, the CPU can process the dependent instructions without having to wait for the memory access to complete, which potentially results in a significant performance increase. Of course it is only known whether a prediction was correct once the true value has been retrieved from memory, which can take many cycles. Speculative execution allows the CPU to continue execution with a predicted value before the prediction outcome is known [SmSo95]. Because branch prediction requires a similar mechanism, most modern CPUs already contain the necessary hardware to perform this kind of speculation [Gab96]. However, using branch misprediction recovery hardware for load value mispredictions causes all the instructions that follow a misspeculated instruction to be purged and re-fetched. This is a very costly operation and makes a high prediction accuracy paramount. Unlike branches, which invalidate the whole execution path if mispredicted, mispredicted loads only invalidate the instructions that depend on the loaded value. In fact, even the dependent instructions per se are correct, they just have to be re-executed with the correct input value(s). Consequently, a better recovery mechanism for load misspeculation would only re-execute the instructions that depend on the mispredicted load value. Such a recovery policy is less susceptible to mispredictions and favors a higher coverage, but may be prohibitively hard to implement [GrPa98]. In this paper we present our load value predictor which uses a prediction outcome history-based confidence estimator. Such histories retain which of the last s predictions were correct and which were not. Saturating up/down counters are utilized to continuously adjust which history patterns should cause a prediction and which ones should not. Predictions are only made if the counter value that is associated with the current history pattern is above a preset threshold. The predicted value is always the value that was previously loaded by the same load instruction. Our predictor reaches an average speedup over SPECint95 of 16.0% with a re-execute and 14.1% with a refetch recovery policy. It is able to attain a speedup for all the SPECint95 programs, even when the much simpler refetch mechanism is employed. All the other predictors we looked at slow down at least four of the eight benchmark programs with a re-fetch policy, as our pipelinelevel simulations show. Section 6.2 provides more detailed results. The remainder of this paper is organized as follows: Section 2 introduces the predictor components. Section 3 presents related work. Section 4 illustrates how to use prediction outcome histories for confidence estimation. Section 5 explains the methods. Section 6 presents the results. Section 7 concludes the paper with a summary.
Burtscher & Zorn
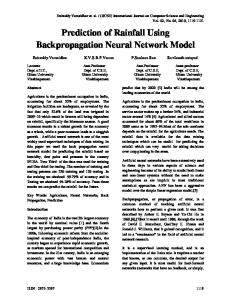
2. Predictor architecture Figure 2.1 shows the elements of a confidence-based load value predictor. The largest component is an array (cache) of 2n lines for retaining confidence information and previously fetched values. The hashing hardware is used to generate an n-bit index out of the load instruction’s address (and possibly other processor state information). Finally, the decision logic computes whether a prediction should be made based on the confidence information. Generic Predictor with Confidence Estimator instruction address
conf. info.
previous value(s)
· · ·
· · ·
n-bit hash-func index
s bits
n
2 cache lines
64-bit value
decision
logic
predicted value predict/don't predict 1-bit
Figure 2.1: The components of a load value predictor with a confidence estimator (shaded).
All the predictors in this paper use PC div 4 mod 2n as a hash-function1. Better hash-functions probably exist. However, an investigation thereof is beyond the scope of this paper. When a prediction needs to be made, the hash-function computes an index to select a cache line. The value stored in the selected line (or one of the stored values if there are multiple) becomes the predicted value, and the decision logic decides whether a prediction should be attempted with this value. Once the outcome of a prediction is known, the corresponding confidence information field is updated to reflect the outcome, and the value in the cache line that was used for making the prediction is replaced by the true load value. We propose keeping prediction outcome histories as a measure of confidence. Our decision logic contains saturating counters, one per history pattern, to count the number of times each pattern has recently been followed by a �� 7KH� GLY� �� HOLPLQDWHV� WKH� WZR� OHDVW� VLJQLILFDQW� ELWV� ZKLFK� DUH� DO� ZD\V� ]HUR� VLQFH� WKH� SURFHVVRU� ZH� XVH� UHTXLUHV� LQVWUXFWLRQV� WR� EH DOLJQHG�
2
TR CU-CS-873-98
Load Value Prediction Using Prediction Outcome Histories
successful prediction. Predictions are only allowed for those histories whose count is currently above a preset threshold.
4. Using prediction outcome histories In addition to tags and saturating counters, the branch prediction literature also describes histories that record the recent prediction successes and failures as a very successful idea [SCAP97]. We found this to be true in the domain of load value prediction as well. In fact, prediction outcome histories (as we call them) significantly outperform tags and saturating counters, as Section 6.1 illustrates. To better explain how such histories can be used as a measure of confidence, we present Table 4.1, which shows the output of a 4-bit history run based on SPECint95 behavior. For instance, the second row of the table states that a failure, failure, failure, success history (denoted by 0001) is followed by a successful last value prediction 26.9% of the time. In this history, success denotes the outcome of the most recent prediction. Of all the encountered histories, 2.7% were 0001. Note that it is not necessary to make a prediction following every history with a greater than 50% probability of resulting in a correct prediction. Rather, the optimal setting depends on the characteristics of the CPU the prediction is going to be made on. If a small cost is associated with making a misprediction (re-execute), it is probably wiser to predict a larger number of load values, albeit also a larger number of incorrect ones. If, on the other hand, undoing speculative operations takes a long time and should therefore be avoided (re-fetch), it makes more sense not to predict quite as many loads but to be confident that the ones that are predicted will most likely be correct.
3. Related work Lipasti et al. [LWS96] describe an untagged last value predictor (which predicts the previously fetched load value) to exploit the existing load value locality. Their predictor utilizes saturating up/down counters as confidence estimators. In Section 6.2, we compare our predictor to this one. Gabbay’s dissertation proposal [Gab96] introduces a tagged last value predictor and a tagged stride predictor (which predicts the previously fetched load value plus an offset). Both predictors use the tags as confidence estimators. Load instructions, as opposed to other types of instructions, exhibit virtually no stride behavior [Gab96]. Therefore, we exclude the stride predictor from our comparison since we feel that the extra hardware to store the strides is not cost effective. Wang and Franklin [WaFr97] are the first to propose a multi-value predictor. It saves the last four distinct load values per line and uses the pattern of the last six accesses as index into an array of saturating up/down counters for confidence estimation. It has the highest prediction accuracy of all the predictors currently in the literature. Nevertheless, our predictor considerably outperforms theirs when a re-fetch misprediction recovery policy is used, as the comparison in Section 6.2 shows. Sazeides and Smith describe a context-based two level value predictor [SaSm97]. Given the current on-chip L1 cache sizes, we find the amount of hardware their predictor requires to perform well unreasonably large. Hence we do not include this predictor in our comparison. In the area of branch prediction, a significant amount of related work exists. Lee and Smith [LeSm84] propose keeping a history of recent branch directions and systematically analyze every possible history pattern. Yeh and Patt [YePa92, YePa93] describe sets of twolevel branch predictors and invent a taxonomy to distinguish between them. We adopt one of their designs for use as a confidence estimator in our load value predictor (Section 4.1). Sprangle et al. [SCAP97] describe a technique called agree prediction, which records whether the previous branch predictions were a success or a failure rather than whether the branches were taken or not. We use the same approach in our predictor. The most directly related work in the area of branch prediction is recent work by Jacobsen et al. [JRS96] and Grunwald et al. [GKMP98] on branch confidence estimation. This work explores the same issue we do, i.e., whether to predict or not, in the context of branches.
Burtscher & Zorn
SPECint95 Last Value Predictability history predictability occurance 0000 6.9 32.2 0001 26.9 2.7 0010 19.1 2.9 0011 49.9 1.6 0100 34.3 2.9 0101 33.6 1.9 0110 44.9 1.3 0111 59.4 2.2 1000 24.2 2.7 1001 46.3 1.8 1010 66.8 1.9 1011 66.1 1.9 1100 53.1 1.6 1101 57.2 1.9 1110 52.3 2.2 1111 96.6 38.3
Table 4.1: Average predictability and occurrence split up by history pattern. The predictability signifies the percentage of last value predictable loads following the given prediction outcome histories. The occurrence denotes how often the respective history pattern was encountered.
Initially, we built a predictor that is preprogrammed with the history patterns that should cause a prediction using tables like Table 4.1 [BuZo98]. For example, if we
3
TR CU-CS-873-98
Load Value Prediction Using Prediction Outcome Histories
want such a predictor to be highly confident that its predictions are correct, say 96.6% confident, it would be programmed to only allow predictions for histories that have a predictability of greater than or equal to 96.6%, that is, only for history 1111 in our example. This threshold would result in 38.3% of all loads being predicted (of which 96.6% would be correct for our benchmark suite). With longer histories, even higher accuracies and more correct predictions can be attained. While this predictor already outperforms other predictors [BuZo98], it cannot adapt to changing program behavior. To remedy this shortcoming, we decided to augment the predictor with saturating counters, which dynamically decide which histories should cause a prediction. It is the resulting load value predictor that we present in this paper.
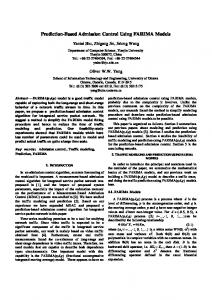
shifted into the prediction outcome history of the selected cache line and the oldest bit is shifted out (lost). If the true value is equal to the value in the cache, a one is shifted in, otherwise a zero is shifted in. Finally, the value in the cache is replaced by the true value. We also tried only replacing the value in the cache if the confidence is low, but we found always replacing to work best in all cases. We decided to use a direct-mapped cache since we empirically observed few conflicts with moderate cache sizes. While this might be an artifact of our benchmarks, even much larger programs will not create significantly more conflicts as long as their active working set of load instructions does not exceed the capacity of the cache. Note that, unlike instruction and data caches, predictor caches do not have to be right all the time. Hence, neither tag nor valid bits are a requirement. We decided to omit both since having them would only result in an almost immeasurable increase in accuracy, which we believe does not justify the extra hardware. The array of counters effectively represents a second level of indirection. However, performing two table lookups per cycle should be feasible since current branch predictors also comprise two levels.
4.1 The SAg Last Value Predic tor Our adaptive load value predictor consists of a last value predictor (LVP) and a prediction outcome historybased confidence estimator. The histories are stored in the confidence information field of the cache-lines (see Figure 4.1). Since our confidence estimator is similar to Yeh and Patt’s SAg branch predictor [YePa93], we call our predictor SAg LVP.
5. Methodology
SAg Predictor instruction address
outcome history
last value
· · ·
· · ·
All our measurements are performed on the DEC Alpha AXP architecture [DEC92]. To obtain the actual load values, we instrumented the binaries using the ATOM tool-kit [EuSr94, SrEu94], which allows us to elegantly simulate the proposed predictor in software and to easily change its parameters. While such an approach is very flexible and relatively fast, it does not capture operating system code and other applications that might be running at the same time. For our detailed pipeline-level simulations we use the Superscalar back-end of AINT [Pai96]. It is configured to emulate a processor similar to the DEC Alpha 21264 [KMW98]. In particular, the simulated CPU has a 128entry instruction window, four integer and two floating point units, a fetch and issue bandwidth of four, a 64kB 2way set associative L1 instruction-cache, a 64kB 2-way set associative L1 data-cache, a 4MB unified directmapped L2 cache, and a 4096-entry BTB. Otherwise, the modeled microprocessor is identical to the one described in [GrPa98].
n-bit bits(2..n+1) index
s-bit history array of s 2 t-bit saturating up/down counters
n
2 cache lines
64-bit value
predicted value · · > th? t-bits
predict/don't predict 1-bit
Figure 4.1: The components of our SAg last value predictor. The SAg confidence estimator is shaded.
Predictions are performed as described in Section 2, i.e., a prediction is made if the value of the counter associated with the current load instruction’s prediction outcome history is above the preset threshold. Once the outcome of a prediction is known, the corresponding saturating counter is incremented if the prediction was correct, otherwise it is decremented. Then a new bit is
Burtscher & Zorn
5.1 Benchmarks We use the eight integer programs of the SPEC95 benchmark suite [SPEC95] for our measurements. These programs are well understood, non-synthetic, and compute-intensive, which is ideal for processor performance
4
TR CU-CS-873-98
Load Value Prediction Using Prediction Outcome Histories
measurements. They are also quite representative of desktop application code, as Lee et al. found [LCB+98]. Table 5.1 gives relevant information about the SPECint95 programs. We use the larger ref-inputs and the more optimized peak-versions of the programs (compiled using DEC GEM-CC with -migrate -std1 -O5 -ifo -g3 -non_shared). The binaries are statically linked. This enables the linker to perform additional optimizations, which considerably reduce the number of run-time constants that are loaded during execution. These optimizations include most of the optimizations that OM [SrWa93] performs. All programs are run to completion. The result is approximately 87.8 billion executed load instructions per ATOMsimulation. Note that the few floating point load instructions contained in the binaries are also measured, that loads to the zero-registers are ignored since they do not yield a result, and that load immediate instructions are not taken into account since they do not access the memory and therefore do not need to be predicted.
in “fast execution” mode. gcc is executed to completion (334 million instructions). Table 5.1 shows the number of instructions that we skipped. The numbers were determined by investigating where the last value predictability becomes representative for the rest of the program.
5.2 Metrics for load value pred ictors The ultimate metric for comparing load value predictors is of course the speedup attained by incorporating a given predictor into a CPU. Unfortunately, speedups are dependent on the architectural features of the underlying CPU. Consequently, non-implementation specific metrics are also important. A value predictor with a confidence estimator can produce four prediction outcomes: correct prediction, incorrect prediction, correct non-prediction, and incorrect nonprediction. We denote the number of times each of the four cases is encountered by PCORR, PINCORR, NPCORR, and NPINCORR, respectively. To make the four numbers independent of the total number of executed load instructions, they are normalized so that their values sum to one.
Information about the SPECint95 Benchmark Suite total executed load load sites that account for skipped program load instructions sites Q50 Q90 Q99 Q100 inst (M) compress 10,537 M (17.5%) 3,961 17 58 81 690 6,000 gcc 80 M (23.9%) 72,941 870 5,380 14,135 34,345 0 go 8,764 M (24.4%) 16,239 204 1,708 4,221 12,334 12,000 ijpeg 7,141 M (17.2%) 13,886 42 187 423 3,456 1,000 li 17,792 M (26.7%) 6,694 42 138 312 1,932 4,000 m88ksim 14,849 M (17.9%) 8,800 52 216 456 2,677 1,000 perl 6,207 M (31.1%) 21,342 44 169 227 3,586 1,000 vortex 22,471 M (23.5%) 32,194 57 585 3,305 16,651 5,000 average 10,980 M (21.8%) 22,007 166 1,055 2,895 9,459
Normalization: PCORR + PINCORR + NPCORR + NPINCORR = 1
Unfortunately, the four numbers by themselves do not represent adequate metrics for comparing predictors. For example, it is not clear if predictor A is superior to predictor B if predictor A has both a higher PCORR and a higher PINCORR than predictor B. Instead, we use standard metrics for confidence estimation, which have recently been adapted to and used in the domain of branch prediction and multi-path execution [JRS96, GKMP98]. To our knowledge, we are the first to use these standard metrics in the domain of load value prediction. They are all higher-is-better metrics.
Table 5.1: The number of load instructions contained in the binaries (load sites) and executed by the individual programs (in millions) of the SPECint95 benchmark suite when using the ref-inputs. The numbers in parentheses denote the percentage of all executed instructions that are loads. The quantile columns show the number of load sites that contribute the given percentage (e.g., Q50 = 50%) of executed loads. The rightmost column shows the number of instructions (in millions) that are skipped before starting the detailed pipeline-level simulation.
• Potential: POT = PCORR + NPINCORR
An interesting point to note is the uniformly high percentage of load instructions executed by the programs. About every fifth instruction is a load. This is in spite of the high optimization level and good register allocation. Another interesting point is the relatively small number of load sites that contribute most of the executed load instructions. For example, less than 5% of the load sites make for 90% of the executed loads. Only 43% of the load sites are executed at all. In these benchmarks, an average of 52.3% of the load instructions fetch the same value that they did the previous time they were executed and 69.5% fetch a value that is identical to one of the last four distinct values fetched. For the speedup measurements, we executed the benchmark programs on our simulator for 300 million instructions after having skipped over the initialization code
Burtscher & Zorn
• Accuracy: ACC =
PCORR PCORR + PINCORR
• Coverage:
PCORR PCORR = PCORR + NPINCORR POT
COV =
The POT represents the fraction of predictable values, which is a property of the value predictor alone and is independent of the confidence estimator. However, if the potential is low, even a perfect confidence estimator is unable to make many correct predictions. The ACC represents the probability that a prediction is correct. The COV represents the fraction of predictable values identified as such. Together they describe the quality of the confidence estimator. The accuracy is the
5
TR CU-CS-873-98
Load Value Prediction Using Prediction Outcome Histories
more important metric, though, since a high accuracy translates into many correct predictions (which save cycles) and few incorrect predictions (which cost cycles), whereas a high coverage translates into better utilization of the existing potential. Note that ACC, COV, and POT fully determine PCORR, PINCORR, NPCORR, and NPINCORR given that they are normalized.
Note that we performed a much broader investigation of the parameter space but cannot include all the results. We picked Figure 6.1 and Figure 6.2 because they are quite representative of the generally observed behavior. Both fewer and more than four bits per counter results in decreased CE performance. Apparently, 4-bit counters provide the best hysteresis. SAg CE-Results for Different History Sizes (2048 Entries, 4-bit Counters) 100
6. Results
95
The following subsections list the results: Section 4.1 presents our predictor. Section 6.1 evaluates its performance. In Section 6.2 we compare our predictor to a number of predictors from the literature. Note that, for improved readability, several figures in these subsections are not zero-based.
Coverage
90 2 bits 85
4 bits 6 bits 8 bits
80
10 bits 12 bits 14 bits
75
6.1 SAg confidence estimator r esults
70
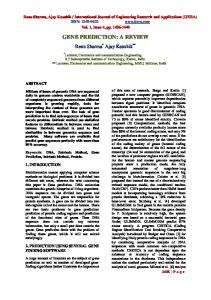
Figure 6.1 shows the accuracy-coverage pairs that our SAg confidence estimator can attain (by varying the threshold between one and 15) for different cache sizes when ten-bit histories and four-bit counters are used. The numbers are averages over the eight SPECint95 programs. Values closer to the upper right corner are better. Before every run, all cache entries are set to zero. Hardly surprising, larger predictors perform better. However, it is also visible that both the performance of the CE and the delivered potential start saturating above about 2048 entries.
70
90 Coverage
90
95
100
This section compares several load value predictors: a Basic LVP (without confidence estimator), a Tagged LVP [Gab96], a Bimodal LVP [LWS96], our SSg LVP [BuZo98], a Last Distinct 4 Values predictor [WaFr97], and the SAg LVP. We also look at increasing the datacache size as an alternative to adding a load value predictor. To make the comparison between the predictors as fair as possible, all are allowed space to hold 2048 values plus whatever else they require to support this size. This results in approximately 19 kilobytes of state, which we find reasonable given that the DEC Alpha 21264 processor incorporates two 64kB L1 caches on chip [KMW98]. Table 6.1 shows the hardware cost of the six predictors in number of state bits and lists their potential.
95
128 entries (34.4%) 256 entries (39.9%) 512 entries (44.9%) 1024 entries (48.0%) 2048 entries (49.9%)
75
85 Accuracy
6.2 Predictor comparison
SAg CE-Results for Different Predictor Sizes (10-bit Histories, 4-bit Counters)
80
80
Figure 6.2: Accuracy-coverage pairs for different history sizes, 2048-entry caches, and four-bit counters. Each dot corresponds to a threshold (one through 15).
100
85
75
4096 entries (51.1%) 8192 entries (51.7%)
70 70
75
80
85 Accuracy
90
95
100
Hardware Cost and Potential of several 2048-entry Predictors state bits rel. cost potential Basic LVP 131072 0.0 % 49.85 % Tagged LVP (19-bit tags) 169984 29.7 % 49.85 % Bimodal LVP (3-bit counters) 137216 4.7 % 49.85 % Last Distinct 4 Values 217600 66.0 % 48.41 % SSg LVP (10-bit histories) 151552 15.6 % 49.85 % SAg LVP (10 hbits, 4 cbits) 155648 18.8 % 49.85 %
Figure 6.1: Accuracy-coverage pairs for different cache sizes, ten-bit histories, and four-bit counters. Each dot corresponds to a threshold (one through 15). The numbers in parentheses denote the potential of the respective load value predictor.
Figure 6.2 is similar to the previous figure except now the cache size is held constant at 2048 entries and the length of the histories is varied. Again, longer histories perform better. Saturation sets in at about ten bits.
Burtscher & Zorn
Table 6.1: Hardware cost in number of state-bits and the potential of various load value predictors. The relative cost denotes the cost above Basic LVP, i.e., the cost of the confidence estimator.
6
TR CU-CS-873-98
Load Value Prediction Using Prediction Outcome Histories
The Basic LVP requires the smallest number of state bits (sum of counter, cache, history, tag, and valid bits). Since Alphas are 64-bit machines, every value in the cache counts as 64 bits. Consequently, the Basic LVP requires 131,072 bits of storage. This is our base case. The Tagged LVP augments the Basic LVP with a tag per cache line. If we assume a 4GB address space, the tags have to be 19 bits long for a 2048-entry cache. This scheme requires 29.7% more storage than the base case. Predictions are only made if the tag matches and after each prediction the value and the tag are updated. The Bimodal LVP incorporates a 3-bit saturating up/down counter per line. McFarling named this scheme Bimodal [McF93]. We found 3-bit counters and always updating the values to work the best. Predictions are only made if the counter value is greater or equal to a preset threshold, which can be varied between one and seven. This scheme requires only 4.7% additional hardware. In spite of this marginal increase, it performs a great deal better than the first two schemes, including the more hardware intensive one. The Last Distinct 4 Values predictor is rather complex and stores the last four distinct load values per line, so the cache had only 512 lines. The bit count for this scheme is 66.0% over the base case. It incorporates 4-bit saturating up/down counters as part of the confidence estimator. The counters saturate at twelve [WaFr97], which limits the possible threshold values to one through twelve. The SSg LVP is 15.6% larger than the base case when 10-bit histories are used. The 10-bit SAg LVP is slightly larger due to the additional 1024 4-bit counters. It requires 18.8% more hardware than the base case. The counters allow threshold values between one and 15.
cache lines and consequently more aliasing, in particular with the smaller 1024-entry configuration. Confidence Estimator Comparison (1024 Entries) 100 95 90
Coverage
85 80 75 70
SAg 10-bit histories SAgrz 10-bit histories
65
SSg 10-bit histories LD4VP (256 entries)
60
Bimodal 3-bit counters 55 50 70
80
85 Accuracy
90
95
100
Figure 6.3: Accuracy-coverage pairs of several confidence estimators with 1024-entry caches. The dots correspond to various thresholds. Confidence Estimator Comparison (8192 Entries) 100 95 90
Coverage
85 80 75 SAg 10-bit histories 70
SAgrz 10-bit histories SSg 10-bit histories
65
LD4VP (2048 entries) Bimodal 3-bit counters
60 55 50 70
75
80
85
90
95
100
Accuracy
6.2.1 Confidence estimator compar ison Figure 6.3 and Figure 6.4 show how the confidence estimators of different predictors perform with a small (1024 entries) and a large (8192 entries) configuration, respectively. Note that Basic and Tagged are not visible. Their coverage is about 100%, but their accuracy is only about 50%. SAg and SAgrz are identical except that the counter values are reset to zero (rz) with the SAgrz upon a misprediction rather than being decremented by one. With ten history bits, our CEs outperform all other CEs. We take this as evidence that prediction outcome histories are indeed better suited for load value prediction than other approaches. All the predictors benefit from an increase in size. However, measurements with infinite cache-sizes show that the 8192-entry results are near the limit for all predictors and that our predictor maintains its superiority. LD4VP benefits the most from going from 1024 entries to 8192 entries. This is because LD4VP stores four values per cache line, which results in four times fewer
Burtscher & Zorn
75
Figure 6.4: Accuracy-coverage pairs of several confidence estimators with 8192-entry caches. The dots correspond to various thresholds.
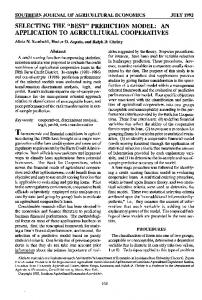
6.2.2 Speedup results Figure 6.5 shows the speedups we measured using a detailed pipeline simulation of a microprocessor similar to the DEC Alpha 21264 (see Section 5). The displayed results are average speedups over SPECint95. The results are given for both a re-fetch and a reexecute misprediction recovery policy. For predictors that allow multiple threshold values, the result of the configuration with the best average speedup is listed (and thus represent simulation results of over one hundred configurations). The thresholds that yield the highest average speedup are seven (out of seven) for the Bimodal LVP using re-fetch and five using re-execute, 86% for SSg with re-fetch and 65% with re-execute [BuZo98], and twelve (out of twelve) for LD4VP both for re-fetch and re-execute.
7
TR CU-CS-873-98
Load Value Prediction Using Prediction Outcome Histories
Even though SAg outperforms SAgrz (Figure 6.3 and Figure 6.4), it does not reach the high accuracies that are necessary when a re-fetch policy is utilized. Consequently, we use the SAgrz LVP with re-fetch and the SAg LVP with re-execute. The thresholds that yield the highest average speedup are eleven (out of 15) for the SAg LVP and 15 (out of 15) for the SAgrz LVP.
Speedup of Individual SPECint95 Programs with a Re-fetch Policy 30 25
LD4VP
5
16.4
15.8
vortex
perl
m88ksim
li
go
-10
16.0 14.1
13.1
ijpeg
-5
compress
0
Average Speedup over SPECint95
14.1
SAgrz LVP
10
gcc
Speedup (%)
15
20
15
Bimodal LVP
20
re-fetch
-15
re-execute -20 Speedup (%)
10
8.7
8.5
Program
7.4
7.0
Figure 6.6: Speedup results of the individual programs that yield the best average speedup when a re-fetch misprediction recovery mechanism is used. The percentages for m88ksim are 75.0%, 68.7%, and 78.3% for Bimodal LVP, LD4VP, and SAgrz LVP, respectively.
5 1.4 1.4
0 Basic LVP
Tagged LVP
Bimodal LVP
LD4VP
SSg LVP
SAg(rz) LVP
doubling L1
-5
-10
7. Summary and conclusions
Predictor
Figure 6.5: Average speedups of the eight SPECint95 programs on a DEC Alpha 21264-like processor (the cut-off negative re-fetch speedup percentages are -35.5% for Basic, and -32.2% for Tagged).
In this paper we describe a novel confidence estimator for load value predictors. It uses histories of the recent prediction outcomes to decide whether or not to attempt a prediction. Saturating counters are used to determine which history patterns should be followed by a prediction. Our confidence estimator reaches much higher accuracies than tag and saturating-counter-based confidence estimators, and, combined with a simple last value predictor, it significantly outperforms previously proposed predictors when a re-fetch misprediction recovery policy is used and almost reaches the performance of the best predictor that we are aware of with a re-execute policy. We conclude that prediction outcome histories are very well suited for the domain of load value prediction since they outperform other approaches, including considerably more complex ones. With a re-fetch misprediction recovery mechanism, which all processors that support branch prediction already incorporate, our predictor outperforms other predictors from the literature by 65% and yields an average speedup of 14.1% over SPECint95. We believe that the simplicity and the relative low hardware cost combined with its superior performance make our predictor a prime candidate for integration into next generation microprocessors.
With a re-execute policy, Bimodal LVP and LD4VP perform quite well. The SAg LVP outperforms Bimodal and almost reaches the performance of the significantly more complex LD4VP. Given the results of the previous section, we can only attribute LD4VP’s superior performance to the fact that it keeps four values per line rather than having four times as many lines holding one value. With the simpler re-fetch mechanism, our SAg LVP outperforms all the other predictors by at least 65% (not counting the SSg LVP). Most of today’s CPUs already contain re-fetch hardware, which makes re-fetch the more likely recovery mechanism in the near future. Despite the positive average speedups of some of the predictors, they all actually slow down at least half of the benchmark programs when re-fetch is utilized as Figure 6.6 illustrates. Only our predictor is able to deliver a genuine speedup for all the benchmark programs. The rightmost column in Figure 6.5 denotes the speedup resulting from doubling the processor’s L1 datacache. Despite this hardware increase of 564,224 statebits, the resulting speedup is very small. Some of the predictors outperform the doubled cache tenfold while requiring only one fourth of the hardware. Doubling the L1 data-cache reduces its load miss-rate from 2.5% to 1.2%. Obviously, there is not much potential for improvement left. We can only conclude that above a certain cache size, it makes more sense to add a load value predictor than to increase the cache size.
Burtscher & Zorn
Acknowledgments This work was supported in part by the Hewlett Packard University Grants Program (including Gift No. 31041.1) and the Colorado Advanced Software Institute. We would like to especially thank Tom Christian for his support of this project and Dirk Grunwald and Abhijit Paithankar for providing and helping with the simulator.
8
TR CU-CS-873-98
Load Value Prediction Using Prediction Outcome Histories
[SaSm97]
References [BuZo98]
M. Burtscher, B. G. Zorn. Profile-Supported Confidence Estimation for Load-Value-Prediction. Technical Report CU-CS-872-98, University of Colorado at Boulder. October 1998.
[DEC92]
Digital Equipment Corporation. Alpha Architecture Handbook. 1992.
[EuSr94]
A. Eustace, A. Srivastava. ATOM: A Flexible Interface for Building High Performance Program Analysis Tools. WRL Technical Note TN-44, Digital Western Research Laboratory, Palo Alto. July 1994.
[Gab96]
F. Gabbay. Speculative Execution Based on Value Prediction. EE Department Technical Report #1080, Technion - Israel Institute of Technology. November 1996.
Y. Sazeides, J. E. Smith. Implementations of Context Based Value Predictors. Technical Report ECE-97-8, University of Wisconsin-Madison. December 1997.
[SCAP97] E. Sprangle, R. Chappell, M. Alsup, Y. Patt. “The Agree Predictor: A Mechanism for Reducing Negative Branch History Interference”. 24th Annual International Symposium of Computer Architecture, 284-291. 1997. [SLM95]
S. Sechrest, C. C. Lee, T. Mudge. “The Role of Adaptivity in Two-level Adaptive Branch Prediction”. 28th International Symposium on Microarchitecture. 1995.
[SPEC95] SPEC CPU’95. August 1995. [SmSo95] J. E. Smith, G. S. Sohi. “The Microarchitecture of Superscalar Processors”. Proceedings of the IEEE. 1995. [SrEu94]
A. Srivastava, A. Eustace. “ATOM: A System for Building Customized Program Analysis Tools”. ACM SIGPLAN ’94 Conference on Programming Language Design and Implementation. ACM SIGPLAN 29(6):196-205. June 1994.
D. Grunwald, A. Paithankar. A Comparison of the Benefits of Dependence Prediction and Value Prediction. In Preparation.
[SrWa93]
E. Jacobsen, E. Rotenberg, J. Smith. “Assigning Confidence to Conditional Branch Predictions”. 29th International Symposium on Microarchitecture. December 1996.
A. Srivastava, D. Wall. “A Practical System for Intermodule Code Optimization at Link-time”. Journal of Programming Languages 1(1):1-18. March 1993.
[WaFr97]
[KMW98] R. E. Kessler, E. J. McLellan, D. A. Webb. “The Alpha 21264 Microprocessor Architecture”. To appear in 1998 International Conference on Computer Design. October 1998.
K. Wang, M. Franklin. “Highly Accurate Data Value Prediction using Hybrid Predictors”. 30th Annual ACM/IEEE International Symposium on Microarchitecture. December 1997.
[YePa92]
T. Y. Yeh, Y. N. Patt. “Alternative Implementations of Two-level Adaptive Branch Prediction”. 19th Annual International Symposium of Computer Architecture, 124-134. May 1992.
[YePa93]
T. Y. Yeh, Y. N. Patt. “A Comparison of Dynamic Branch Predictors that use Two Levels of Branch History”. 20th Annual International Symposium of Computer Architecture, 257-266. May 1993.
[GKMP98] D. Grunwald, A. Klauser, S. Manne, A. Pleszkun. “Confidence Estimation for Speculation Control”. 25th International Symposium on Computer Architecture. June 1998. [GrPa98]
[JRS96]
[LCB+98] D. C. Lee, P. J. Crowley, J. J. Baer, T. E. Anderson, B. N. Bershad. “Execution Characteristics of Desktop Applications on Windows NT”. 25th International Symposium on Computer Architecture. June 1998. [LeSm84] J. K. F. Lee, A. J. Smith. “Branch Prediction Strategies and Branch Target Buffer Design”. IEEE Computer 17(1):6-22. January 1984. [LWS96]
M. H. Lipasti, C. B. Wilkerson, J. P. Shen. “Value Locality and Load Value Prediction”. Seventh International Conference on Architectural Support for Programming Languages and Operating Systems, 138-147. October 1996.
[McF93]
S. McFarling. Combining Branch Predictors. TN 36, DEC-WRL. June 1993.
[Pai96]
A. Paithankar. AINT: A Tool for Simulation of Shared-Memory Multiprocessors. Master’s Thesis, University of Colorado at Boulder. 1996.
Burtscher & Zorn
9
TR CU-CS-873-98