1Department of Radiology, Royal Melbourne Hospital, Melbourne, Victoria, ... To characterize these differences in arrival time, we fit all concentration time ...
Local Arterial Input Function in Bolus Tracking Using Data Defined Vascular Territories S. Christensen1,2, N. Hjort2, P. Desmond1, L. Ostergaard2, and F. Calamante3 Department of Radiology, Royal Melbourne Hospital, Melbourne, Victoria, Australia, 2CFIN, Aarhus university hospital, Aarhus, NA, Denmark, 3Brain Research Institure, Melbourne, Victoria, Australia
1
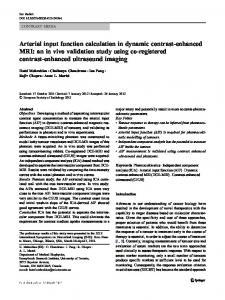
Introduction: Bolus tracking MRI is a widely used technique for routine clinical assessment of cerebral hemodynamics in acute stroke. It has been shown that dispersion of the arterial input function (AIF) in the feeding arteries introduces systematic errors in the CBF and MTT estimates tending to exaggerate the severity of the perfusion deficit [1]. Dispersion is believed to be particularly frequent in stroke due to delayed collateral blood supply arriving via multiple pathways. Several methods have been proposed to determine local AIFs in the vicinity of the tissue they supply [2,3,4,5]. These methods first detect likely local AIFs candidates and subsequently assign an AIF to each voxel based on a weighted average of the local AIFs in the vicinity (by spatial smoothing); as such, they rely on the assumptions that a segment of tissue if fed mainly by the local AIF that is closest to it spatially. Ideally, tissue segments should be assigned local AIFs that indeed feed the tissue, but this information is not immediately available due to limited spatial resolution of the MRI acquisition. We here propose a method where similarities in bolus profile are used to define functional segments of tissue (small branch vascular territories) believed to be fed by the same local AIF. A local AIF map is thus generated by assigning each segment to the local AIF it is believed to be supplied by. Methods: The arrival time of an instantaneous, infinitely sharp bolus will be increasing as it travels towards more distal sites in the vascular tree. The high flow velocities in the larger arteries impede measurement of arrival time differences along the arteries using current sampling times and SNR, but experimental evidence suggests that differences in arrival times exist in the periphery of the arterial tree that are within the realm of measurement [6,7]. To characterize these differences in arrival time, we fit all concentration time curves (CTCs) to a gamma-variate function as is frequently used. The T0 parameter from these fits is theoretically a direct estimate of tracer arrival, but in practice simulations show that the precision of the T0 estimate is low at experimental SNR levels. The First Moment of the fitted CTC is a more robust measure of arrival time, albeit assuming that the tissue residue function is similar between neighboring voxels. Extending previous methods [7] we propose that the route of slowest ascent of the First Moment value from any given voxel to each local maximum can be used to identify the more likely supplier: neighboring voxels that are connected by vasculature are more likely to have similar arrival times than neighboring voxels that are supplied by different branches. This local maximum is then identified as the local AIF and all voxels tracking back to it are grouped as belonging to that AIF effectively assigning that AIF to all voxels in that group. Figure 1 shows an example of the resulting map of start and endpoints in patient 2. Heuristic criteria of area and smooth shape are used to quality control the detected local AIFs; territories with AIFs deemed invalid are in stead assigned the AIF of the nearest neighboring territory. All local AIF areas are normalized to unit area to avoid partial volume bias and the resulting AIF map is used for voxel-by-voxel deconvolution. For comparison, the analysis was also performed using a standard global AIF. The method was applied to 2 acute stroke patients using sequence parameters: Gradient echo EPI at 3T; TR =1.5 s, TE=45 ms. Matrix size 128x128, voxels dimensions of x=y=1.875, z=5 mm, gap size of 1.5 mm. Time to scan after stroke onset was 127 and 63 minutes respectively. Delay insensitive circular deconvolution was used for both global and local AIF derived MTT estimates respectively. Results: Figure 2 shows global and local AIF derived MTT maps as well as the MTT difference maps (MTTglobal AIF-MTTlocal AIF). The proposed method resulted in lower MTT values (higher CBF) in the area of hemodynamic disturbance (see the difference maps) which is the expected result when minimizing AIF dispersion using local AIFs. Row 4 in the figure illustrates that the AIFs determined in the areas of hemodynamic disturbance are indeed more dispersed than their contralateral counterparts. Most pronounced in patient 2, some regions also displayed a higher MTT estimate (dark regions in the difference maps) using the proposed local AIF method; this would translate into the automatic local AIF detecting less dispersed AIF curves for some regions than the manually selected global AIF. Discussion: The proposed method is to the best of our knowledge the first attempt to generate local AIF maps using vascular territories defined by the bolus tracking data itself. With current spatial and temporal resolution it is not possible to completely characterize vascular territories using this technique due to the high flow speeds in the larger arterial branches. The data indicates that only the pathway from tissue to the nearest supplying larger artery can be found, but this limitation is compatible with what is required from a local AIF technique, i.e. the nearest supplying artery. Conclusion: The proposed method shows promise in allowing for local AIFs that are assigned to tissue based on a data-defined vascular territory map. Using more accurate local AIFs can potentially improve characterization of the tissue at risk in stroke allowing for more accurate predictions of tissue destined for infarction. Figure 1: Line rendering between start points and ending points for all voxels superimposed on a co-registered structural MRI. The endpoints correspond to arteries and the local AIFs are extracted at these locations. Each voxel can then be assigned a local AIF that it was tracked back to. This image is illustrates an in-slice tracking only. Notice the almost completely symmetric patterns in the unaffected posterior territories bilaterally that is consistent with arterial anatomy. The colormap displays for each vascular segment its average first moment value. References: [1] Calamante et al.; Magn Reson Med. 2000 Sep;44(3):466. [2] Knutsson L. et al. J Magn Reson Imaging. 2006 Apr;23(4):444. [3] Lorenz C. et al.; J Magn Reson Imaging. 2006 Jul;24(1):57. [4] Calamante F. et al.; Magn Reson Med. 2004 Oct;52(4):789. [5] Alsop D. et al, ISMRM Proc. 2002; p659. [6] Thacker et al.; J Magn Reson Imaging. 2003 Feb;17(2):241. [7] Christensen et al. ISMRM Proc. 2006; p813.
Proc. Intl. Soc. Mag. Reson. Med. 15 (2007)
Figure 2: MTT maps for two patients’ generated using contra laterally selected global AIF (row 1) and local AIF (row 2). ). Row three shows the difference map, where brighter intensity indicates that the local AIF yielded a lower MTT estimate. Row four shows the local AIF identified in the area of hemodynamic disturbance ipsi- (red) and contra (green) laterally respectively. The ROIs are overlaid onto the AIF map as seen during an early (upstroke) phase.
591