ANNALS OF GEOPHYSICS, 54, 2, 2011; doi: 10.4401/ag-5034
Long time-series of chemical and isotopic compositions of Vesuvius fumaroles: evidence for deep and shallow processes Stefano Caliro1,*, Giovanni Chiodini1, Rosario Avino1, Carmine Minopoli1, Berardino Bocchino1 1 Istituto Nazionale di Geofisica e Vulcanologia, sezione di Napoli, Osservatorio Vesuviano, Naples, Italy
Article history Received December 20, 2010; accepted May 3, 2011. Subject classification: Vesuvius, Hydrothermal system, Geochemical monitoring, Stable isotopes. 1999 seismic crisis, seismic activity decreased to low levels, with shallow hypocenters mainly clustered within the volcanic edifice [Del Pezzo et al. 2004]. The degassing area of the Vesuvius crater is characterized by the presence of fumarolic vents that are sited on the crater rim and at the bottom of the crater (Figure 1). Fumarolic fluids discharged by these fumaroles on the crater rim are of relatively low temperatures (2.5 km underneath Vesuvius [Chiodini et al. 2001]. More recently, this partial derivation of CO2 from decarbonation processes was confirmed by petrological considerations regarding the process of carbonate assimilation
permeable products of the Vesuvius cone. Because of this heavy air contamination, these fumaroles are not indicative of the deep system and they have not been considered for the elaboration of the conceptual geochemical model. In contrast, the crater bottom fumaroles discharge fluids hat are representative of the deep systems: H2O and CO2 are the major components, followed by H2, H2S, N2, CH4, CO and He (in order of decreasing content). Excluding minor possible contamination during the sampling, air is absent (N2/Ar generally >200). The discharge temperatures, of about 95 ˚C, are close to the saturation temperature of steam for the fumarolic fluids at the crater altitude. Fumarolic gases do not show any detectable SO2, HCl, and HF, due to the scrubbing of magmatic gases within the hydrothermal system. In the following we report and discuss the conceptual geochemical model of these fumaroles (Figure 2) that was elaborated by Chiodini et al. [2001], and that is here assumed as the reference model for the interpretation of the chemical 139
CALIRO ET AL.
Figure 3. Chronogram of the CO2 contents of the B1 rim fumarole during the 1998-2010 period.
2. Materials and methods This study is based on the compositional data of fumaroles B1 (crater rim) and FC2 (crater bottom) the locations of which are shown in the map in Figure 1. Although there are other fumarolic vents in the crater area that have been analyzed occasionally, we have limited the discussion here to the FC2 and B1 fumaroles, for which a continuous time-series of chemical and isotopic compositions is available. In particular, we used 88 chemical analyses, and analyzed 72 oxygen isotopic compositions, and 61 hydrogen isotopic compositions of the steam condensate of the FC2 fumarolic vent, and 79 chemical analyses of B1 fumarole, which were collected periodically from 1998 to 2010 in the framework of volcanic surveillance of the Campanian volcanoes. Gas samples for the determination of the chemical compositions of FC2 fumarole were collected in 200 ml glass vials under-vacuum, which were equipped with a Teflon stopcock fixed with a rubber O-ring, which contained a 4 N NaOH solution [Giggenbach 1975, Giggenbach and Gouguel 1989]. Dry gas samples were collected for determination of CO concentrations. Condensates of water vapor and noncondensable gases were sampled by flowing the fumarolic gases through a condenser cooled at 20 ˚C to 30 ˚C by water. The chemical compositions of the gases and the isotopic compositions of the CO2 were analyzed at the geochemistry laboratory of INGV-Osservatorio Vesuviano. The gas constituents were analyzed following the methods of Cioni and Corazza [1981], as modified for the analysis of He, Ar, O2, N2, H2 and CH4. The chemical compositions of these nonabsorbed gases that were mainly present in the headspace over the NaOH solution were measured by gas chromatography, through a unique injection on two molecular-sieve columns (MS 5Å capillary, 30 m × 0.53 mm × 50µm; He and Ar were the carrier gases) using TCD detectors. The carbon dioxide and sulfur species absorbed in the alkaline
by the Vesuvius magma [Iacono Marziano et al. 2009]. To derive indications of the temperature–pressure conditions of the hydrothermal system, Chiodini et al. [2001] considered gas equilibria in the CO2-CH4-CO-H2-H2O gas system in the presence of NaCl brines. In particular, fH2O, the fugacity of water, and the vapor–liquid distribution coefficients Bi were considered to be controlled by the presence of either 3 m NaCl solutions or halite saturated brines. For the FC2 fumarole, i.e. one that is regularly monitored and is considered in the present study, equilibrium temperatures were 445 ±9 ˚C considering 3 m NaCl solutions, and 429 ±8 ˚C for the halite-saturated brine. Such high equilibration temperatures were confirmed by the individual CO/CO2, H2/H2O, and CH4/CO2 ratios, by the H2-H2S-H2O and H2-N2-NH3-H2O gas equilibria, and by the H2-Ar geoindicator [Chiodini et al. 2001]. In addition, similar high temperatures (450-500 ˚C) were confirmed on the basis of the C-isotopic exchange between CH4 and CO2 [Fiebig et al. 2004], leaving little uncertainty of the thermal state of the Vesuvius hydrothermal system. Due to the uncertainty of the salt content of the hydrothermal liquid, the estimation of total fluid equilibrium pressure (Ptot = PH2O + PCO2) varies from 260 bar, in the case of halite saturation, to 480 bar, for 3 m NaCl solutions [Chiodini et al. 2001]. Considering a hydrostatic regime, the deepest hydrothermal reservoir might be located at depths of roughly 2.5 km to 5.0 km, within the carbonate sequence, which is present at depths >2.5 km underneath Vesuvius [Berrino et al. 1998]. It is worth noting that the estimated depths of the deepest hydrothermal reservoir roughly coincide with the major frequency distribution of the hypocenter of earthquakes recorded in the 1995-1999 period [Saccorotti et al. 2002], suggesting a possible relationship between these. In particular, Saccorotti et al. [2002] proposed that the seismic activity at Vesuvius is triggered by diffusion of a pressure front, which is possibly associated with the degassing process of the hydrothermal system. 140
LONG TIME-SERIES OF VESUVIUS FUMAROLES
solution were analyzed after oxidation via H2O2, and by acidbase titration and ion chromatography, respectively (analytical error, ±3%). Because of the reaction in alkaline solution to form COOH− [Giggenbach and Matsuo 1991], CO was analyzed for dry gas samples, using gas-chromatography separation with a MS 5Å capillary (30 m × 0.53 mm × 50 µm); He was used as carrier gas, using a TCD detector. Some isotopic analyses (data from 1996 to 2002) of oxygen and hydrogen (water) were performed at the Geochemistry Laboratory of INGV-Palermo, using a Finnigan Delta plus mass spectrometer. Oxygen isotopic compositions were measured after equilibration with CO2 at 25 ˚C [Epstein and Mayeda 1953], H was measured after reduction with Zn [Coleman et al. 1982], and C after cryogenic purification of CO2 (analytical errors: dD ±1‰, d18O ±0.1‰ and d13C ±0.1‰). Isotopic data since 2003 were performed at the Geochemistry Laboratory of INGVOsservatorio Vesuviano, using a Finnigan Delta plusXP continuous flow mass spectrometer coupled with a GasbenchII device (analytical errors,: dD ±1‰, d18O ±0.08‰ and d13C ±0.06‰). Gas samples for the determination of the chemical compositions of B1 fumarole were collected in 20 mL glass vials that were equipped with a Teflon stopcock fixed with a rubber O-ring, by flowing the fumarolic gases through a condenser cooled at 20 ˚C to 30 ˚C with water. The dry gas was analyzed by gas chromatography, through a unique injection on two columns (Molecular Sieve 5 Å capillary 30 m × 0.53 mm × 50 µm, and Hysep Q packed 90´ × 1/4´) using He as the carrier gas on the columns and TCD detectors. The analytical data are reported in the electronic Annex 1. 3. Time-series of the chemical and isotopic compositions of the fumaroles during 1998-2010 3.1. Time-series of the rim fumarole B1 The B1 fumarole is fed by air that is variably contaminated by CO2 of deep origin, as suggested by some of the data on the carbon isotopic composition (d13CCO2 = ~−0.7‰) that are close to the values measured in the crater bottom fumaroles (generally from −0.5‰ to 0.7‰) that are not affected by air contamination. The CO2 concentration is thus representative of the relative contribution of the deep component. The chronogram of Figure 3 shows that over time the CO2 content of this fumarole is scattered, probably because the amount of air that enters the fumarolic conduits is controlled by variable meteorological conditions, such as the wind and atmospheric pressure. In spite of this dispersion that is caused by secondary processes, the chronogram shows a general decreasing trend in CO2, which can be interpreted as a decrease in the time of the flux of the deep component.
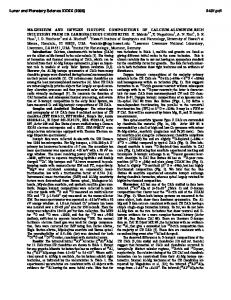
Figure 4. Time-series of selected parameters: a) d18OH2O; b) dDH2O; c) CO2/H2O; d) CO2/CH4; and e) He/CO2 measured at fumarole FC2 over the 1998-2010 period. The isotopic compositions of the fumarolic water (4a and 4b) are characterized by an annual cycle, while the long-period variations affect the CO2/H2O, CO2/CH4 and He/CO2 ratios characterized by an unique peak in 2002.
3.2. Time-series of the FC2 crater bottom fumarole Time-series of selected parameters (d18OH2O, dDH2O, CO2/H2O, CO2/CH4, He/CO2) that were measured at the FC2 fumaroles during 1998-2010 are reported in the chronograms of Figure 4. Figure 4 highlights the occurrence of compositional variations of different frequencies: shortperiod variations are typical of the stable isotopes of the 141
CALIRO ET AL.
condensation, the isotopic fractionation causes the formation of a liquid that is enriched in heavy isotopes (18O and deuterium [D]), which leaves a residual vapor of a lighter isotopic composition. This process explains why during the winter season, when condensation is enhanced, the fumarole discharge fluids are characterized by lighter isotopic compositions. These effects of condensation have been modeled using two different approaches. The first approach (model A) considers only the fractionation due to the condensation of the steam at boiling point. In more detail, we computed the dD, d18O compositions of the vapor remaining after condensation (the residual vapor) for different fractions of condensation, in a multi-step process. Considering the fractionation factors between liquid and vapor at 94.5 ˚C (1000lnal-v = 30.14 and 5.30 for D and 18O) [Horita and Wesolowski 1994], the isotopic compositions are computed at each step by:
condensates, which show an evident annual cycle (Figure 4a,b), while the CO2/H2O, CO2/CH4 and He/CO2 ratios are affected by long-period variations that are characterized by a unique peak value, which is positive for He and CO2 and negative for CH4, and which occurred in 2002 (Figure 4c-e). This annual cycle that characterizes the water isotopic composition testify to the occurrence of shallow processes that are linked in some way to seasonal effects, while the behavior of the gas species might be caused by some deep variations in the system that feeds the fumaroles. 3.2.1. Shallow processes The d18O values of steam condensates range from −10‰ to −5‰, while their dD values range from −57‰ to −18‰, with both showing a marked annual cycle (Figure 4a,b). This annual cycle is more evident through examination of Figure 5, where the values are plotted against the months of sampling. Both the oxygen and hydrogen isotopic compositions show sinusoidal trends that are characterized by minimum values from December to February, while the maxima are reached from June to August, indicating strong seasonal control of the isotopic composition of the fumarolic water. A possible process that might cause such seasonal variations is seen in the partial condensation of the fluids within the fumarolic conduits, a process that in winter will be enhanced by the lower ambient temperatures, and/or by the infiltration of cold meteoric water and melted snow. This condensation is a plausible process, because both the relatively low flow rate of the fumarole and its discharge temperature (mean, 94.2 ˚C) are close to the boiling temperature (94.5 ˚C, at this specific altitude). During
d Do
= ^ 1 - yh # dDr + y # ^ dDr + 1000lnal - vh
(1)
= dDo - ^ y # 1000lnal - vh
(2)
d Dr d 18 Oo
= ^ 1 - yh # d18 Or + y # ^ d18 Or + 1000lnal - vh (3) d 18 Or
= d18 Oo - ^ y # 1000lnal - vh
(4)
where the subscripts o and r refer to the original and the residual vapors, and y is the fraction of steam condensed at each step. In this exercise, the starting vapor was selected as that of the fumarolic composition characterized by a heavier isotopic composition (sample of 22/08/2007: d18O = −5.58‰, dD = −20.84‰), which is considered as representative of a noncondensed sample. Although, this assumption is not entirely constrained by the data, the possible choice of a more positive isotopic composition for the original fluid would be purely speculative. The theoretical compositions of the residual vapor, i.e. of the vapor remaining after condensation, are reported in Figure 6, as the "model A" line. This model does not explain the measured compositions that are systematically enriched in 18O, with respect to the condensation line. This systematic deviation is explained by the contemporary occurrence of oxygen exchange between CO2 and steam during the condensation. Chiodini et al. [2000] demonstrated that in fumarolic gas this process is fast enough to allow rapid isotopic re-equilibration of fumarolic fluids at their discharge temperatures, within a wide temperature range (100–1,000 ˚C). In particular, 52 samples where the oxygen isotopic compositions in both H2O and CO2 were measured show d18OCO2 - d18OH2O differences (36‰ ±1‰) that are close to the theoretical fractionation at 95 ˚C (34.1‰). For this reason, the second model (Figure 6, "model B") takes into account the occurrence of oxygen exchange
Figure 5. d18O and dD values of steam condensates versus the months of sampling. More depleted samples (in heavy isotopes) characterize the wintry months, indicating strong seasonal control of the isotopic composition of fumarolic water.
142
LONG TIME-SERIES OF VESUVIUS FUMAROLES
roughly evaluated at 0.3–0.4, by comparing the theoretical and measured data. In principle, the same trend of the fumarolic dD-d18O values can be explained by other more complex processes, such as mixing of the deep hydrothermal fluids (either vapor or liquid) with cold groundwaters, formation of mixed parent liquids, and separation of equilibrated vapors [Giggenbach and Stewart 1982, Henley and Stewart 1983, Chiodini et al. 2001, Federico et al. 2010]. These processes possibly occur in peripheral areas of the hydrothermal systems, where meteoric waters can interact with the deep fluids, causing the formation of mixtures at lower temperatures, with respect to the undiluted original fluids. These processes are unlikely to occur at Vesuvius, where gas equilibria indicate almost constant and high temperature and pressure values. In contrast, the simplest condensation model that is proposed here for the first time is based on processes that are both directly observable at the fumarole (i.e. condensation) and demonstrated by analytical measurements (i.e. isotopic equilibrium between oxygen in water and in CO2; see above). The removal of water from fumarolic fluids by condensation implies a concurrent increase in the relative concentration of the incondensable gas, which should show an annual cycle similar to that of the water isotopes. In this case, however, the occurrence of evident long-term variations, as highlighted in Figure 4c-e, can hide the eventual annual variations. For example, the CO2 content of the fumaroles shows a clear decreasing trend from 1998 to 2010. We tried to de-trend the CO2 chronogram by adding the residual of the linear regression of CO2 versus time to the mean CO2 value (see Figure 4c). The de-trended values, which are plotted against the months of sampling in Figure 7, show an annual
Figure 6. Plot of dD vs. d18O of the fumarolic condensates (fumarole FC2). Condensation models under near discharge conditions (94.5 ˚C) are also reported, with the parent fluid sample of 22/08/2007. Model A refers to simply multistep steam condensation, while model B refers to multistep steam condensation that takes into account the oxygen isotopic exchange between CO2 and water vapor during the process. The good fitting of the analytical and theoretical (model B) data support the possible occurrence of this process.
between CO2 and steam during the condensation. Practically, this more complex condensation model is based on the solution of the isotopic mass-balance for the oxygen in the H2O + CO2 system, which can be written as: d 18 Otot
= ^ d18 Or + 1000lnaCO2 - vh # |CO2 - v + d18 Or # # |v + ^ d 18 Or + 1000lnal - vh # |l
d 18 Or
(5)
= d18 Otot - ^ 1000lnaCO2 - v # 1000lnal - v # |lh (6)
where d18Otot is the oxygen isotopic composition in the CO2 + H2O system before the condensation, |CO2, |v and |l are the oxygen atom fractions for CO2, vapor and liquid water in the CO2 + H2O system, and 1000lnaCO2-v = 34.20 is the CO2-H2Ovapour oxygen fractionation factor computed at 94.5˚C using the equation of Richet et al. [1977]. The oxygen atom fractions are given by: = 2XCO2 ^ 2XCO2 + XH2Oh
(7)
= y # XH2O ^ 2XCO2 + XH2Oh
(8)
= ^ 1 - yh # XH2O ^ 2XCO2 + XH2Oh
(9)
|CO2 |l |v
The relatively good fit of the measured points with model B suggests that the annual 18O and D variability observed at the Vesuvius fumaroles is mainly due to condensation processes, which are more efficient during the cold seasons. The fraction of condensed steam can be
Figure 7. CO2 de-trended contents of the FC2 fluids (see text) versus the months of sampling. A cyclical annual behavior is seen, with the higher values characterizing the cold months (enhanced condensation), which supports the occurrence of condensation processes.
143
CALIRO ET AL.
Figure 8. Time variations of the equilibrium PCO2 and the soil CO2 flux (a), and of the seismic activity reported both as number of events per month and as the strain release [Giudicepietro et al. 2010] (b). A PCO2 peak starts in concomitance with the seismic crisis of October 1999, passing from values of ~40 bar in 1998 to ~55–60 bar in 2001-2002, in good agreement with the CO2 flux data recorded by the automatic FLXOV4 station that increased by one order of magnitude.
cycle that, in agreement with the isotope variations, has the highest concentrations in the winter season (90,000–110,000 ppm) and the lowest in the summer (70,000–90,000 ppm), which confirms the occurrence of condensation that is driven by seasonal processes. Only a few points clearly deviate from the annual trend. These refer to samples collected in 2002, when other parameters showed anomalous behaviors due to the arrival at the surface of a deeply generated geochemical signal.
concentrations, from magmatic fluids, where it is normally absent or present at very low concentrations. Due to this large difference between magmatic and hydrothermal fluids, the increase in the CO2/CH4 ratio provides a powerful geochemical indicator of the arrival of hot, oxidizing, and possibly magmatic, fluids at the shallow levels of volcanoes characterized by the presence of hydrothermal systems above the magmatic ones [Chiodini 2009]. The arrival of deeper fluids, which is possibly characterized by the relatively high He concentrations, also explains the increase in the He/CO2 ratio that occurred in 1999-2002, concurrent with the increases in the CO2/CH4 ratio (Figure 4e). In the case of Vesuvius, CH4 is formed in the hottest zones of the hydrothermal system by CO2 reduction, as suggested by both chemical and isotopic gas equilibria [Chiodini et al. 2001, Fiebig et al. 2004]. Because of the relatively slow kinetics of the CO2 to CH4 reduction, the arrival of a pulse of deeper and hotter fluids that are poor in CH4 would cause a rapid increase in the CO2/CH4 ratio, followed by a decrease that reflects the slow re-establishment of the original hydrothermal conditions. On the other hand,
3.2.2. Deep processes In addition to the shallow secondary processes discussed above, other evidence highlights that the Vesuvius fumaroles have been affected by compositional changes caused by deep processes. An evident positive peak culminated in 2002 characterizes both the CO2/CH4 and the He/CO2 ratios (Figure 4d,e). In particular, the CO2/CH4 ratio increased sharply from a value of ~1,500 in 1998 to ~3,000 in 2002, and then gently decreased to the original values. It is worth noting that CH4 is a gas species that differentiates hydrothermal gases, where it is present at relatively high 144
LONG TIME-SERIES OF VESUVIUS FUMAROLES
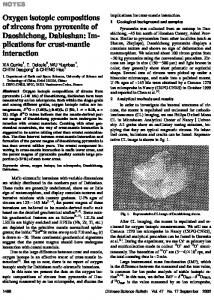
Figure 9. CH4/CO2 (a) and He/CO2 (b) ratios of fumarolic fluids versus equilibrium PCO2. Lines refer to a dilution model of fumarolic fluids with a hypothetical magmatic gas characterized by the absence of CH4 and by He/CO2 = 9 × 10⁻⁶. The good fitting of data supports the concept that a pulse of deep, possibly magmatic, fluids caused the 2002 anomaly.
contents. In Figure 9, the lines represent the values expected for the injection into a box, which represents the hydrothermal system theoretically, for a gas with CH4/CO2 = 0 (no CH4) and He/CO2 = 9 ×10⁻⁶. Practically, we considered that the initial gas composition was that of the lowest PCO2 sample (September 1999: PCO2 = 36.6 bar). Consequently, we computed the initial PCH4 and PHe on the basis of their composition (PCH4 = PCO2 × CH4/CO2 = 2.35 × 10⁻² bar; PHe = PCO2 × He/CO2 = 1.67 × 10⁻⁴ bar). This simply model can account for the compositional variations of the fumarolic fluids, again supporting the concept that a pulse of deep, possibly magmatic, fluids caused the 2002 anomaly. It is worth noting that the anomaly starts in concomitance with the seismic crisis of Autumn 1999 (Figure 8b). This crises included the main earthquake recorded at Vesuvius after the last eruption of 1944 (the event of October 9, 1999; ML 3.6; depth ~3 km beneath the central cone) [Del Pezzo et al. 2004]. In our opinion, the earthquakes of 1999 marked the arrival of the magmatic fluids into the hydrothermal system, which caused the above-described variations that culminated in 2002. In agreement with our interpretation, Saccorotti et al. [2002] proposed that at least a part of the seismic activity at Vesuvius is triggered by diffusion of a pressure front, which is possibly associated with the degassing process of the hydrothermal system. The seismic activity reported in Figure 8b (both as number of events per month and as monthly strain release) shows an intense period of activity starting form the October 1999, when there were the highest values, which then remained at considerable levels to the end of 2002.
the other gas species that are sensitive to redox conditions (i.e. H2 and CO) would quickly re-adjust to the new conditions, as these species are characterized by fast kinetics [Chiodini et al. 1993, Giggenbach 1987]. Assuming the presence of halite saturated brines, H2 and CO were used as indicators of the PCO2 of the hydrothermal system of Vesuvius [Chiodini et al. 2001]. To better investigate the origin of the 2002 anomaly, we computed the equilibrium PCO2 during the period 1998-2005, adopting the same approach as Chiodini et al. [2001]. The chronogram reported in Figure 8a shows that the 2002 He-CH4-CO2 anomaly (Figure 4c-e) was also accompanied by an evident increase in the equilibrium PCO2, which went from ~40 bar in 1998 to ~55–60 bar in 2001-2002. It is worth noting that these PCO2 values are in good agreement with the CO2 flux data, an extensive and independent parameter that is recorded by the automatic station located in the bottom of the Vesuvius crater, near fumarole FC2 (Figure 1, FLXOV4). During 2002, the CO2 flux increased by a factor of ~1 order of magnitude, going from ~1,000 gm−2d−1 in 1998-1999 to ~10,000 gm−2d−1 in 2002 (Figure 8a). To sum up, all of the observed variations are in agreement with the arrival of a pulse of deep, possibly magmatic, fluids rich in CO2 and He and poor in CH4. To further validate this hypothesis, a simple mass-balance dilution model of fumarolic fluids with a hypothetical magmatic gas is presented in Figure 9, where the CH4/CO2 and He/CO2 values of the 1998-2002 samples are plotted against the PCO2 estimated on the basis of the H2 and CO 145
CALIRO ET AL.
Figure 10. a) dD versus d18O diagram. Analytical isotopic compositions of fumarolic condensates and the computed d18Otot values of the H2O + CO2 system under discharged conditions are reported, together with the local meteoric water line [Caliro et al. 1998], isotopic composition of the groundwaters circulating in the volcanic aquifers of Vesuvius [Caliro et al. 2005] and other possible end-members of mixing (seawater and andesitic waters). The fumarolic data were more or less unaffect by condensation processes (i.e. more positive isotopic values, black dots) and they support an origin of the water due to a mixture of andesitic water, seawater and local meteoric water. b) Mixing-condensation model involving seawater, andesitic water and local groundwater. The assumed compositions of the end members are: seawater dD = 10‰, d18O = 1‰, XCO2 = 0; andesitic water dD = −20‰, d18O = 10‰, XCO2 = 0.4; groundwaters: dD = −38‰, d18O = −6.3‰, XCO2 = 0. The mixing line A represents the vapor generated by seawater–andesitic water mixtures. The mixing line B represents a dilution of line A by 50% in groundwater. Dashed lines represent the condensation patterns of line B vapors. The number of dashed lines refer to the different CO2 molar fractions of the pre-condensed line B vapors.
where symbols are the same as for Equation (5). The computed d18Otot data plot in Figure 10a on the right side of the local meteoric water forming a large cluster of points. Considering only the samples that were less affected by condensation (Figure 10a, black dots), Figure 10a suggests a derivation of fumarolic water due to variable mixing of three end-members: local meteoric water, arc-type magmatic water, and seawater. It is worth noting that this isotopic evidence on the involvement of seawater in the Vesuvius hydrothermal system is a novel finding, which is consistent with the already recognized presence of saline brines in this hydrothermal system [Chiodini et al. 2001].
4. Origin of the fumarolic water The large dataset of water isotopic composition that was acquired during the 1998-2010 period of volcanic monitoring can be used to refine the interpretation of the origin of the fumarolic water, with respect to previous interpretations [Chiodini et al. 2001]. For this purpose, we computed the oxygen isotopic composition of the H2O + CO2 system for the fumarolic fluids under discharge conditions, by means of the following equation: d 18 Otot
= ^ d18 Ov + 1000lnaCO2 - vh # |CO2 + + d18 Ov # ^ 1 - |CO2h
(10) 146
LONG TIME-SERIES OF VESUVIUS FUMAROLES
the 1999-2002 period. A continuous increase in the CO2 and He relative concentrations and a general decrease in the CH4 concentrations are interpreted to be the consequences of the increase in the relative amount of magmatic fluids in the hydrothermal system, which are rich in CO2 and He, and poor in CH4. Gas equilibria support this hypothesis, showing a PCO2 peak that culminated in 2002, passing from values of ~40 bar in 1998 to values of ~55–60 bar in 2001-2002 (Figure 8a). It is worth noting that the PCO2 values are supported by the CO2 soil-flux data that were recorded by the automatic station FLXOV4, which is located close to fumarole FC2 (Figure 1); these increased concurrently by about one order of magnitude (Figure 8a). These changes appear to be related to the seismic crisis that culminated with the main earthquake recorded on October 9, 1999, of ML 3.6 [Del Pezzo et al. 2004]. This event had the highest magnitude that has been recorded for at least 25 years, and possibly since the last eruption of Vesuvius (1944). It is our opinion that the seismic crisis of 1999 marked the arrival of the magmatic fluids into the hydrothermal system, which caused the above-described geochemical variations that culminated in 2002. In support of this interpretation, Saccorotti et al. [2002] proposed that at least part of the seismic activity at Vesuvius is triggered by diffusion of a pressure front, possibly associated with the degassing process of the hydrothermal system.
To explain the highly scattered distribution of the samples, in Figure 10b the data are compared with the composition expected for a possible mixing–condensation model. In particular, the grid in Figure 10b represents the vapor generated by seawater–andesitic water mixtures (Figure 10b, line A) which are diluted by 50% in the groundwater (Figure 10b, line B). The resulting vapors are subsequently condensed (Figure 10b, dashed lines). The effects of the condensation are strongly affected by the CO2 concentrations of the pre-condensed mixtures. Even if the selected composition for the magmatic component is largely unconstrained, as is the fraction of groundwater, on the whole, the model reproduces well the large variability of the measured isotopic composition. It is worth noting that the samples that would be more rich in the andesitic water component are those of 2002, i.e. the same samples where independent observations highlighted the presence of larger fractions of magmatic fluids (see above). 5. Conclusions Long time-series of chemical and isotopic compositions of the Vesuvius fumaroles have allowed us to identify processes that occur with different frequencies: short-period variations appear to be linked to processes that occur at shallow levels in the hydrothermal system, while relatively long time variations are induced by deep changes in the volcanic activity. The isotopic compositions of the fumarolic waters show evident annual cycles (Figure 5), with the more depleted values seen in the autumn-to-winter period. Taking into account the oxygen exchange between CO2 and steam, condensation processes at near discharge conditions can explain the annual 18O and D variabilities observed at the Vesuvius fumaroles. These processes are more efficient during the cold seasons, when the ambient temperatures are lower. The fraction of condensed steam can be roughly evaluated by comparing the theoretical and measured data, as 0.3 to 0.4. Taking into account the condensation processes, the analysis of the large dataset of water isotopic composition that was acquired during the 1998-2010 period of volcanic monitoring has allowed the refinement of the interpretation for the source of fumarolic water. Considering the isotopic oxygen exchange between CO2 and water vapor, the isotopic data suggest a derivation of the water from a mixture of meteoric, arc-type magmatic water, and seawater. The isotopic evidence of seawater is a novel finding that agrees with the presences of high saline brines in the hydrothermal system of Vesuvius [Chiodini et al. 2001]. Superimposed on the seasonal effects, the time series of the chemical composition of fumaroles reveals that important variations in the activity of Vesuvius occurred in
Acknowledgements. The authors are grateful to Cinzia Federico and Salvo Inguaggiato for their useful comments and suggestions on an early version of the manuscript.
References Aprile, F. and F. Ortolani (1979). Sulla struttura profonda della Piana Campana. Deep structure of the Campana Plain, Boll. Soc. Nat. Napoli, 88, 243-261. Arnò, V., C. Principe, M. Rosi, R. Santacroce, A. Sbrana and M.F. Sheridan (1987). Eruptive history, In: R. Santacroce (Editor), Somma Vesuvius, Quaderni de "La Ricerca Scientifica", CNR, Roma, 114-8, 53-103. Barberi, F., H. Bizouard, R. Clocchiatti, N. Metrich, R. Santacroce and A. Sbrana (1981). The Somma-Vesuvius magma chamber; a petrological and volcanological approach, Bull. Volcanol., 44, 295-315. Barberi, F. and L. Leoni (1980). Metamorphic carbonate ejecta from Vesuvius Plinian eruptions: evidence of the occurrence of shallow magma chambers, Bull. Volcanol., 43, 107-120. Berrino, G., G. Corrado and U. Riccardi (1998). Sea gravity data in the Gulf of Naples; a contribution to delineating the structural pattern of the Vesuvian area, J. Volcanol. Geotherm. Res., 82, 139-150. Caliro, S., G. Chiodini, R. Avino, C. Cardellini and F. Frondini (2005). Volcanic degassing at Somma-Vesuvio (Italy) inferred by chemical and isotopic signatures of 147
CALIRO ET AL.
groundwater, Appl. Geochem., 20, 1060-1076. Caliro, S., C. Panichi and D. Stanzione (1998). Baseline study of the isotopic and chemical composition of waters associated with the Somma-Vesuvio volcanic system, Acta Vulcanol., 10, 19-25. Chiodini, G. (2009). CO2/CH4 ratio in fumaroles a powerful tool to detect magma degassing episodes at quiescent volcanoes, Geophys. Res. Lett., 36, L02302. Chiodini, G., P. Allard, S. Caliro and F. Parello (2000). 18O exchange between steam and carbon dioxide in volcanic and hydrothermal gases: implications for the source of water, Geochim. Cosmochim. Acta, 64, 2479-2488. Chiodini, G., R. Cioni and L. Marini (1993). Reactions governing the chemistry of crater fumaroles from Vulcano Island, Italy, and implications for volcanic surveillance, Appl. Geochem., 8, 357-371. Chiodini, G., L. Marini and M. Russo (2001). Geochemical evidence for the existence of high-temperature hydrothermal brines at Vesuvio volcano, Italy, Geochim. Cosmochim. Acta, 65, 2129-2147. Cioni, R. and E. Corazza (1981). Medium-temperature fumarolic gas sampling, Bull. Volcanol., 44, 23-29. Cioni, R., R. Santacroce and A. Sbrana (1999). Pyroclastic deposits as a guide for reconstruction the multi-stage evolution of the Somma Vesuvius Caldera, Bull. Volcanol., 61, 207-222. Coleman, M.L., T.J. Shepherd, J.J. Durham, J.E. Rouse and G.R. Moore (1982). Reduction of water with zinc for hydrogen isotope analysis, Anal. Chem., 54, 993-995. Del Pezzo, E., F. Bianco and G. Saccorotti (2004). Seismic source dynamics at Vesuvius volcano, Italy, J. Volcanol. Geotherm. Res., 133, 23-39. Epstein, S. and T. Mayeda (1953). Variation of O-18 content of waters from natural sources, Geochim. Cosmochim. Acta, 4, 213-224. Federico, C., A. Aiuppa, P. Allard, S. Bellomo, P. Jean-Baptiste, F. Parello and M. Valenza (2002). Magma-derived gas influx and water-rock interactions in the volcanic aquifer of Mt. Vesuvius, Italy, Geochim. Cosmochim. Acta, 66, 963-981. Federico, C., A. Aiuppa, R. Favara, S. Gurrieri and M. Valenza (2004). Geochemical monitoring of groundwaters (19982001) at Vesuvius volcano (Italy), J. Volcanol. Geotherm. Res., 133, 81-104; doi: 10.1016/S0377-0273(03)00392-5. Federico, C., G. Capasso, A. Paonita and R. Favara (2010). Effects of steam-heating processes on a stratified volcanic aquifer: stable isotopes and dissolved gases in thermal waters of Vulcano Island (Aeolian archipelago), J. Volcanol. Geotherm. Res., 192, 178-190; doi: 10.1016/ j.jvolgeores.2010.02.020. Fiebig, J., G. Chiodini, S. Caliro, A. Rizzo, J. Spangenberg and J.C. Hunziker (2004). Chemical and isotopic equilibrium between CO2 and CH4 in fumarolic gas discharges: gen-
eration of CH4 in arc magmatic-hydrothermal systems, Geochim. Cosmochim. Acta, 68, 2321-2334. Frondini, F., G. Chiodini, S. Caliro, C. Cardellini, D. Granieri and G. Ventura (2004). Diffuse CO2 degassing at Vesuvio, Italy, Bull. Volcanol., 66, 642-651. Giggenbach, W.F. (1975). A simple method for the collection and analysis of volcanic gas samples, Bull.Volcanol., 39, 132-145. Giggenbach, W.F. (1987). Redox processes governing the chemistry of fumarolic gas discharges from White Island, New Zealand, Appl. Geochem., 2, 143-161. Giggenbach, W.F. and R.L. Goguel (1989) Collection and analysis of geothermal and volcanic water and gas discharges, Department of Scientific and Industrial Research Chemistry Division, Petone, New Zealand. Giggenbach, W.F. and S. Matsuo (1991). Evaluation of results from Second and Third IAVCEI field workshops on Volcanic gases, Mt. Usu, Japan, and White Island, New Zealand, Appl. Geochem., 6, 125-141. Giggenbach, W.F. and M.K. Stewart (1982). Processes controlling the isotopic composition of steam and water discharges from steam vents and steam-heated pools in geothermal areas, Geothermics, 11, 71. Giudicepietro, F., M. Orazi, G. Scarpato, R. Peluso, L. D'Auria, P. Ricciolino, D. Lo Bascio, A.M. Esposito, G. Borriello, M. Capello, A. Caputo, C. Buonocunto, W. De Cesare, G. Vilardo and M. Martini (2010). Seismological monitoring of Mount Vesuvius (Italy): more than a century of observations, Seism. Res. Lett., 81-4. Henley, R.W. and M.K. Stewart (1983). Chemical and isotopic changes in the hydrology of the Tauhara geothermal field due to exploitation at Wairakei., J. Volcanol. Geotherm. Res., 15, 285-314. Horita, J. and D.J. Wesolowski (1994). Liquid-vapor fractionation of oxygen and hydrogen isotopes of water from the freezing to the critical temperature, Geochim. Cosmochim. Acta, 58, 3425-3437. Iacono-Marziano, G., F. Gaillard, B. Scaillet, M. Pichavant and G. Chiodini (2009). Role of non-mantle CO2 in the dynamics of volcano degassing: the Mount Vesuvius example, Geology, 37, 319-322. Ippolito, F., F. Ortolani and M. Russo (1973). Struttura marginale tirrenica dell'Appennino Campano; reinterpretazione di dati di antiche ricerche di idrocarburi / The structure of the Tyrrhenian border of the Campania Apennines; reinterpretation of old data obtained during the hydrocarbon exploration program, Società Geologica Italiana, Rome, Italy. Joron, J.L., N. Metrich, M. Rosi, R. Santacroce and A. Sbrana (1987). Chemistry and petrography, In: R. Santacroce (Editor), Somma-Vesuvius, Quaderni de "La Ricerca Scientifica", CNR, Roma, 105-174. Madonia, P., C. Federico, P. Cusano, S. Petrosino, A. Aiuppa 148
LONG TIME-SERIES OF VESUVIUS FUMAROLES
and S. Gurrieri (2008). Crustal dynamics of Mount Vesuvius from 1998 to 2005: Effects on seismicity and fluid circulation, J. Geophys. Res., 113, B05206; doi: 10.1029/ 2007JB005210. Pescatore, T.S. and I. Sgrosso (1973). I rapporti tra la piattaforma campano-lucana e la piattaforma abruzzese-campana nel casertano, Boll. Soc. Geol. It., 92, 925-938. Principe, C., D. Brocchini and M. Perillo (1999). The "Cognoli di Trocchia" volcano and Monte Somma growth, Plinius, 22, 316-317. Richet, P., Y. Bottinga and M. Javoy (1977). Review of hydrogen, carbon, nitrogen, oxygen, sulfur, and chlorine stable isotope fractionation among gaseous molecules, Ann. Rev. Earth Planet. Sci., 5, 65-110. Rosi, M., C. Principe and R. Vecci (1993). The 1631 Vesuvius eruption – a reconstruction based on historical and stratigraphical data, J. Volcanol. Geotherm. Res., 58, 151-182. Saccorotti, G., G. Ventura, G. Vilardo (2002). Seismic swarms related to diffusive processes; the case of Somma-Vesuvius Volcano, Italy, Geophysics, 67, 199-203. Santacroce, R. (1983). A general model for the behavior of the Somma-Vesuvius volcanic complex, J. Volcanol. Geotherm. Res., 17, 237-248. Ventura, G., G. Vilardo and P.P. Bruno (1999). The role of flank failure in modifying the shallow plumbing system of volcanoes: an example from Somma-Vesuvius, Italy, Geophys. Res. Lett., 26, 3681-3684. Zollo, A., W. Marzocchi, P. Capuano, A. Lomax and G. Iannaccone (2002). Space and time behavior of seismic activity at Mt. Vesuvius volcano, southern Italy, Bull. Seismol. Soc. Am., 92, 625-640.
*Corresponding author: Stefano Caliro, Istituto Nazionale di Geofisica e Vulcanologia, sezione di Napoli, Osservatorio Vesuviano, Naples, Italy; e-mail:
[email protected]. © 2011 by the Istituto Nazionale di Geofisica e Vulcanologia. All rights reserved.
149