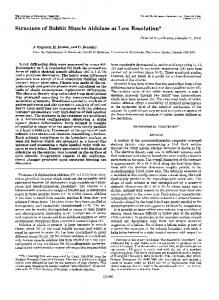
Longitudinal-Transverse Separations of Structure Functions at Low Q2 for Hydrogen and Deuterium V. Tvaskis,1, 2 M. E. Christy,3 J. Arrington,4 R. Asaturyan,5 O. K. Baker,3 H. P. Blok,1, 2 P. Bosted,6 M. Boswell,7 A. Bruell,8 A. Cochran,3 L. Cole,3 J. Crowder,9 J. Dunne,10 R. Ent,6 H. C. Fenker,6 B. W. Filippone,11 K. Garrow,6 A. Gasparian,3 J. Gomez,6 H.E. Jackson,4 C. E. Keppel,3, 6 E. Kinney,12 Y. Liang,3, 13 W. Lorenzon,14 A. Lung,6 D. J. Mack,6 J. W. Martin,8 K. McIlhany,8 D. Meekins,6 R. G. Milner,8 J. H. Mitchell,6 H. Mkrtchyan,5 B. Moreland,6 V. Nazaryan,3 I. Niculescu,15 A. Opper,16 R. B. Piercey,10 D.H. Potterveld,4 B. Rose,6 Y. Sato,3 W. Seo,17 G. Smith,6 K. Spurlock,10 G. van der Steenhoven,2 S. Stepanyan,5 V. Tadevosian,5 A. Uzzle,3 W. F. Vulcan,6 S. A. Wood,6 B. Zihlmann,1 and V. Ziskin8
arXiv:nucl-ex/0611023v1 13 Nov 2006
2
1 Vrije Universiteit, 1081 HV Amsterdam, The Netherlands National Instituut voor Kernfysica en Hoge-Energiefysica (NIKHEF), 1009 DB Amsterdam, The Netherlands 3 Hampton University, Hampton, Virginia 23668 4 Argonne National Laboratory, Argonne, Illinois 60439 5 Yerevan Physics Institute, 375036, Yerevan, Armenia 6 Thomas Jefferson National Accelerator Facility, Newport News, Virginia 23606 7 Randolph-Macon Woman’s College, Lynchburg, Virginia 24503 8 Massachusetts Institute of Technology, Cambridge, Massachusetts 02139 9 Juniata College, Huntingdon, Pennsylvania 16652 10 Mississippi State University, Mississippi State, Mississippi 39762 11 California Institute of Technology, Pasadena, California 91125 12 University of Colorado, Boulder, Colorado 80309 13 American University, Washington, D.C. 20016 14 University of Michigan, Ann Arbor, Michigan 48109 15 The George Washington University, Washington, D.C. 20052 16 Ohio University, Athens, Ohio 45071 17 Kyungpook National University, Taegu 702-701, Korea (Dated: February 4, 2008)
We report on a study of the longitudinal to transverse cross section ratio, R = σL /σT , at low values of x and Q2 , as determined from inclusive inelastic electron-hydrogen and electron-deuterium scattering data from Jefferson Lab Hall C spanning the four-momentum transfer range 0.06 < Q2 < 2.8 GeV2 . Even at the lowest values of Q2 , R remains nearly constant and does not disappear with decreasing Q2 , as expected. We find a nearly identical behaviour for hydrogen and deuterium. PACS numbers: 13.60.-r,12.38.Qk,13.90.+i,13.60.Hb
Since the early experiments at the Stanford Linear Accelerator Center (SLAC), which discovered the substructure of the nucleon and led to the development of the quark parton model [1], deep inelastic scattering (DIS) has been a powerful tool in the investigation of the partonic substructure of the nucleon. After decades of experiments with electron and muon beams, the nucleon structure function F2 (x, Q2 ) is known with high precision over many orders of magnitude in x and Q2 [2]. Here, Q2 is the negative square of the four-momentum transfer of the exchanged virtual photon in the scattering process. The Bjorken scaling variable x = Q2 /2M ν, with M the nucleon mass and ν the energy transfer, can be interpreted as the fraction of the nucleon momentum carried by the struck parton. In the region of large Q2 and ν, the results of DIS measurements are typically interpreted in terms of partons (quarks and gluons). In this case, the theoretical framework is provided by perturbative Quantum Chromo Dynamics (pQCD), which includes logarithmic scaling violations. This description starts to fail when non-
perturbative effects such as higher-twist interactions between the struck quark in the scattering process and other quarks or gluons in the nucleon become important. The sensitivity for higher twist effects increases with decreasing Q2 , since they are proportional to powers of 1/Q2 . There is great interest in the behaviour of the nucleon structure functions in the low Q2 region where the transition from perturbative to non-perturbative QCD takes place. However, little is known about this behaviour, since at large invariant mass W of the hadronic system there are few data points in this region, except for the (transverse) cross section σT at exactly Q2 = 0, which is accessible through real photon absorption experiments. The more plentiful data at low W are typically interpreted in terms of nucleon resonance excitations. The differential cross section for inclusive electron scattering, after dividing by the virtual photon flux factor (Γ), can be written as 1 d2 σ = σT + εσL , Γ dΩdE ′
(1)
2 where ε is the virtual photon polarization and σL (σT ) is the longitudinal (transverse) virtual-photon absorption cross section, which depends on x and Q2 . Current conservation determines the behaviour of the structure functions for Q2 → 0, leading to R(x, Q2 ) ≡
FL σL = = O(Q2 ), σT 2xF1
(2)
where FL and F1 are the longitudinal and transverse nucleon structure functions. The value of Q2 at which this behavior becomes manifest is however neither predictable nor yet observed. While there is a wealth of data for F2 = (2xF1 + FL )/(1 + Q2 /ν 2 ), relatively few data exist for FL , or equivalently R. Data on R(x, Q2 ) on hydrogen and deuterium are available in a limited x and Q2 (Q2 > 1 GeV2 ) range, with a typical uncertainty of 0.1-0.2 [3, 4], comparable to the size of R itself. For scattering from point-like spin-1/2 particles, R should vanish at large values of Q2 because of helicity conservation. At low values of Q2 , however, R is not small, and typical values are about 0.3. Precision data on R are necessary for several reasons. Most importantly, determinations of the structure function F2 from cross section measurements, and the parton distributions derived therefrom, need numerical values for R. If the former are not based on longitudinally and transversely separated measurements, the uncertainties in F2 introduced by assumptions for R can be as large as 20%. Furthermore, especially in the low Q2 region, data are needed to study higher twist effects and to search for the onset of the current conservation behaviour of the structure functions at low Q2 described above. The determination of R is typically accomplished via a Rosenbluth-type separation technique, which requires high precision measurements of the cross section at fixed values of x and Q2 , but at different values of ε. This technique requires the use of at least two beam energies and correspondingly different scattered-electron angles, θ. Only in some experiments have such measurements actually been performed [3, 4, 5, 6, 7, 8, 9, 10]. In the framework of perturbative QCD, there is no requirement that R be the same for protons and neutrons. Previous results have shown RD - RH , the difference in R from hydrogen and deuterium targets, to be consistent with zero [3, 9, 10]. However, these measurements were carried out mainly at higher Q2 , where R itself is small and any difference, therefore, difficult to ascertain. In this paper we present results from a study of R for both hydrogen and deuterium at low values of Q2 . The experiment (E99-118) was carried out at the Thomas Jefferson National Accelerator Facility (Jlab). Data were obtained at 0.007< x < 0.55 and 0.06 < Q2 < 2.8 GeV2 , by utilizing 2.301, 3.419 and 5.648 GeV electron beams at a current of I = 25 µA. The minimum scattered electron energy was E ′ ≈ 0.4 GeV and the range of the invariant
mass squared of the hadronic system W 2 was between 3.5 and 10 GeV2 . Electrons scattered from 4 cm long liquid hydrogen (H) and deuterium (D) targets were detected in the High-Momentum Spectrometer (HMS) in Hall C at various angles between 10◦ and 60◦ . The inclusive double differential cross section for each energy and angle bin within the spectrometer acceptance was determined from Ycorr dσ , ′ = dΩdE L∆Ω∆E ′
(3)
where ∆Ω (∆E ′ ) is the bin width in solid angle (scattered energy), L is the total integrated luminosity, and Ycorr is the measured electron yield after correcting for detector inefficiencies, background events, and radiative effects. To account for backgrounds from π 0 production and its subsequent decay into two photons followed by pair production of electron-positron pairs, positron data were also taken by reversing the polarity of the spectrometer. Other background contributions include electron scattering from the aluminum walls of the cryogenic target cells and electroproduced negatively charged pions. Events from the former were subtracted by performing substitute empty target runs, while events from the latter were identified and removed by use of both a gas Cherenkov counter and an electromagnetic calorimeter. Additional details regarding the analysis and the standard Hall C apparatus employed in this experiment can be found in Ref. [11]. Radiative effects including bremsstrahlung, vertex corrections and loop diagrams are calculated using the approach by Bardin et al [12]. Additional radiative effects in the target and its exit windows were determined using the formalism of Mo and Tsai [13]. The calculation of such effects includes the emission of one hard photon. There is, however, the possibility that the electron could emit two hard photons. The calculation of this process is unfortunately not fully established and the corresponding effect was therefore treated in the present analysis as a separate uncertainty. For each energy bin, a weighted average cross section over θ within the spectrometer acceptance was obtained by using a model to correct for the angular variation of the cross section from the central angle value. To minimize the dependence on the model used to compute both this correction and the radiative effects, an iterative procedure was employed. The total systematic uncertainty in the differential cross section was taken as the quadratic sum of all the systematic uncertainties contributing to the cross section measurement. In a Rosenbluth separation one needs to distinguish between uncertainties that are correlated between measurements at different ε, such as uncertainties in target thickness and integrated charge, and uncorrelated ones. Not including the contributions from radiative corrections, the uncorrelated systematic uncertain-
ties on the cross section measurements in this experiment amounted to 0.9%, while the total systematic uncertainty was 1.35%. The size, and consequently the uncertainty, of the radiative effects strongly depends on the kinematics and is largest at low values of E ′ where the measured cross section is dominated by events from elastic or quasi-elastic scattering with the emission of one or more photons in the initial or final state. The estimate of these uncertainties was determined by varying all relevant input cross sections within their uncertainties, and amounted to as much as 1.5% for hydrogen and 8.5% for deuterium in the most extreme cases considered. It rapidly decreased for higher values of E ′ , i.e. higher values of x and Q2 . The much larger uncertainty in the deuterium cross section is due to the contribution from quasielastic scattering which can only be modelled approximately. The extractions of purely longitudinal and transverse cross sections and structure functions were accomplished via the Rosenbluth technique, where the reduced cross section is fit linearly as a function of ε, as in Eq.(1). The intercept of such a fit gives the transverse cross section σT (and therefore the structure function F1 (x, Q2 )), while the slope gives the longitudinal cross section σL , from which the structure functions R(x, Q2 ) or FL (x, Q2 ) can be extracted. The results for R(x, Q2 ) in hydrogen are shown in Fig. 1 as a function of Q2 for fixed values of x (red squares). The inner error bars represent the combined statistical and uncorrelated systematic uncertainties. The total error bars represent the statistical and systematic uncertainties added in quadrature. The data are compared to the results of previous measurements at Jlab (E94110) [7], SLAC [3], and by the EMC [8], NMC [9] and BCDMS [4] collaborations at CERN. The structure function F2 determined through the Rosenbluth separation technique was found to agree to better than 2% with a Regge-motivated parameterization of all previously available deep-inelastic scattering data [14], even at very low values of Q2 [11]. This facilitated the utilization of an alternative approach where R was calculated using this parametrization (including a 2% uncertainty) for the structure function F2 (x, Q2 ) from 2M xF2 d2 σ = σMott dΩdE ′ Q2 ε
1 + εR 1+R
!
.
(4)
The results (shown by the blue circles in Fig. 1) cover a larger kinematic range than the results from the Rosenbluth separation, since the measurement of this experiment is combined via the model with results of previous experiments at different energies. The inner error bars represent the statistical uncertainty and the total error bars represent the quadratic sum of the statistical uncertainty and the uncertainty in the radiative corrections
R(H)
3 0.6
x = 0.030
E99-118 (Ros. Sep.)
x = 0.050
E99-118 (Mod. Dep.)
0.4
E94-110 SLAC
EMC NMC BCDMS
0.2 0 0.6
x = 0.075
x = 0.100
x = 0.175
x = 0.250
x = 0.325
x = 0.400
0.4 0.2 0 0.6 0.4 0.2 0 0.6 0.4 0.2 0 10
-2
10
-1
1
10
10
-2
10
-1
1
10
Q [GeV ] 2
2
FIG. 1: Comparison of the values of R(x, Q2 ) for hydrogen from the present experiment (E99-118) to the results of other experiments. The dashed curve represents the parametrizaH tion Re99118 (x, Q2 ) and the solid curve represents the model developed in [15] (see text for details.)
due to the possible emission of two hard photons. The shaded bands represent the uncertainties in the radiative effects due to uncertainties in the input cross sections. Especially in the model dependent extraction the uncertainties are dominated by the unceratinties in the radiative corrections which are correlated between data points. The results from the second method agree very well with those obtained from the Rosenbluth separation method. Good agreement is also found with previous experiments in the regions of x and Q2 where the data overlap. As mentioned above, at low values of Q2 , current conservation requires R to be proportional to Q2 . However, in the data from the present experiment this behaviour is not yet observed, and R remains nearly constant over the measured range in Q2 . Thus, the transition to R ∝ Q2 must occur below a Q2 value of about 0.1 GeV2 at low x, or below 1 GeV2 for x > 0.2. This result will have a direct impact on structure function extractions at low Q2 . The dashed curve in Fig. 1 represents a new H (x, Q2 ) [11]) based on all parametrization of R (Re99118 available data including those from this experiment. The functional form of the parametrization has been chosen to satisfy the condition that R vanishes as Q2 goes to zero. At Q2 = 2 GeV2 , it was connected to a previously obtained parametrization from SLAC [3] that is based on measurements at higher values of Q2 . The solid curves in the upper four panels of Fig. 1 show, within its range of applicability (x ≤ 0.1), the model developed in [15],
RD - RH
4
0.5 E99-118 NMC SLAC
0.4 0.3 0.2 0.1 0 -0.1 -0.2 -0.3 -0.4 -0.5 10
-1
1
Q2 [GeV2]
FIG. 2: The difference RD − RH as a function of Q2 from the present experiment calculated via Rosenbluth separation. The data from previous experiments are also shown for Q2 < 5 GeV2 .
which is based on the photon-gluon fusion mechanism and extrapolated into the region of low Q2 . Both the Rosenbluth separation and the model dependent extraction of R were also carried out for the deuterium data. While the precision of the results from the Rosenbluth separation is comparable to that of the hydrogen data, the systematic uncertainty in the model dependent extraction is much bigger for the deuterium data due to a large uncertainty in the calculation of the quasielastic radiation tail which is significant at low x and Q2 . D
H
Thus, the difference R − R was calculated using only the results from the Rosenbluth separation method, compiled in Table I, and compared in Fig. 2 to previous results from NMC [9] and SLAC [10]. In this plot only the most recent and precise data from SLAC [10] are shown, while additional SLAC results [3] are included in the statistical analysis of RD − RH , below. Previously, the conclusion was drawn that there is no difference between RD and RH . However, most of the data from NMC are at rather high Q2 values, where R itself is small, and the RD − RH values extracted from the SLAC measurements [3] were averaged over all Q2 , including high Q2 values, and were hence biased towards smaller differences. Including our results, the data are still consistent with RD being identical to RH . However, at values of Q2 < 1.5 GeV2 there is a hint both in the present data and in the highest-precision data from SLAC [10] that RD is smaller than RH . The global average (including all data) yields RD − RH = -0.054 ± 0.029.
TABLE I: The values of RH and RD - RH calculated via the Rosenbluth separation. Note that the systematic error in the difference accounts for the correlation between the uncertainties in the hydrogen and deuterium data. Complete data tables and the new parametrization of R(x, Q2 ) may be requested via email (
[email protected],
[email protected]). Q2 GeV2 x RH Stat. Syst. RD - RH Stat. Syst. 0.150 0.041 0.259 0.074 0.153 0.036 0.131 0.136 0.175 0.050 0.307 0.056 0.188 -0.100 0.091 0.196 0.273 0.077 0.460 0.049 0.132 -0.162 0.084 0.153 0.283 0.081 0.414 0.045 0.117 -0.141 0.071 0.138 0.476 0.156 0.283 0.063 0.025 -0.115 0.179 0.021 0.508 0.091 0.406 0.038 0.168 -0.164 0.065 0.172 1.045 0.200 0.335 0.048 0.041 -0.155 0.068 0.046 1.670 0.320 0.211 0.038 0.021 -0.040 0.057 0.051
The results presented here are measurements of the longitudinal to transverse cross section ratio below Q2 of about 2 GeV2 for hydrogen and deuterium targets. These data appear in a region where R was expected to disappear as Q2 gets very small. However, a nearly constant behaviour of RH and RD is observed down to Q2 of about 0.1 GeV2 at low values of x. For Q2 < 1.5 GeV2 , the data hint at a small difference between RD and RH . This work is supported in part by research grants from U.S. Department of Energy, the U.S. National Science Foundation, and the Stichting voor Fundamenteel Oderzoek der Materie (FOM) of the Netherlands. The Southeastern Universities Research Association operates the Thomas Jefferson National Accelerator Facility under the U.S. Department of Energy contract DEAC0584ER40150. [1] R. P. Feynman, Photo-Hadron Interactions, W. A. Benjamin Inc. Reading, MA (1976). [2] K. Hagiwara et al., Phys. Rev. D 66, 010001 (2002). [3] L. W. Whitlow et al., Phys. Lett. B250, 193 (1990). [4] A. C. Benvenuti et al., Phys. Lett. B223, 485 (1989). [5] S. Dasu et al., Phys. Rev. Lett. 60, 2591 (1988). [6] M. E. Christy et al., Phys. Rev. C 70, 015206 (2004). [7] Y. Liang et al., nucl-ex/0410027 (2004). [8] J. J. Aubert et al., Nucl. Phys. B259, 189 (1985). [9] M. Arneodo et al., Nucl. Phys. B483, 3 (1997). [10] L. H. Tao et al., Z. Phys. C70, 387 (1996). [11] V. Tvaskis, Ph.D. Thesis, Vrije Universiteit (2004), The Netherlands, unpublished. [12] A. A. Akhundov, D. Yu. Bardin and N. M. Shumeiko, Sov. J. Nucl. Phys. 26, 660 (1977); D. Yu. Bardin and N. M. Shumeiko, Sov. J. Nucl. Phys. 29, 499 (1979); and A. A. Akhundov et al., Sov. J. Nucl. Phys. 44, 988 (1986). [13] L. W. Mo and Y. S. Tsai, Rev. Mod. Phys. 41, 205 (1969). [14] H. Abramowicz and A. Levy, hep-ph/9712415, v1, (1997). [15] B. Badelek, J. Kwiecinski, and A. Stasto, Z. Phys. C74, 297 (1997).