International Journal of Bioelectromagnetism Vol. 5, No. 1, 2003 pp. 139 - 140
www.ijbem.org
Low Variability of Autocorrelation Maps with Intrathoracic Heart Position Alexandru Corlana, Robert S Macleodb, Luigi De Ambroggic a University Hospital of Bucharest, Academy of Medical Sciences, Romania b Cardiovascular Research and Training Institute, University of Utah, Salt Lake City, UT, USA cCardiology Department, Istituto Policlinico San Donato, University of Milan, Italy Correspondence: Luigi De Ambroggi, Cardiology Department, Istituto Policlinico, San Donato, University of Milan, Via Morandi 30, San Donato Milanesse, Italy. E-mail:
[email protected]
Abstract. We computed and compared autocorrelation maps (AC maps) from ECG recordings obtained on human thorax shaped electrolytic filled tanks in which a perfused dog heart was immersed at various geometrical displacements (in a range of 5-6 cm on x, y and z), by considering the correlation between instantaneous potential distributions at each pair of instants over the QT interval. The correlation coefficient between AC maps was in the range of 0.92-0.99 while between the corresponding QRST integral maps it was in the range of 0.55-0.87, prooving that AC maps are ECG representations with low dependence on the thorax electrical properties. Keywords: Body Surface ECG Maps; Autocorrelation Maps; Volume Conductor; Interindividual Variability
1. Introduction Surface potential patterns are influenced by the properties of the volume conductor, in particular geometry of the thorax and position of the heart in the thorax [Hoekema et al, 1999]. A recent study [Macleod et al, 2000] demonstrated that variability of the geometric position of the heart in the thorax may cause changes in body surface potentials that exceed diagnostic thresholds for pathologic conditions. Correlations between instantaneous potential distributions should be independent, theoretically, of the amplitude of the potentials and of the characteristics of the volume conductor around the heart [Corlan et al, 2002]. The purpose of this study was to assess the extent of the effect of the heart position on the correlation between instantaneous body surface potential distributions.
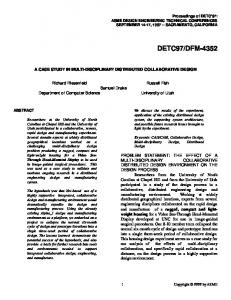
2. Material and Methods We used data obtained in a previous experiment, performed at the Cardiovascular Research and Training Institute, University of Utah, and reported in [Macleod et al, 2000]. In short, isolated dog hearts, perfused by blood from another (support) dog, were immersed in a human torso shaped tank, filled with electrolyte. The conductivity of the electrolyte was homogenous and the same in all recordings. Electrograms were obtained from 370 electrodes on the tank and 128 on the epicardium. The heart was moved in one centimeter steps on each of the x, y and z axes over a range of 5cm. For each position a cardiac cycle was recorded and one baseline corrected cycle was extracted. In each tank recording, for every pair of sampling instants between the onset of the QRS and the end of the T wave, we computed the correlation coefficient between the potential distributions, by considering the pairs of potentials on each lead at the two instants, obtaining a square matrix. This matrix is called the autocorrelation map (AC map) of the QT interval. AC maps can be displayed [Abildskov et al, 1976] in the form of the graphic (Fig. 1,top), in which the successive instants during the same QRST interval are on both the x and the y axes. Each point on the graphic represents the correlation coefficient between the potential distribution at the instants at the x and y coordinates, by a shade of gray, from black (for -1.0) to white (for 1.0), as shown in the scale at the right of the map. Resemblance between two AC maps was measured using the correlation coefficient between the map values at corresponding pairs of intervals, while
between two QRST integral maps using the correlation between integrals on the same leads.
3. Results and Discussion The discrete differences between AC maps can be compared visually with the substantial differences between the integral maps in figure 1. For the largest displacements on x, y and z, resemblance of AC maps was between r=0.96 and r=0.98 for the QRS, between R=0.92 and R=0.96 for the STT and the QRST. For the integral maps, resemblance was between r=0.77 and r=0.87 for the QRS, between r=0.55 and r=0.75 for the STT and between r=0.67 and r=0.85 for the QRST. ECG AC maps show much less variation with geometrical changes of the thorax conductor than integral maps. Thus, diagnostic indices computed from the ECG AC maps such as the deviation and the similarity indices [Corlan et al, 2000, De Ambroggi et al, 1991], can be expected to be more specific to phenomena taking place in the myocardium than criteria based directly on ECG amplitudes in various leads.
Figure 1. AC maps (top) and QRST integral maps (bottom) of tank surface ECG recordings obtained with the heart at positions 5 cm apart in the tank (x+3 and z-4). In integral maps continuous lines are positive isointegrals while dashed lines are negative isointegrals.(+) and (-) represent maximal and minimal. isointegral values. AC maps have the same time interval during the QRST on both x and y.
References J Abildskov, MJ Burgess, RL Lux, R Wyatt, and M Vincent. The expression of normal ventricular repolarization in the body surface distribution of T potentials. Circulation, 54: 901--906, 1976. AD Corlan, R Corlan, and L De Ambroggi. Variability of simulated {ECG} autocorrelation maps with electrode placement. Int J Bioelectromagnetism, 4: 347--348, 2002. AD Corlan and L De Ambroggi. New quantitative methods of ventricular repolarization analysis in patients with left ventricular hypertrophy. It Heart J, 1: 542--548, 2000.
L De Ambroggi, MS Negroni, E Monza, T Bertoni, and PJ Schwartz. Dispersion of ventricular repolarization in the long QT syndrome. Am J Cardiol, 68: 614--620, 1991. R Hoekema, GJH Uijen, L van Erning, and A van Oosterom. Interindividual variability of multilead electrocardiographic recordings. influence of heart position. J Electrocardiol, 32:137--148, 1999. RS Macleod, Q Ni, B Punske, PR Ershler, B Yilmaz, and B Taccardi. Effects of heart position on the body-surface electrocardiogram. J Electrocardiol, 33 Suppl: 229--237, 2000.
© International Society for Bioelectromagnetism • International Journal of Bioelectromagnetism 5, 1