Macro and Micro Patterns in the Software Design Activity Jonatan HERNANDEZ a , Hironori WASHIZAKI b and Yoshiaki FUKAZAWA c a Waseda University,
[email protected] b Waseda University,
[email protected] c Waseda University,
[email protected] Abstract. The activities of software analysis and design are important because they are the first steps in the software development. The objective of this paper is to identify the patterns that emerge during these activities. Identifying these patterns is important because we can imitate the patterns that increase our productivity and avoid the patterns that decrease our productivity. The patterns are made from sequences the logical actions “Create”, “Delete” and “Rename” applied on the elements of the design diagrams. These actions are collected when creating UML class diagrams with the open source modeling tool ArgoUML. The patterns found are of two types: micro-pattens and macro-patterns. These patterns were related to different design strategies such as top down, breadth first. Keywords. software design, patterns, software modeling
1. Introduction Software modeling is a human activity. Because “all software is designed”[1], design is a fundamental building block in the software development process. Design is a human activity characterized by the expertise and abilities of the designers who create it. Because of its human nature, one topic that has attracted research is the difference between experts and novices. The strategies that both experts and novices use are important because we can imitate the patterns that increase our productivity, and avoid patterns that make us less productive. Identifying these strategies will increase our understanding of the design process, and help us to become better software designers. Design problems are ill-defined. There is not only one and correct solution to a design problem. Moreover it is difficult to evaluate when a design is better than another. There are classifications for the strategies used to solve a design problem[2]: opportunistic, top down and bottom up, breadth first and depth first. The identification of these patterns will help us understand when these strategies are applied, and what the characteristics of the designers who apply them are. One of the main targets of the research on the design activity has been on the differences between experts and novices [2][3][4][5]. From these researches some characteristics of expertise in software design have been described. In [5] experts also know more about strategies than moderate performers, and spend more time on problem comprehension. Experts decompose design problems into smaller ones. In [6] experts have more
models available for solving a problem. Thus, designers — depending on their expertise — use different approaches to solve design problems. These are the characteristics that we try to identify in the design activity. Previous research has made extensive use of the verbal protocols to collect data about the process of design in which the participants are requested to verbalize their thinking processes [2] [7] [8]. These protocols require an extensive analysis of the recorded sessions, making data collection time-consuming. Moreover most of the elements created during the activity are of a very short existence, like notes, and talks with colleagues and co-workers [1]. A method for fast, automated data collection is still a challenge.
2. Our Approach The following method for collecting data is proposed: register the actions of Create, Delete and Rename that are applied to the elements of a class diagram. The elements considered are class, interface, attribute, operation, generalization, association and package from the UML standard. This is summarized in Table 1. Element Action
Package
Class
Interface
Attribute
Operation
Generalization
Create
CP
CC
CI
CA
CO
CG
Delete Rename
DP RP
DC DI DA DO DG RC RI RA RO RG Table 1. Abbreviations for the Actions collected from the user.
Association CS DS RS
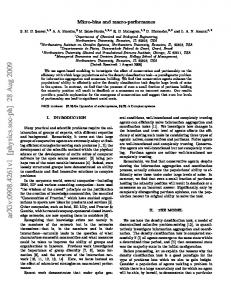
Thus, for each diagram created we have a sequence S of actions {a1 , a2 , a3 ...an }, where a is one of the elements of Table 1. After having all the sequence of actions, we proceed to count all the patterns in the log. For counting the patterns we used the library tau [9]. Then we analyzed the most frequent patterns. The process can be seen in Figure 1.
Problem
UML Class Diagram
Seq = a1,a2,a3... an
Designer Pattern Detection
Figure 1. Process to obtain the log of the participants.
3. Experiment Setup The subjects were asked to analyse the parts and control elements that are necessary for an elevator to work properly. The objective is to have a UML class diagram with the elements and relationships appropriate to the subject to represent an elevator and its control system. The subjects for the experiment were two students of 4th year of Bachelor Degree and one student of 1st year of Master Degree from the Department of Computer Science and Engineering. The sessions lasted between 1 hour and 1 hour and a half. One session was recorded using screen recording software and then replicated to obtain the records for analysis.
4. Results and Discussion The experiments are identified as Experiment E1, E2 and E3 respectively. Each subject is identified as S1, S2 and S3 in the same way. Figure 2 shows the total number of actions and distribution per type. The resulting diagrams are in [10].
Figure 2. Total number each action: Create, Delete and Rename for all the elements
There were two kinds of patterns found. The first type of patterns were macropatterns. This kind of pattern appears when we see the complete sequence of actions. The second type are micro-patterns. Micro-patterns are the sequence of actions. For example, these patterns represent how common an action is such as Create Class followed by a action Rename Class. Micro-patterns are where the sequences are located, and how many times a sequence is repeated. 4.1. Macro-Patterns The first macro-pattern is related to the total number of Delete actions. In E2 there is a 7.7% of Delete actions, while in E1 there is a 23.5% of Delete actions. In Figure 2 we can see the distributions. In E2 Delete actions are the least used type of actions. The next macro-pattern is related to the relationship between Create and Rename actions. In E2 the numbers are almost equal while in E1 and in E3 the numbers of Create actions are much smaller. We can see the comparison in Table 2.
Ratios
E1
E2
E3
Create/Rename Class Create/Rename Attribute
18/29 = 0.62 07/10 = 0.7
13/14 = 0.93 15/17 = 0.88
11/25 = 0.44 19/23 = 0.82
Create/Rename Operation 04/07 = 0.57 16/16 = 1 16/17 = 0.94 Table 2. Comparison of Create and Rename actions
Related to the previous macro-pattern, the relationship between the total number of classes and the Create Class action is examined. The ratios of total number of classes/Create Class actions are: in E1 13/18 = 0.72; in E2 11/13 = 0.85 and in E3 7/11 = 0.64.
Figure 3. Number of Create, Delete and Rename actions applied to a class element
4.2. Micro-Patterns The first micro-pattern is related to the distribution of actions. In E2, 9 from the 11 final classes of the diagram were created in the first 10 minutes of the experiment. In E3 in the first 10 minutes, 7 of the 7 final classes were created. We can see the distribution of actions in Figure 3. In contrast, in E1 classes were created and removed from the beginning to the end in the experiment. The next micro-pattern in both E2 and E3 was a long sequence of creation of classes. In E2 9 classes and also in E3 5 classes were created. Finally, the most common micro-pattern in all three experiments was to create an element, and rename it immediately from the default name assigned from ArgoUML. 4.3. Levels of Expertise The macro-patters of a low percentage of Delete actions, and the micro-pattern of a long sequence of Create Classes at the beginning might be related to a higher level of expertise. This can be because the problem was thoroughly understood, and then all the elements that were needed were created. This could be considered a top down, breadthfirst strategy, because first we define all the high level elements (classes), before defining the details (attributes and operations). In this experiment this strategy was used by the designers with more expertise. The macro-pattern of the almost equal number of Create and Rename actions means that the name chosen for a particular element remained without change. If on the contrary there are more Rename actions, the elements changed their name many times. Thus,
having an almost equal number of these actions might be related to a higher level of expertise. A high percentage of Create and Delete actions of classes might be related to a lower level of expertise. In support, S1 manifested that he had little experience making UML class diagrams. He only used a few attributes or methods in his diagram and used a large number of Delete and Rename actions. 4.4. Threats to Validity Using ArgoUML as the tool limits the scope of the results, because different tools may lead to different patterns. Also, its limitations when compared to a physical medium such as a whiteboard that offers more freedom reduce the patterns that can be found. Finally, the problem used is different from the ones in the industry. Therefore these results can not be applied to other situations. 5. Conclusion and Future Work We found macro and micro patterns related to the level of experience of the designer. These patterns could indicate that a good strategy is to define the classes at the beginning of the design and then to proceed with the details (top down, breadth first). On the contrary, if we create classes during the whole period we might not have grasped the problem at hand. Although at this point we do not have many macro and micro patterns, the simple ones that we found helped us understand how strategies are applied. In our future work more elements will be considered. For example parameter of methods, notes or other kinds of diagrams (use case, sequence diagram). All of these elements could be collected and analyzed. This also raises the question of which actions of the designer are the most significant ones. Thus, a major topic is how to achieve a better balance between the quantity of features examined in terms of level of significance. References [1] [2] [3] [4] [5] [6] [7] [8] [9] [10]
A. Baker, A. van der Hoek, H. Ossher, and M. Petre, “Guest editors’ introduction: Studying professional software design,” IEEE Software, vol. 29, no. 1, pp. 28–33, Feb. 2012. W. Visser and J. Hoc, “Expert software design strategies,” in Psychology of Programming. Academic Press, 1990, pp. 235–249. V. Popovic and B. Kraal, “Expertise in software design: Novice and expert models,” Proceedings of Studying Professional Software Design, 2010. S. Sonnentag, C. Niessen, and J. Volmer, Expertise in software design. Bibliothek der Universit¨at Konstanz, 2006. S. Sonnentag, “Expertise in professional software design: A process study.” Journal of Applied Psychology, vol. 83, no. 5, p. 703, 1998. B. Adelson and E. Soloway, “The role of domain experience in software design,” Software Engineering, IEEE Transactions on, no. 11, pp. 1351–1360, 1985. K. Dorst and J. Dijkhuis, “Comparing paradigms for describing design activity,” Design Studies, vol. 16, no. 2, pp. 261–274, 1995. W. Visser, “Designers’ activities examined at three levels: organization, strategies and problem-solving processes,” Knowledge-Based Systems, vol. 5, no. 1, pp. 92–104, 1992. “Text analysis utilities,” june 2012. [Online]. Available: http://cran.r-project.org/web/packages/tau/tau. pdf “Diagrams,” june 2012. [Online]. Available: http://www.fuka.info.waseda.ac.jp/∼jonatan/ref/RD.html