MEDMAP: Two programs for plotting maps of the. Mediterranean Sea. P.
Scrimger and A. Trangeled. The content of this document pertains to work
performed ...
SACLANTCEN
7-•:
tA • eiaro
........
:
;r'120
SA CLANT UNDERSEA RESEARCH CENTRE A.,IEMORANDUM
,I,,
.4
a n e M ED M A P:
S.....D •
!.
:
Two programs for plottinig maps of Mediterranean Sea
DTIC T IC 4the CTEF.
P. Scrimger and A. Trangel~ed
4i88 .19
June 1988 A
The SACLANT
Undersea
Research
Centre provides the Su;peme
Allied Commander Atlantic (SACLANT) with scientiric and technica;
assistanme under the terms of its NATO charter, which entered into force on 1 February 19,53. Without prejudice to this main task'nd under the policy directicn of SACLA.NT-the Centre also renders scientific and technical assistance to the Ind',2a
NATO nations.
This document is released to a NATO Government at the direction of SACLANT Undersea Research Centre subject to the following conditions:
"The
recipient NATO Government agrees to use its best endeavours to ensure that the information herein disclosed, whether or not it bears a security classification, is not dealt with in any manner (a) contrary to the intent of the provisions of the Charter of the Centre, or (b) prejudicial to the rights of the owner thereof to obtain patent, copyright, or other like statutory protection therefor.
"
If the technical information was originally released to the Centre by a NATO Government subject to restrictions clearly marked on this document the recipient NATO Government agrees to use its best endeavours to abide by the terms of the restrictions so imposed by the releasing Government.
Page count for SM-.207 (excluding covers) Pages
Total
i-iv 1-20
4 20
24
SACLANT Undersea Research Centre Viale San Bartolomeo 400 19026 San Bartolomeo (SP), Italy tel: 0187 540 111 telex: 271148 SACENT I
NORTH ATLANTIC
TREATY ORGANIZATION
A
SACLANT3N SM-207
MAKE-MAP and MEDMAP: Two programs for plotting maps of the Mediterranean Sea
P. Scrimger and A. Trangeled
The content of this document pertains to work performed under Project 21 of the SACLANTCEN Programme of Work. The docennent has been approved for release by The Director, SACLANTCEN.
o A~~~~c,v,, I
i•'
Issued by: Underwater Research Division r',•,
For_____or R&.'-F., [E] .•b U:JTh ,,,''ed SNlS onDe"
r-
I J H,•ttt~c:t
•
L,.
By .... .. ...........
j Di~,i!• ":....r
£' R. Thiele
Ds
Division Chief
88"1 S.
, . .A.
..
.
..
.. .
.
..
..
.
---
SACLANTCHN SM-207
I
InItentioUaally
blank pass
SACLANTCEN SM.207
MAKE-MAP and MEDMAP: Two programs for plottkig maps of the Mediterranean Sea P. Scrimger an'. A. Trangeled
Abstracts Two FORTRAN'progrsams MAKE.MAP and MEDMAP are describod which, when used together, will plot mape of all or any portion of the Mediterranean Sea, Exlamples are given which show the high degree of detail provided by the 2' rsolution of the databae. A description of how the maps ate created In the MAKE.MAP program by meaas of intermediate landmass matrices is given, and applications of thee landmass matrices are mentioned. A flow chart of the main staqgs of this program is given The landmass matrix is read by MEDMAP which uses an interpolating contour routine to plot the coastilie; i flow chart of the program is given.
FORTRAN Itinstl Keywords: UNIRAS
maps
'tor MAKE-MAP and MEDMAP axe also included. o
Mediterranean
-iii-I
o
modelling
o
SONDA
o
SACLAN'TCEN SM-207
Contents I. Introduction . . . . . . . . . . . . . . . . .. 2. Some sample maps ..........................
. ..
. . . ..
. . ..
3. The MAKE.MAP program ...................... 4. The MEDMAP program ...................... References
..
. ..
..
. . . . . . . . . . . ..
I 2 6 8
. . ..
. . ..
. ..
. 10
Appendix A - MAKCEMAP, a FORTRAN listing ...........
11
Appendix B - MEDMAP, a FORTRAN listing
15
...........
1. Introduction There is an ever-present need in any major research organization to be able to quickly and easily display graphical information. At SACLANTCEN the SONDA [1,21 system was used in post years to display such oceanographic information. This report presents two new computer programs which provide similar plotting capabilities to that provided by the SONDA system for areas located in the Mediterranean Sea. The advantages offered by these new programs are the increased resolution and the creatior. of intermediate plotting matrices which can be used in modelling applications. The MAKE-MAP and MEDMAP programs were originally developed to satisfy the requirements of an existing model in use at SACLANTCEN, namnAy the Mediterranean shipping distribution model 13]; however they can easily find application in other areas. Section 2 gives three examples of map production using the available database, these examples include plots of the eutire Mediterranean Sei, the central Mediterranean including 'he islands of Corsica, Sardinia and Sicily as well as the Italian coastline and finally the Aegean Sea. Section 3 describes the MAKE-MAP program and provides information on how the pre-plotting data matrix is created and Sect. 4 describes the MEDMAP program and lists the various output devices supported by the software. The two programs have been written in VAX FORTRAN and are currently running on a VAX 8600 with the VAX/VMS versivn 4.6 operating system. They are listed in Appendix A and Appendix B, respectively. The library plotting routines are all taken from the commercially-available graphics package UNIRAS.
' llllnlnnlil nlig tn
ill'il~i
li~lm.ninlimmb,.,,m•-1-=..
SACLANTCON SM-207
2. Some sample maps The examples shown in this section are designed to show the usefulness and ease of operation of the two programs. The first example produces a map of the whole Mediterranean Sea, It makes use of the entire mapping database defined from (30*N,8°W) to (460N,3T7E) in 2' steps. This database was originally created from "aseries of 10 charts of the Mediterranean 14] drawn using a Mercator projection at " scale of 1:1000000 at 38'N, In order to generate one of thesb maps, the user should follow these steps in VAX/ VMS DCL: 1. 2, 3.
S DEFINE DITI Device-1: [Directory-i]
$ IRN Devic=2.-[Directory.2JRAK.JAP $ ZUN Device_2:,Dirrctory_2]lNDHAP
Note that in step 1 the user must define the logical name 'DITA' to point to the directory which is to contain the hitermediate data matrix created by the program MAKE.MAP. Step 2 will run the MAKE.MAP program which creates the intermediate data matrix (see Sect. 3) and step 3 will run the MEDMAP program which plots this data matrix (see Sect. 4).
-2-
SICLAiNTO.N SM-207
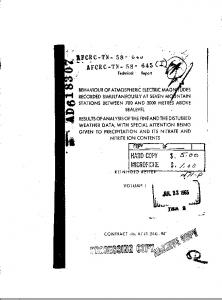
Example I Figure I was generated by entering the following data in re4ponse to the prompts issued by program MAKE-MAP: rater coordinates of lower left cell (aia. rater coordinates of upper right call (max.
30NOV6): 461371):
30NO 403371
This causes the MAKE-MAP program to read the entire database which consists of 688 separate input files. Each input file corresponds to a V° x V area of the Mediterranean Sea and contains 900 elements (-1.0 or 1.0) contained in 30 records of 30 elements per record. The plotting is done by program MEDMAP on the user selected output device.
4 6 -6-. .. -1 . .. . 4..-.... 44.-, 42.-L.-
40
;38-
I
f'
,' '
-
:
36
9 "i\•,
,
14 ,. . ..19 •
24
..29 .34
.' ,-40
•,
36 34
30
30 -6
-1
4
9
14
19
Longitude Fig. 1. The Meditersanesn Sea.
U'
4442
38
.--.
~34
46
-3-
24
29
34
SACLANTCEN SM-307
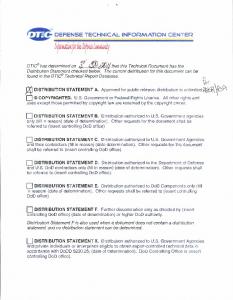
Example 2 Example 2 reads a subsection of the database which contains the islands of Corsica, Sardinia and Sicily &a well as the Italian coastline. The water masses include the Tyrrhenian Sea, the Ligurian Sea and the Adriatic Sea as well as the northern portion of the lonian Sea. This area is defined fron (36*N,7°E) to (46°N,20*E) and so the following data was entered in response to the prompts issued by program MAKE-MAP: Rater coordinates of lower left cell (min. 301106W): Rater coordinates of upper right cell (max. 46W37E):
36NOTE 46N20K
Note that in this example only 130 out of %e total 688 input files are used when generating &u intermediate plotting matrix. The resulting plot is shown in Fig. 2.
7
9
11
13
15
17
19 45
45
44-
-44
43 ;
-PI42
I-
_
_
*43
--
-
Q)
-42
2 41 -
-41
U 40 -J
40
39-
--.
38
7
-
,37 •- :- 7
9
-
•
. . 11
-
--
.""% ... 13
15
Longitude Fig. 2. The Central Mediterranearn.
-4-
II
-37
.. 17
38
39
19
SACLANTCRN SM.207
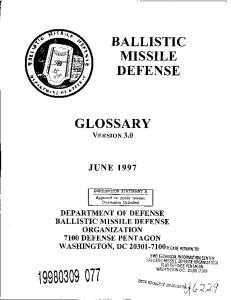
Example 3 Example 3 again uses a subsection of the database and illustrates some of the fine detail available at a resolution of 2 min. The map area is defined from (365N,22*E) to (42•N,29*E), and so the following data was entered in response. to the prompts issued by program MAKE.MAP: Enter coordinates o* lower loft cell (main. later coordinates of upper right cell (sax.
30NO6GV): 46N337):
351122Z 421i290
Note that in this example 49 out of the total 688 input files are used when generating an intermediate plotting matrix. The resulting plot is showrn in Fig. 3,
23.. .24 .. .. . . .25. . 26
42 22
41
-
27
28
29
2
41
-
40
-
'38-
38
.
37-
d'
-
37
..
-36•
,36 35
-35
-
22
23
24
25
26
Longitude Fig. 3. The Aegean Sea.
F.-
27
28
29
SACLANTCEN SM-207
3. The MAKE-MAP program The function of the MAKE.MAP program is to create a data matrix in a form which is suitable for subsequent plotting with the MEDMAP program. There are two important advantages to using such a two-stage process in obtaining plots. The first advantage is plotting speed since each subsequent plot (via MEDMAP) can be done withoat having to reaccess the full database. This is useful for example when the user wishes to preview the plot on his terminal before obtaining a hard copy (on a colour plotter, laser printer, etc.). A second advantage is that an intermediate landmass matrix is produced. This matrix is made up of (2' x 2') cells containing either a -1.0 (land) or a 0.0 (water). Landmass matrices of this type are often used in modelling applications, for example when modelling shipping movements [1], or modelling target locations (5] and could find future application in modifications to such programs as the RANDI-2 ambient noise model [6] where the position of landmasses could be used to identify the end points of the transmission loss function. The organizational layout of this program is shown schematically in the flow chart given in Fig. 4.
-6
SACLANTCEN SM-207
MAKE-.MAP Flow Chart
tr [Get lower-left ap Get winow tL
Inp
No
0K?
Calculate~e no. files
Full Med database (688 individual 0 1 xlqdata files)J
1
Read R-ed next file
rft
File DATA: LANDMASS.DAT
j
Fig. 4. A flow chart of program
MAKE-MAP.
-7-
_ _ and upper-right of window
_ut Check if input within limits tis
SACLANTCEN SM-2OT
4. The MEDMAP program This program represents the second stage of map production and is primarily a plotting routine designed to allow the user to produce output on the device of hichoosing. The program uses a 2D contour mapping routine which supports 10 levels of interpolative smoothing. The presently supported devices at SACLANTCEN are presented t0 the user as a 'form'. A copy of this form is given in Fig. 5.
NIEDNP V1.0
Seldev V2.O
Sardcopy devices COL COL4 VUG PRX PRXU CCP LASO T03
Tektronix 4691 A3 Tektronix 4691 A4 Tektronix 4692 Vugraf Printronix OPER-room Printronix user area Calcomp 5105 LASO Printer LN03 to USR$LASER
CRT devices VTT LTEK 4105
Local Vt00-series Local Tek4lXX-serie% Host Tek4105
NEWS INFO DELA UTIL EXIT
DSI news of 01-NoV-1987 UNIRAS info Delete completed plots Soon available Terminates image
( Press PF2 for HELP
Select output device: Fig. 5.
The plotting options form.
As before, the organitational layout of the program is shown schematically in a flow chart (Fig. 6).
8-
--
Ii
SACLANTCEN SM-207
MEDMAP Flow Chart
Start
Get output__
No
Input •
OK?
Open file
File DATA:AT'j -
MASS.D LA ND
-_
i set upr Viwp ti.
1*1 :
Fig.6.
A
flowchart of p~og rurmM ED M AP.
Select output devite
device
_ A
Check if input is within limits
SACLANTCEN SM-2oi
References [1] WINTERBURN, R.F.J. The SACLANTCEN oceanographic database, Volume I: Design criteria and data structure and content, SACLANTCEN SM-150. La Spesia, Italy, SACLANT ASW Research Centre, 1981. [2] WINTERBURN, R.F.J. The SACLANTCEN oceanographic database, Volume II: Access, interrogation and display, SACLANTCEN SM-151. La Spesia, Italy, SACLANT ASW Research Centre, 1981. [3] SCRIMGER, P. and HEITMEYER, R.M. A computer model of the movement of shipping in a hasin with application to the Mediterranean Sea, SACLANTCEN SR143, La Spezia, Italy, SACLANT Undersea Research Centre, 1988. [4] INTERGOVERNMENTAL OCEANOGRAPHIC COMMISSION, International bathymetric chart of the Mediterranean, Leningrad, USSR, Department of Navigation and Oceanography, Ministry of Defence (Under the autlority of IOC (UNESCO)), 1981. [5] HEITMEYER, C. and CARRIERE, J.-C. A hybr.d approach to multitarget tracking. SACLANTCEN SR-130, La Spesia, Italy, SACLANT Undersea Research Centre, 1988. [6] HAMSON, R.M. and WAGSTAFF, R.A. An ambient-noise model that includes coherent hydrophone summation for sonar system performance in shallow water, SACLANTCEN SR-70. La Spesia, Italy, SACLANT ASW Research Centre, 1983.
-00-
L
SACLANTCEH SM-207
Appendix A MAKE.MAP, a FORTRAN lUting PRGRAN NAKE_ NAP 2
cC IC 7 s 0 Io(
C C C C C C
11
C
PROGRAM DBSCaIPTION; Createm ille DATA:LANDASS.DAT from data taken from UsB:[SCXIRGaI.IOJU). "Theoutput file will contain coastline data for a s.eected area. AUTHORS:
13 C Alex Trangoled & Paul Scrimer 13 C SAiCLAN? Undersea Research Center, 14 C V. San Bartolomeo 400, 15 C 19020 La Spezia, Italy 1o C Summer 1987 C0RATIOD DATE: 17 C is C 19 C 20 C 21 C C HI S G 19 L O G 22 C :3 C Date I Name I Description 24 C-----------------+--------------------------------------------------------------3t C[chan-e.entry) 26 C 2T 36 COMMON IPOSI LATI,LAT2,LNGt,LWG2 29
CSTRNSTR,rBZ, VsII STNLATu,$TRe PROMPT ODrPUT..FZLLBBUPI,B?2.LZXN,FTIL
CHARACTEA*I CHARACTNR*2 CHARACTER0IO CHARACTSIe40
34) 31 32 33 34 35
INTEI3ER44 PARS&EPO ,AARAT(0,30)
30
37 38 39
REAL C
40 41 42
NA1IIR(120,O480)
-- ---------------------------------------------------------PRONPT = '(*,:1,A)'
CSTR = 'C' OUTPUr_ FIL
-DATA:lana~ss' =
43 44
C
45
--------- --- -- ---- -- --- ---- ----- ---- ----- --
OPEN (UNIT-S ,FILE= VIP ILB,SA TUEI•'RV', 46IFOXM-'UNFONNATTND'.EAR-09)
47
41 10 40
VfIT'B(d,PP.ONPT) 1(min. 3010600:
'nter coordinates of lower left cell
50
- 11 -
Ii
...
...
SACLANTCEN
52
$3
ra20
SM-207
RWD(5,'(A)',END-~1O) AUFFI sm-2=AAtsExP0S(DUFF, .1) zF(ISTAT.NEl.) GOtO 10
'rZTx(6.PR0Njp7) ý?1(max. 4SN3Yg):
'Miater coordinates of upper right cell
60ZtAD(5,'(A)',E#D-20) DtIFF2 ZSTAT-PANSE.POJ (DOFF2, 2) IF(XSTAI.NE.O) GOTO 20
an 01 02 03
- - - - - - - - - - -- - - - - - - - - - - - - - -I- - -
C 04 C Ct,
-
Calculate no. of cello In x direction (longitude)
00
07 08
No-CELLI (LNG2-LJIGI) .1 NO..ELIRI.NOCgLLICSO
mo C
Calculate no. of calls In y direction (latitude)
!30e30 data points In each call
71
XU-CELT-(LAT2-LATI)+1 80_"r-JVO._CELT*30
72 73 74 75
Set MATEIx counter to 0 In z and y direction
C
78 77
lEA TZ.0
78 80
Start reading data and fill
83 83 84
XTOTAL..FILES=(LAT2-LATI ,I)a(LNG2-LNtgI+l)
66 87
Do 110 LAT-LATILAT2 DO 100 LNG=LNGI,LNG2 ICUR-FfL=YCUtIRFIL+1
so
*
go 91 02
lF(LNGO.L9.0) TEE wNITE(PIL,o00) LAT,LNGS-i ELSE IIBITE(FIL,801) LAT.LNG ENOIF
03 *
NA TAXI
81 C
94 05 97
open cell-filo and fill up array with 30*30 elements
C
too 1
101 1012
10 104 105
too 107 108 too
0PUN(UNITe1O,FlLE*IUS6: (BCE INGER. kFOKIJ 'IFIL,IEADONFLt,STA TTJS EAR-90D) bXTcr(OeBe@) f~l(1 :1V).XCUR..FXLTOTAL-FILZS DO 11-30.1.-I RE*D(1O.'(A40)') LINE DO JJwf,3S RTJ-~ RNdD(LINEWJ:33). 1(Xl' END DO SED Do
110 -12
-
OLD',
SACLAN'OM SM-27
isa
CLOS(u rT.iO,sTTus 'KEEP')
112
113 C 114 115 110 117 11a 109 120) 121 122 100 123:
134 125 Ile
Write these *leamient
to the big array
DO 1181,30 DO Jj-1.,0O NATi7ZI(JJ+IIMTI, II.+1N9T1) In DO sND DO IIATZ .INA 71+30
AtJ.T(JJ, 1Y)*-1.
COTINUE IRi TZ=O
IRA 7T-ZIl 7T+30 CO.NTINE
136
137 C 138 Il0 690
-
COar'7IlJE
130)
131 C 132
Wri,;e range information to output file
WrITE(S) 134 WRITE(S) 1325 WRIE(s) 136WRZITE(S) 137 mnlm(S) 153 VRZT(i) 133
NOELEMIQ NoLENT Lz.l 10592+1 LATI Li72+÷
130 140
141 142
WRZIT (9) ((NATZIE(I.J), .-,iLoELBNI),J,-1.NOEBNT) CLOSE (UNIT=S,STITUS-'KWf ') STOP
143
144 C 145
146 900 147 54* C
WRITE(6, STOP
(I,A)' )
'KJUOR OPENING FILE "//FIL
140
Iro 909
STOP 'Error opening outfile'
151
M6 154 800 155 901 513
FONIT('+Ctrreant file 1,41O,'is no. FORNAT(II,'C',Z2.2, 1'N,Z2.2, 'U) FOANRAT(1,'C',Z2,2,I2',Z2.2,'E')
',13,'
out of ',13,'
files')
155
INTEGER FUNCTION PfASJIPOi(LOt' UNITIPS) , ROUTINE DESCRIPTIOM:
ISO C 161 C 163 C 163 C 164 C 161 C 10G C 157 C io
7h2is routine perses the coordinate ?eased In LOWBUFF If value is Illegal parse pos.1 else parme-pos0O ITIPE specifies if we are reading first or second value If parse pox succeeds, the commou block PO0 Is loaded with the approplate valnes
-13-
I.,
SACLANTOEN SM-297 lot C too C 17) C 1i1 C 172 C 173 C 174
Alex Trangeled & Paul Scrimgr SA$CLANT Undersea Research Center, V. San Bartolomeo 400, 19026 La Spezia, Italy
C
i17 C 170 C 177
AUTHORS:
CREATION DATE:
Summer 198T
C
C NHAN G E
17S C 170
t1• C Date I #am@ +e1i C-----------------182 C(changoeentryl 183
L OG
C
I Description +--------------------------------------------------------
C
104
COMMON /POS/
LATI.LAT2.L1GI.LNG2
181
CAlJ'ARA CTR40 BUFF,LObBVPF
:80 187
C..
1is
. ...
..
....
. ...
..
....
...
......
..
...
.....
.............
.....
PARSEPOS=O
189
?Convert string to uppercase
10o 193
CALL STROIPCASE(BUP,.LOYBUF?)
192 193
READ(BUFF(:2). 1 (12)', ERR80) ITENPI PlMad Integer value RZAD(BUFr(4:6),'(I2)',.R150) IZTEN2
104
105
IF U
196
(BUFF(3:3).9E.'N') GOTO 60 ((BUFF(d:O).NE.'E').AND.(aUPrfe:e).gE.'I,)) GOTO 60
197
199
PAXSEPOSwO 1Everything ok IF(ITTPE.Zq.1) THEN LATI=ITEMPI
2)
201 202
LNQIzITEAP2
203
IF(BCFF(@:d).E•. ' U') LNGIaLJGI*-1
204
ELSE IF(ITYPE.Eq.2) THEN
231 206
LA"2-ITENPI- 1 L10Q2.IZTEP2-1 XF(BVFF(f:#) .EQ. ' ') LNG2-4ING2e-l
207 208 20D
29-HA Y-198? 129-Ed V-108T
210
211
ELSE
212
213 1
214
21F
VRXTE(6,1(IXA)') 'Illegal type specified Check your prngra Ifl''ICHAR(7) STOP 'termination on error'
310
217
END IF
210
RETURN -------- . .-. .. - ... . . . .. --- -------- ------------------ ----------
21f% C 22t, S21
223
PARSEPOS-I !Invalid input YRIT"(f, ' (11, A)) 'nllejai coordinate apetifiee IPlesoe reenter 11'//echar(T)
224
REDu
22-
END
222
50
14-
SACLANTOiN SM-207
Appendix B MEDMAP, a FORTRAN listing PRUGRAN KXDNAP
1
2 C 3 C 4 C
SC o 7 s o
C
11
C
12
C
13
C
14
C
i1
C
C C C
16 C 17 C is C 19 C 20 C 21
C
22
C
23
C
34
C
25
C
20
27 •8
PROGRAN DISCRIPTION: This program plots the coastline data contained in the file BATA:LANDMASS.DAT, which Is created by AILMXAP. For additional Information pleasae refer to separate documentation. Link this program using the following coimand: 0 LYNK KJIHAP, USJ:[TXIANIaLBD.SUDSJRUTZNIS/LZBSL:UNXtAS/LLj AMO7101S: Alex
trangeled
Ar Paul
Scringer
SACLANT Undersea &*aearch Center, V. San Bartolomeo 400, 1902e La R1peia, ItAly CREATION DATE:
Summer 1987 C H A N GE
L O G
Datie I Name I Description C---------------.-------------------------------------------------------------c[changeentry] C
20 34)
31 32
33 34
INTEGER 2 2 2
STATUS, V.SZIZE, VNI.ADDM, NUDICOL
IStatus returned by systeam calls ellse of virtual memory (FRI needed £Starting address of the YM IDeclaration of the main part
ZINEG•I 2 2
LID*GBT..FN, LZIASN1U rU, LI'MENOY.. VP
see PAZI/VS System Services refarence !lde m
35
30 37 34
,Systeo routines - for documentation
39 40
41 43 43 46
CALL LrBIZIXZT7TIA CALL I;tOU72("LT_$T A4') C
tPrompt for outjmt covtce
Open the LANDMASS file to find the numbor of elements in If
47
4 4:
OP(UNO.T.9.E ZaG999, FLa
'DA TA. :LADMASS. DAT•.
ISTATUS- 'OLD ',FNOR=' UIFO•ANA TrRN.AUM
70
01 82
ARAD (9) LI AM (9) L2
fic. elemets InsI fro. of elements In T - 15 -
II
LY)
SACLANTCEN SM-2107
53
lClam. th. LANDMASS fille
54
65
CLOSE (UNIT-9,STATVS-'KEEP')
r5a
- - -
- - - - - - - -
IST C
- - - - - - - - - - - - - - - - - -
as C
Calculate the amount of VMwe need for this file. We'll n~eed 4 bytes for every element in the matrix.
to C 00
VN..SIZZSLleL2e4 ?Size we will need
61 02
41locate the VIM
03 C 04
05
STATVS.LIB*GETFNY(VN_ SIZE, VKLADDR) TF(NOT.STATVJS) CALL L1B*SIGNAL(XVAL(SrATTJS))
00 67
Call the map drawing part, passing the starting address and size of the VIEthat we allocated
as C 60 C TO
71 72
STATUS-NSDICOL(XVAL(VN.ADDE) *VN..SIZE) XF(.NOT. STA TUB) CALL LIBS*SINAL (XVAL(STA 111))
73
74 C.
baallocat. the VIE
75
To 77 74 7o
STA 1JSULIMSFlEE..VM(VMNSIZE, Vf.ADDA) rF( .NOT.STA 717) CALL LIBS*SXNAL (%VAL (STATVJS)) C
r.rmiaat. LTNIAAS
so at
CALL OCLUSE
83
63
CALL LXBSSNOD.
TYuRI
£4CALL EXI1(0)
No 87 pope
STOP 'Normal mucceumful termination' STOP 'Error opening landmass databam*'
as 89
END
9o 91NT71EG
F1JNCTION MBDICOL(Z, IZSIZE)
92
03
DIMENSION
Z(Issise),
94
1 1 DIMENSION
Z(400), 7(O00)
PVM area containing b.~dpping matrix ThbeZ- and 7-array are used with !the ship (or sub) tracks
-Z(2)
?Class limit array
05
90 07
tNA*ACTIR*el
FIZl NSTRZNQ
CEA5XACTMel
TESNO
96CIA*ACTIRei2
99 100
!File name string
101
102
LOGZCAL SEGSTO*E,681D
103
104 lob
k06 toy
I3at flag If UNIUAS ýwepnt storage io an
SZ87O.U
FAILSE. GRID - -FALSE. Z1ORv20. TORN-S.
108
log 1130
tPrompt for the sixe In the x direction
-
SACLANTORN SM-207 dIeitedmir(
IlCALL
112
'Enter IS In a:
113
1 200. '.
'
171G
114
1
11e 117 lti 119 120
WUD(VSflINFGe) IS
III 123
Z? (XS.9Q.0.) THIN b'RTX(O,*) 'ES NOT SPECIFIED - USING DEFAULT' 18.200.
124
ULSE
1123
120 120
1.1173(6,.) END IF
'IS SPECIFIED -
'.XS
13?
129
CALL del~odatr(
1290 130 131
)Do you want to plot a grid 7/8:!' )T'o, 1
7581)
132 1233I(YSOE.7)t(UOI.y) 134
GRID
-TAUB.
130
CALL dai*.dutr $Do you want to create a UNuI'ICT file YIN:
137 138
1 1
139
'
'7' :80
130
140
IF((rE8NG.Eq.'Y').0I.(TYUNO.1Q.'y')) SIGSTOIB x .TRUR.
141 143 143 144
?5.XSe0.8
141
ZTl1.
140 147
ITT71
140 C
Doftne only one class liait as we want to use two coiouru only
140
1510
ZZMR)-O.0
151
C
9153
lea*d binary f12*
194
199 10
OPU(111T-9,E119990,fILE&'DATA:LA1DNAsS.DAT', ISOAYVE. 'NJ I LD'I. PGA ' UFFOJ AM T ,ADOULY) M0
190 199
MUAD(f) NAIE MUAD(9) flITr
ISO
101
Eam (9) Lvai EAM(9) LJF02
102 103
READ (9) LA71 IUAD (9) L412
104
101
L162-LE02
100
LAT2.LAT2
10e
fPrImt Into to terminal
-17 -
SA(ILAMrON SM-307 17 171
3X71(O.800) NAZI ITTS.80a1) NAZY
173
RI7EE,9.02) LEWI kNITI(0,803) 1.J02
173 174
VnZrB(0.904) 1.171 V*PWZTE(6,800S)
IAT2
170
READ (9) (Z(J).J.1.NAXOXNAIT) I? 16CLOSE (NIZT-V,STATJS6'KW')) 170 1lag C Ili C 162
ZIntIats DNIMAS 13CALL
COPES CALL GRUNT
164
too
75 V3I73(0,*) FSuagmnt storage to ACTIVE' VnTyg(e.e) 'Opeftift 8**-Wat file Sit CALL *SIBRCII(l)
IF (SUGS3TORE)
1641 IS?
ISa lag 100)
S30 1?
101 102
Sot up class IlAMts. user coonizneate system and vlewprt
103 C 104 100,
ice 19,
CALL OXCL(ZZ.J,0) CAI.L GLINZT(FLOAT(LNGI) ,FLC.&T(L3.02).FrLoAr(LATI),FLOAT(LAT2),O .0.) CALL GVOfl7(OI.YOR.1S,rS)
log
104 C
Set colour oy contourlines to anti-beckgrOMWd
201
CALL UEOCOL(1)
303
3o C
Sot smoothinrg level and plot contour lines
24)5
CALL GSNTN(g)
2010
CALL OCNR2V(Z,NAXX.XAZY) Terminate GCNA27
20us 200 C 210 211
And draw ayim T-xo
213 214
CALL GLINIT(FLoA7(LiGii),JLOAT(L502).FLOAT(LATI),FLOAT(1.AT2),O.,O.)
219
CALL GTICICN(II)
CALL GAXZS(2,FLOAT(LAII),. .,FLOAT(LIT2)
220 221
222
C
.'LatitUde*J)
Draw secondary axis
223 224 211
220
CALL GAZOUI(FLOAT(L*(,2) ,fOAT(UTO) CALL GTZcNN(r7T) CALL GAIUS(-2,FLOAT(LATI).0..FLGAT(LAT2),
'es)
SACLANTORN SW.-207
22 129 23V0
CALL OAzORI(FLOAT(LNOGI).,FOAT'(IA 72)) CALL OTICNN(1T) CALL GAZIS-,FLoAT(LNIG).0. nFoAT(L1G2), 49S
231
232
CALL GOECOL(O)
!-33
CALL GGRORI(1) CAL. GUNDI(99. 999.31)
234
IF ONTID
235 236 237
IF (SNG5TORU) CALL a;sZCL(J) CALL OCNAXJ%(0)
235 230
madlcol.1
241
ARTURN
242 24.1
344 800 245 801 246 802 247 803 3t4s0804
FOANAT(IZ,'No. points In the Z-direction: '*I) FORNAT(1X,1Ne. points in tbe r-direction: .1,) P0ANAV(IX,'Lonsgitude minimum :' .0 FODNAI(1Z. 'Longitude max~imum :.X F0RNAT(LX. 'Latitude minimum '1,I)
149 $05
FORNAT(1I, 'Latitude maximum
2500 251 252ý
g998 Msa9
:"'.)
STOP 'Error during read of track data base' STOP 'Error opening landmass date base'
254EN 255
SURROUTZINE DSZIWSTRf(pRONPT.DEFAULT.AhSBb'E)
256 257
C
255 C
ROUTINE DLgCAIPTION.
C
,5
20o4 C
This routine writes PRoNPT on the terminal, end allows the user to ua. VHS'. line editing functions to modify or replace the default answer
;r.1 C 202 C 303
C
264
C
205
C
AUTHORS: Alex TraMeled SACLART Undersea Rtesearch Center, V. San Bartolomeo 400, 19028 La Spexia. Itcly
26C 207 C 205 C
209
C
C 2V1 C 272 C 373 C 214 C 2751 C 270
270
C
CRAUTION DATE:
Kay load CHffANGEa
Date
27? C-------------
2V5 C[Ciiiag*-4Ai~ryJ 270 C
game 4-
I Description
---------------------------------------------------------------
CEARACTE*(e)
PAWNT,
251
1
DEFAULT,
123
VOHNON /SMG.ID/
Iv
254 235
IF (ID.NE.O) CoTa 6
250
LOG
SACLANTCON SM-207
288 5
CALL 2M6G*CRBA TB..VIXATIAL.XrTB GARB(ID) CALL gNOae*AD-SlTRIN(ID,ANsbrERPAoNPT,
269 290 291
AM AN END
,,,,DBFAULT) ...
291 293
-20-
Initial Oistribution for SM-207
Ministries of Defence
SCNR Germany
1
JSPHQ Belgium DND Canada CHOD Denmark
2 10 a
SCNR Greece SCNR Italy SCNR Netherlands
1 1 1
MIOD France MOD Germany MOD Greece
8 15 11
MOD ftaly
10
SCNR SCNR SCNR SCNR
MOD Netherlands CHOD Norway
12 10
SCNR US French Delegate
MOD Portugal MOD Spain
MOD Turkey
1 1 1 1
Norway Portugal Turkey UK
2 2
SECGEN Rep. SCNR NAMILCOM Rep. SCNR
5
National Liaison Officers
2 1 1 1
MOD UK
20
NLO Canada
1
SECDEF us
62
NLO Denmark
X
3 2 3
NLQ Germany NLO Italy NLO UK NLO US
1 1 1 I
SACLANTREPEUR CINCWESTLANT/
1
NLR to SACLANT
COMOC.ANLANT COMSTRIKFLTANT
1 I
NLR Canada NLR Denmark
1 1
CINCIBERLANT CINCEASTLAN'T
1
NLR Germany NLR Greece
1 1
1 1 2
NLR Italy NIR Netherlands NLR Norway
I I
1 1 1 1 1
NLR Pcrtugal NLR Turkey NLR UK
NATO Authorities Defence Planning Committee NAMILCOM SACLANT
COMSUBACLANT COMMAIREASTLANT SACEUR CINCNORTH CINCSOUTH COMNAVSOUTH COMSTRIKFORSOUTH COMEDCENT COMMARAIRMED CINCHAN SCNR for SACLANTCEN SCNR Belgium SCNR Canada SCNR Denmarl
S.... . )C
NLR Belgium
I
1 1 I I
1 3
1
Total external distribution SACLANTCEN Library Stock
250 10 20
1 I
Total number of copies
280
-
.
..
.
i