and incorporated into digital circuit synthesizers, together with automatic test pattern generators. .... been properly validated, full-scale production can begin. .... be collected and compared to a digital signature stored on-chip in memory.
Making Complex Mixed-Signal Telecommunication Integrated Circuits Testable Gordon W. Roberts and Benoit Dufort Microelectronics and Computer Systems Laboratory, McGill University Montreal, CANADA H3A 2A7 Tel: 514-398-6029 Fax: 514-398-4470 http://www.macs.ece.mcgill.ca/~roberts/
Abstract - This paper presents a discussion on several methods that can be used to improve the testability of complex mixed-signal telecommunication integrated circuits. We begin by outlining the role of test and its impact on product cost and quality. A brief look at the pending test crises for mixed-signal circuits is also considered. Subsequently, we shall outline the evolution of test strategies with time, and their corresponding test setups for verifying the function of the analog portion of a mixed-signal circuit. The remainder of the paper will describe several circuit techniques for improving test access and providing built-in self-test solutions for telecommunication circuits.
1. INTRODUCTION Microelectronics continues to pack greater functionality into smaller, lighter and denser packages. This has been driven for the most part by the need for faster digital computation and larger data storage. As an example, today over 10 million transistors are integrated onto a single monolithic substrate and according to the Semiconductor Industry Association roadmap this number is expected to double in about one to one-and-a-half years. In order for manufacturers to be able to deliver quality products in reasonable times, an extensive testing program must be in place [1]. With digital systems, such test methodologies have been standardized, e.g. scan-chains, and incorporated into digital circuit synthesizers, together with automatic test pattern generators. Thus allowing the designer the ability to develop the test plan early on in the design cycle and to find the best compromise between functionality, performance and test. This new paradigm has come to be known as Design-For-Testability (DFT).
1
In parallel with the above developments, markets evolved which required the integration of both analog and digital electronics. One of the earliest applications of these so-called “mixedsignal” devices was a CODEC chip which acted to digitize a voice signal and transmit it through the telephone network in digital form and play it back to the listener in real-time. Today, telecommunication applications are several of the major drivers of this technology. Unfortunately, the combination of analog and digital electronics in denser, smaller packaging is creating a very difficult situation in which to access, test and verify the analog behavior. It is not uncommon to find analog components (e.g., phase-locked loops) embedded in a mixed-signal device with no external I/O access. Why should system designers concern themselves about test? Do they not already have enough difficulties worrying about their system design without including test concerns? Are electronic manufacturers prepared for the delays in the design cycle as designers struggle with test issues? These are some of the questions that seem to be on the minds of many designers when test concerns are brought to them. The first part of this paper will attempt to address these questions by explaining the role of test and the test difficulties encountered with analog circuits. The evolution of test complexity with time is outlined and functional testing of analog circuits is described. Subsequently, the rest of the paper will describe several circuit techniques for improving test access and providing built-in self-test solutions.
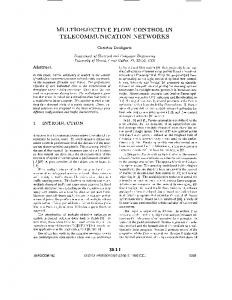
2. THE COST OF TEST The cost to produce mixed-signal devices is being dominated by their analog test costs. Today, we are hearing that the cost to test the analog portion of a mixed-signal device can be as high as 50% of their total product cost. While the benefits of new market opportunities generally offset these costs, it is the general trend that has the mixed-signal device manufacturer concerned. As the rate of introduction of new technologies seems to favor the digital portion of the mixedsignal device, it is not hard to imagine that in the next few years the total product cost of a mixedsignal device will be almost entirely due to the cost of the analog tests! This situation is depicted in Fig. 1 through the use of the two pie charts indicating the present and future situation. Clearly the situation on the right is a very difficult situation to be in. A product, even after succeeding in establishing itself on the market, will not persist and survive in the long run unless its performance 2
and cost effectiveness remains competitive relative to other ICs. It is therefore readily apparent to electronic manufacturers today that the cost of test for the analog portion of the mixed-signal device can no longer be ignored, as the eventual market winners will be those products that contribute to the lowest overall test cost. It has also been claimed that improved product testability can aid in getting a product to the market place faster even though the design cycle is prolonged. One obvious but incorrect approach that can be taken by a manufacturer with an eye on reducing the bottom line is to choose a less rigorous approach to testing. While this approach may reduce the direct cost of testing, the indirect cost incurred by a manufacturer for not thoroughly testing is many orders of magnitude higher. An IC manufacturer selling poorly tested devices will tie up their engineering team answering questions from their customers and handling their field returns, not to mention the cost for replacement. Clearly, this is not a situation that management wants to be in, and it is certainly not one that a designer wants to be in! It is therefore in everyone’s best interest to practice DFT techniques. With that said, the issue then becomes what DFT techniques are applicable to mixed-signal ICs. Before we address this, let us first identify what a good test plan is attempting to capture.
3. ANALOG FUNCTIONAL BEHAVIOR In contrast to digital circuits, the function of an analog circuit cannot be described by a closed form expression such as a set of boolean equations. This is largely due to the underlying complexity associated with an analog circuit, and a lack of description for this complexity. For example, the behavior of an analog circuit is directly dependent on the behavior of a transistor which is approximated by a set of complex equations containing over 50 parameters. The end result then, which distinguishes itself from digital circuits, is the fact that an analog function is always described by a nominal behavior and an uncertainty range. Fig. 2 illustrates the difference between the functional behavior of an analog and digital circuit where the analog uncertainty is characterized by a normal distribution with variance σ2 for lack of a better model. It is the goal of the designer to obtain the desired function within the acceptable range denoted between the limits XL and XU. What constitutes acceptable error depends on the application and it is impossible to generalize. Typically, it ranges from 0.1% to 1% of its nominal value, which is an extremely small amount. 3
4. MANUFACTURING EFFECTS The purpose of a test plan is to identify those devices that do not meet specifications once manufactured. There are generally two categories of manufacturing errors that give rise to a device failure: those caused by spot defects and those caused by process variations. One example of a spot defect is a piece of dust or debris landing on the surface of a wafer of an integrated circuit during its fabrication. The result can then have two different effects classified as catastrophic or parametric. A catastrophic failure is one in which the component is destroyed or uncontrollable. For example, the gate of a transistor is completely removed from the channel region of the transistor by a spot defect. Present day processing technologies have a spot defect density on the order of 1 - 2 defect/cm2. A parametric failure, on the other hand, is one in which the component appears to function but may not be within the desired tolerance limits. A transistor that may turn on and off but carries less current than normal is one example. This situation may arise by a spot defect removing only a portion of the gate. Process variation is generally the result of equipment fluctuations in alignment and performance. In IC manufacturing it leads to an uneven layer deposition across the surface of the wafer. On account of their independent effects on electronic circuits in general, process variations are categorized into two types: global and local. Global variation refers to the systematic variation of a parameter that occurs between the extremities of the device, e.g. transistor threshold voltage may vary systematically from one side of the die to the other. Local variation refers to the small (< 1 µm2) random differences that occur between physically adjacent components and gives rise to component mismatch. Both types of manufacturing errors will influence the behavior of a fabricated circuit. In the case of a digital circuit, its logic function is susceptible to spot defects and to a much lesser extent on global process variations. The latter effect is kept to a minimum by monitoring various transistors located in the test inserts distributed across the wafer and by ensuring that all of them are within specifications. The function of a digital circuit is essentially independent of device mismatches. Thus the prevailing test strategy for digital circuits is to identify the presence of spot defects instead of attempting to verify its full functional behavior by exercising all possible combinations of its inputs. The method consists of performing a functional test with a reduced set
4
of input test vectors. Test time improvements of several orders of magnitude are possible with this approach. However, unlike digital circuits, the function of an analog circuit is susceptible to all types of manufacturing errors and it is impossible to separate their effects. Thus, the only way to verify that the desired analog behavior has been captured by the circuit is to test its function directly and that it is within the very narrow range of acceptability. This requires very precise (repeatable) and accurate measurements. Efforts have been underway attempting to reduce the overall test time required to perform a suite of analog functional tests by identifying the least number of tests and their respective order through extensive circuit simulation and process characterization [2].
5. ANALOG TEST METHODS Analog and mixed signal testing is highly dependent on the maturity of the process and the type of circuit under test. This section outlines the different test methods and their evolution over time. 5.1 Test Evolution The ideal method for testing a mixed-signal circuit is to excite the system with a signal identical to that which the circuit experiences in the field. The response can then be analyzed and compared with the expected output. In some organizations this is often referred to as mission-mode testing. While a complete mission-mode test is impractical as the system complexity becomes large, it is common practice to verify the functional behavior of smaller circuits that make up the system and then perform a mission-mode test on one or two modes of operation. This has several advantages: (1) it reduces the overall number of tests that must be performed to verify all modes of operation; (2) it allows tests to run in parallel on similar blocks existing on different dies of the same wafer, thus reducing overall test time; and (3) it eases the error diagnosis procedure by pinpointing which part of the circuit is defective (a procedure that is becoming extremely important with large size transistor circuits). Generally, one does not extend this approach to the component level, such as the transistor, capacitor, or resistor level, as issues of access, measurement accuracy and guard-banding become the dominant issue. However, there is some evidence that suggests that this approach may be acceptable when the manufacturing process is mature and few failures are expected [3].
5
Fig. 3 illustrates a plot of test complexity, together with a typical manufacturing yield curve, as a function of time. At the very early stages of a design, a circuit has to be carefully characterized to verify proper functioning. This step is called design validation. All the specifications have to be met and a complex set of functional tests must be performed. Diagnosis can also play a major role at this stage since the design and process engineers want to know what is wrong with the defective parts in order to correct the design or manufacturing process. Test time is not really an issue because few devices will be tested and large-scale production is not started. Once the design has been properly validated, full-scale production can begin. However, process variations will affect the behavior of the circuit and functional testing is needed to ensure specifications are met. Test time then becomes a major issue and tests are chosen to ensure the functioning of each device in the shortest amount of time. As the manufacturing process matures (i.e., the yield increases), fewer devices fail and one may find those that do fail statistically clutter around a particular test. Hence, one can speed up the production and reduce the costs by eliminating those tests that rarely, if ever, fail. At this stage it is possible to use structural test methods, since the process variations are under control and cause very few faults. The length of time functional test have to be performed will depend on how aggressive the design is. With conservative designs, this could be a short period where functional tests are used to verify the yield. With aggressive designs, functional test may be the only viable alternative, and as such the structural test phase can not be reached. Nevertheless, even at the structural test stage, some form of mission-mode testing should be performed as a failsafe measure to ensure defective parts are not sent to a customer due to unforeseen, but routine, manufacturing changes, e.g., the stepper equipment used to make the wafer is replaced due to age and has caused a large shift in the parameters of the device. 5.2 Functional Testing The most basic analog functional measurement setup consists of a signal generator exciting the circuit-under-test with a known signal and an instrument to extract an appropriate parameter from the circuit’s output response. Depending on the purpose of the test, the signal generator may be generating a DC, sinusoid, square-wave, or some random signal having a known probability distribution function. Which signal is used depends on the type of measurement that is to be taken. However, a common aspect of all signals generated for analog testing is that they are repeatable or periodic. As noise is always present when performing an analog measurement, signal averaging 6
techniques are necessary to reduce the variability of the measurement to levels below the required acceptability range [4]. A common setup used to perform analog measurements on a mixed-signal device is shown in Fig. 4. It consists of a sinusoidal signal generator with variable amplitude and frequency control exciting the analog portion of the mixed-signal circuit and a true-RMS power meter operating over a very narrow, but tunable, frequency band. Today, DSP-based methods are used to perform these same measurements in a production environment as faster and more accurate measurements can be performed [5]. The state of the digital portion of the mixed-signal device may be altered and its effect on the analog circuit can be observed and quantified, e.g., idle-channel noise, crosstalk, etc. Tests involving sinusoidal excitation are probably the most common among linear circuits, such as amplifiers, data converters and filter circuits. Amidst all waveforms, the sinusoid is unique in that its shape is not altered by its transmission through a linear circuit, only its magnitude and phase are changed. In contrast, a non-linear circuit will alter the shape of a sinusoidal input. The more non-linear the circuit is, the greater the change in the shape of the sinusoid. One means of quantifying the extent of the non-linearity present in a circuit is by observing the power distributed in the frequency components contained in the output signal using a Fourier Analysis. Using the setup shown in Fig. 4, this would be obtained by exciting the circuit-under-test using a sinusoid and by measuring the power appearing at the output of the bandpass filter as it is tuned to discrete frequencies across the frequency band of interest. By comparing the power contained in the harmonics to that in the fundamental signal, a measure of Total Harmonic Distortion (THD) is obtained. By comparing the fundamental power to the noise power over a specified bandwidth, one obtains the signal-to-noise ratio (SNR). By altering the frequency and amplitude of the input sinusoidal signal, or by adding an additional tone with the input signal, other circuit transmission parameters can be derived from the power spectral density plot. Instead of using spectral-based measurements with deterministic input signals, probabilistic methods are sometimes used to deduce the behavior of an analog circuit. Although this approach is less direct than a spectral-based approach, it is usually easier to implement and to collect decision-making data. The basic idea behind this approach is that the probability distribution behavior of the output signal is directly related to the input probability distribution through the 7
circuit’s transfer characteristic. Analog-to-digital converters are often characterized in this manner. With a uniformly distributed input signal applied to an ideal converter one would expect a histogram of the output codes to be flat, with equal counts in each bin. Count deviations would then reflect a change in the code width in the circuit’s transfer characteristic, as well as a change in the monotonicity of the output code levels. Such behavior is often quoted as differential linearity error (DLE) and integral nonlinearity error (INL).
6. INCREASED TESTABILITY WITH TEST BUS The primary requirement of any test is the controllability and observability of the state of the device. In digital circuits, this is achieved by the non-intrusive scan-path approach and is practiced widely in the electronics industry. For mixed-signal circuits, analog test buses are used. Probably the most widespread method used to gain external access to internal nodes of a mixed-signal circuit is through the use of an analog test bus and analog switches constructed with CMOS transmission gates. When the circuit is in test-mode, the node of interest is connected to the analog test bus where a signal can be brought in or out from off-chip. If two analog buses are used, then a standard input-output measurement can be made in much the same way as that described in section 5. An example of this is illustrated in Fig. 5. To maximize the dynamic range of the test bus, a fully differential test approach can also be used. An obvious drawback to any of these approaches is the need for additional I/O pins, which in many cases may be hard to come by. Alternatives like multiplexing I/O pins with the test bus and other parts of the circuit not in use during the test phase have also been suggested. Care must be exercised when on-chip signals are passed through the chip’s I/O pins, as the load capacitance on a particular node is now increased significantly. In many cases, signals being driven off-chip should be buffered. It is imperative that the inclusion of an analog test bus be considered early on in the design phase to minimize the impact that the test bus will have on the circuit in normal operation. Over the past seven years a group of international companies and R&D institutions have been working together to define a mixed-signal test bus standard which is compatible with the existing IEEE 1149.1 boundary scan standard. The first milestone of the IEEE 1149.4 working group is to 8
introduce test bus facilities for interconnect tests at the board level. Access to internal analog cores is not an immediate concern, but combining the test bus facilities just described is one possibility. In combination with an analog test bus, it is possible to include some circuitry on-chip to facilitate the digitization of high-speed signals for off-chip access. An example of this approach is the early capture [6]. In this case, a comparator is used on-chip with external circuitry to digitize periodic analog signals.
7. BUILT-IN SELF-TEST SCHEMES With such high levels of integration possible today using submicron VLSI technologies, it is both feasible and beneficial to consider placing all or part of the test circuitry directly on the same die as the desired circuit. Referring back to Fig. 4 this would include the test stimulus, measurement circuitry, and equally important, the interconnect and control circuits. Some of the benefits are: (1) a facilitation of design-for-test, (2) a hierarchical test solution, as the test circuits can be used at all levels of the system, from the IC-level to the board and system-levels, thereby maximizing the return on the test hardware investment, (3) a reduction in interconnect length and device loading effects, and (4) a standardization which simplifies automation and the integration of test into present day CAD facilities. The following is a brief description of some of the circuit techniques that have been proposed for making mixed-signal circuits more easily testable using a functional testing approach. 7.1 Σ∆-Based Pattern Generation One of the earliest proposal for a fully integrated built-in self-test was that made by a group of AT&T engineers for verifying the monotonicity of a Nyquist-rate A/D converter circuit [7]. A linear ramp voltage is generated on chip and applied to the input of the A/D converter during the test. The output codes are then checked for monotonicity by comparing the present output code with the past code. A counter keeps track of the number of successful comparisons. The final count is then checked against the expected value and a go/no-go type of decision is made. The final count can also be retrieved for possible diagnostics.
9
An important drawback of this BIST scheme is the use of an untested analog ramp generator to verify an A/D converter. One can never be sure of the outcome of such a test, as an error in the pattern generator may be canceled by an error in the A/D circuit. Instead, an alternative approach can be used, one that makes use of the method of Σ∆ encoding. An N-bit digital signal can be Σ∆ encoded into a one-bit stream and converted into analog form using an analog filter circuit. By matching the frequency characteristics of the Σ∆ encoding scheme (i.e., the quantization noise) to the frequency characteristics of the analog recovery filter, high-quality signals can be generated on-chip. There are two approaches that can be used to generate the one-bit pattern: (1) an on-chip Σ∆ oscillator circuit, and (2) a memory-based pattern generation approach. In brief, the first approach is capable of generating higher-quality signals than the second but is not as area-efficient. A Σ∆ oscillator circuit [4] combines a digital resonator circuit having poles on the unit circle and a Σ∆ modulator without the use of NxN multipliers as shown in Fig. 6(a). The oscillator generates a one-bit pattern which contains the sinusoidal signal created by the resonator. The frequency of oscillation is set by the loop gain coefficient K and the external clock frequency fS. The amplitude and phase of the sinusoid is set by the initial conditions placed in the two multi-bit registers (blocks denoted by z-1). High-quality analog signals having spurious-free dynamic range larger than 90 dB have been reported with this technique. The memory-based pattern generation technique, on the other hand, can be incorporated into existing digital test structures, in particular, a boundary scan-chain or through a RAMBIST controller [8]. The net result is a near-zero overhead. The basic idea here is to truncate the one-bit output from the Σ∆ oscillator, capture it and simply cycle it through a scan-chain with feedback as shown in Fig. 6(b). Sequences as short as 100 bits with spurious-free dynamic ranges as high as 80 dB have been obtained with this method. One of the main advantages of memory-based pattern generation is the large number of signal types that can be generated using the same hardware. Single and multi-tone sinewaves, sawtooth signals and arbitrary band-limited pulses have all been demonstrated experimentally [8]. It should be noted that it is possible to generate high frequency signals using bandpass Σ∆ modulation to encode the bitstreams. Gaussian and raised cosine pulses are particularly useful for testing communication circuits. With the same approach, but using a slightly modified circuit, it is 10
possible to generate digitally modulated signals such as frequency shift keying (FSK), amplitude shift keying (ASK) and phase shift keying (PSK). A dual-tone multi-frequency signal generator using these techniques has also been implemented and tested. 7.2 CODEC and MODEM Circuits There are many ICs that contain both an A/D and a D/A circuit, and usually some additional digital signal processing (DSP) capabilities. CODECs and MODEMs are two popular electronic components that contain these components. One proposal for the self-test of such ICs was the socalled Hybrid BIST (HBIST) scheme [9]. Here it was suggested that the output of the D/A could be connected directly to the input of the A/D in a loop-back configuration. Digitally generated signals from an on-chip Linear Feedback Shift Register (LFSR) would be converted into analog form by the D/A circuit where it would then excite the A/D circuit. The digital A/D output would be collected and compared to a digital signature stored on-chip in memory. Unfortunately, the drawbacks to the HBIST approach make it impractical for production testing for the following reasons: (1) complementary errors in both the A/D and D/A circuit can mask one another resulting in bad devices being passed as good, (2) comparing the analog response with a digital signature ignores the fact that the response will vary with different devices and circuit conditions, and (3) the tests being performed are not the same as those performed in production. Nevertheless, the method does highlight the fact that the BIST electronics are all-digital and can be synthesized using standard digital CAD tools; an essential requirement of any BIST technique to succeed in the long-run. A technique that gets around the above shortcomings is the so-called Mixed Analog-Digital BIST scheme or MADBIST for short [4]. First, the A/D circuit is tested using excitation from a Σ∆ oscillator or a memory-based circuit. The parameter extraction circuitry (histogram collection circuit, narrowband filter or correlator circuit) is assumed to be a part of the DSP-core, in the form of hardware or software. Thus, all added circuitry is digital. A go/no-go decision is then made. Subsequently, another phase of the test is run whereby the D/A circuit is excited by a digital signal generated by the DSP engine or the Σ∆ pattern generator. Its analog response is then digitized by the A/D circuit. Once the D/A is considered functional, both data converters can then be used to measure other analog circuits on the chip, board, or in the system. 11
7.3 Transceiver Circuits MADBIST can also be applied to narrowband mixed-signal transceiver-type devices such as those that are appearing in today’s portable hand-held communication devices. A block diagram of a typical circuit is shown in Fig. 7(a). It consists of RF, IF and baseband stages. The RF and IF sections are largely all analog, whereas the baseband section consists of a mixed-signal RF and audio CODEC and a digital DSP-core. In its present form, the MADBIST scheme can be used to test the audio CODEC. By extending the frequency range and the types of signals that can be generated using the Σ∆ pattern generation approach it is possible to use these signals to excite the receiver section of the transceiver and measure its transmission characteristics. Moreover, they can also be used to verify the modulation/demodulation characteristics of the RF CODEC. This is illustrated in Fig. 7(b) where a one-bit signal generated by the Σ∆ oscillator is injected into the front-end of the IF stage of the receiver. By virtue of the frequency selectivity of the receiver, the quantization noise associated with the one-bit stream will be suppressed and a spectrally pure signal will traverse through the receiver to be analyzed by the DSP unit. This can then be repeated for the RF stage of the receiver. Practically speaking, however, creating spectrally pure signals for test in the 800 MHz - 2.5 GHz range is no easy task, considering the dispersion difficulties with injecting a test signal into the receiver’s front-end. Subsequently, as shown in Fig. 7(c) for the IF stage, the transmitter and receiver sections are connected in a loopback configuration, allowing sections of the transmitter to be tested. Repeating this approach for the RF stage would allow for a complete self-test of the transceiver. Experiments have successfully demonstrated this approach for signals centered around 455 kHz [10]. It remains to be seen how well this approach will work for higher-frequency signals, in particular in the RF band. 7.4 Phase-Lock Loops Another important component found in today’s communication systems is the Phase-Locked Loop (PLL). It is used in many applications for frequency synthesis, phase demodulation, clock distribution and timing recovery, to name just a few. A PLL is a mixed-signal device incorporating both analog and digital electronics in a negative feedback arrangement. A typical PLL operates on high-speed input signals (in some cases > GHz) but responds slowly to changes in the input signal (< 100 Hz). The PLL loop dynamics and its phase noise are the two main parameters of a PLL. The loop dynamics are usually characterized via an input-output phase measurement, and phase noise 12
via a jitter histogram. The first measurement can be performed on-chip using a phase-modulated test signal created via the Σ∆ pattern generation method and an on-chip phase extraction circuit consisting of a few logic gates and registers [11]. At the time of these writings, the authors know of no on-chip test scheme that can measure the phase jitter directly, or indirectly for that matter, that has been published in the open literature.
8. CONCLUSIONS As more and more integrated circuits combine digital and analog functions on the same monolithic substrate, the concerns of test can no longer be ignored as it is dominating the cost to manufacture these devices. It has been argued that to ensure their correct manufacture, the analog portion of the mixed-signal device requires some kind of functional testing in which its inputoutput behavior is analyzed. As the processes mature, it is possible to reduce the complexity of the test plan, but some limited set of functional tests (mission-mode) will be required. As chip density increases, it is becoming more and more difficult to access the analog portions of a circuit. Several built-in self-test schemes used to reduce the analog test burden have also been demonstrated. This paper has introduced possible solutions to the testing problems that are facing complex mixed-signal telecommunication circuits today. The reader will notice that few solutions (e.g. test bus BIST) are proposed to test even today’s telecommunication circuits. This paper has shown how an analog test bus can alleviate the problem access by providing external access to internal analog nodes. It goes without saying that a large research activity has to begin now to handle the test problems of future telecommunication applications. Without adequate test strategies, the future of telecommunication integrated circuits seems uncertain due to overwhelming economic concerns.
References [1]
B. Davis, The Economics of Automatic Testing, McGraw-Hill, London, UK, 1982.
[2]
L. Milor and A. L. Sangiovanni-Vincentelli, “Minimizing production test time to detect faults in analog circuits,” IEEE Trans. on CAD of Integrated Circuits and Systems, vol. 13, No. 6, pp. 796-813, June 1994.
[3]
Y. Xing, “Defect-Oriented Testing of Mixed-Signal IC’s: Some industrial Experiences,” Proc. of 1998 International Test Conference, pp. 678-687, Washington DC, Oct. 1998. 13
[4]
M. F. Toner and G. W. Roberts, “A BIST Scheme for an SNR, Gain Tracking, and Frequency Response Test of a Sigma-Delta ADC,” IEEE Trans. on Circuits and Systems -- II: Analog and Digital Signal Processing, Vol. 42, No. 1, pp. 1-15, Jan. 1995.
[5]
M. V. Mahoney, DSP-Based Testing of Analog and Mixed-Signal Circuits, IEEE Computer Society Press, 1987.
[6]
K. Lofstrom, “Early Capture for Boundary Scan Timing Measurements,” Proc. of the IEEE International Test Conference, pp. 417-422, Wash DC, Oct. 1996.
[7]
M. R. DeWitt, G. F. Gross and R. Ramachandran, “Built-in self-test for analog to digital converters,” AT&T Bell Laboratories, Murray-Hill, NJ, US Patent, No. 5,132,685, filed Aug. 9, 1991; granted Jul. 21, 1992.
[8]
B. Dufort and G.W. Roberts, “On-Chip Analog Signal Generation for Mixed-Signal BuiltIn Self-Test,” IEEE Journal of Solid-State Circuits, March 1999.
[9]
M.J. Ohletz, “Hybrid Built-In Self-Test (HBIST) for Mixed Analogue/Digital Integrated Circuits,” Proceedings of the 1991 European Test Conference, pp. 307-316, 1991.
[10] B. R. Veillette and G. W. Roberts, “A built-in self-test strategy for wireless communication systems,” Proc. International Test Conference, Washington, pp. 930-939, Oct. 1995. [11] B.R. Veillette and G.W. Roberts, “On-Chip Measurement of the Jitter Transfer Function of Charge-Pump Phase-Locked Loops,” IEEE Journal of Solid-State Circuits, vol. 33, no. 3, pp. 483-491, March 1998.
14
Manufacturing
Manufacturing
Analog Test Digital Test
Digital Test
Analog Test
(a)
(b)
Fig. 1. Relative product costs for a mixed-signal device (a) present day, (b) future (?).
pdf
good bad
0
XD
Digital Fn
(a) good
pdf
σ2 bad
bad
0
XL
XU
Analog Fn
(b) Fig. 2. Functional behavioral description: (a) digital (b) analog.
15
Test complexity
Yield (%) 100
Mission mode test Design Validation
Production functional test
Production structural test
0 Time
Fig. 3. Test complexity versus time
Analog Circuit Under Test Signal Generator Digital Inputs
Bandpass Filter
RMS Meter
Digital Portion
Fig. 4. Test set-up for a mixed-signal device.
16
Out
F/F
Analog Core In
F/F Transmission gate
Din AT1 Dout TDI AT1 AT2 AT2 TDO
Fig. 5. An analog test bus configuration.
∆Σ
z-1
+
z-1
+
LP Filter -K MUX
+K
(a) High-Speed Logic / Memory
0
Data Set clk
1s
F/F
F/F
F/F
F/F
Analog Filter
(b)
Fig. 6. On-chip signal generator: (a) Σ∆ Oscillator circuit: (b) Memory-based circuit.
17
signal generator
muxes
�
∆Σ OSC.
�
�
I Q
�
90
LO Σ
RF section
RF Codec Q
DSP
Audio Codec
I
IF section
Baseband section
(a)
�
�
I Q
�
�
∆Σ OSC .
�
�
90
LO Σ
RF section
RF Codec DSP Q
Audio Codec
I
IF section
Baseband section
(b) ∆Σ OSC. �
�
�
�
�
�
LO Σ
RF section
IF section
90
I Q RF
Codec DSP Q I
Audio Codec
Baseband section
(c)
Fig. 7. MADBIST applied to a transceiver-type device. (a) Highlighting the additional circuits for test. (b) Test of the IF receiver path. (c) Test of the IF transmitter path.
18