Feb 24, 2017 - Varje teknik diskuteras i detalj med ett interoperabilitetsperspektiv. De utmaningar och ...... Jim Barksdale. Conclusion and Future Work.
Making Interoperability Visible A Novel Approach to Understand Interoperability in Cyber-‐Physical Systems Toolchains
Didem Gürdür
Licentiate Thesis KTH Royal Institute of Technology School of Industrial Engineering and Management, Department of Machine Design SE-100 44 Stockholm, Sweden
TRITA-MMK 2016:09 ISSN 1400-1179 ISRN KTH/MMK/R-16/09-SE ISBN 978-91-7729-248-7
KTH School of Industrial Engineering and Management, SE-100 44, Stockholm, SWEDEN
Academic thesis, which with the approval of the Royal Institute of Technology, will be presented for public review in fulfillment of the requirements for a Licentiate of Technology in Machine Design. The public review is held in Gladan, Brinellvägen 83, Department of Machine Design, Royal Institute of Technology, Stockholm on 24 February 2017 at 13:00. © Didem Gürdür, 2017 Print: Universitetsservice US AB
Abstract Cyber-physical systems (CPS) are a result of multifaceted product development processes, which include multidimensional complexity. In cyber-physical systems development and production environments, these tightly integrated processes include different engineering disciplines, development and production departments, and software tools working together, where all of the technical engineering processes become strictly intertwined. Thus, decisions made by one stakeholder can have an impact on other stakeholders. Cyberphysical systems development and production toolchains, therefore, have a highly heterogeneous nature, and supporting toolchain architects is necessary for improving the understanding of the interrelationships between tools. To this end, this thesis mainly concentrates on the interoperability of CPS toolchains with an ambition to improve the understanding of interoperability and, as a result, guide toolchain architects to make cost-effective and sustainable decisions based on improved understanding. A literature survey was conducted to analyze the literature on interoperability with an aim to understand how the interoperability is assessed. Findings of the literature review showed that the existing methods mainly use maturity-like assessment models to assess interoperability and they focus on selective aspects of interoperability. These models use distinct levels and do not guide the stakeholders on how to improve the current state of interoperability. This revealed the need for a more flexible approach for assessing interoperability of CPS toolchains. The systematic literature review concluded by highlighting that visualization and visual analytics approaches point in promising directions for externalizing the knowledge accessed by assessment models with the opportunities the visualizations can provide. To study the interoperability situation in CPS development, a case study was developed and exercised with an ambition to test the applicability of the visualization approach. The case study illustrated the interoperability of a toolchain used for the development of an embedded closed loop control system with different visualization techniques. In total, three different visualization techniques were evaluated: (a) circular ideogram, (b) node-link diagram, and (c) balloon layout with a clustering algorithm as an extended version of node-link diagram, leading to some insights on what techniques are most suitable. Each technique is discussed in detail with an interoperability perspective. Moreover, the challenges and opportunities are explained which data visualization and visual analytics offer to make interoperability visible. This thesis concluded by highlighting that data visualizations and visual analytics are not only a method for understanding the interoperability of CPS toolchains, but also a necessity. Data visualization approaches create many opportunities to make interoperability finally visible and the CPS industry should focus its effort on appropriate data collection, usage, and sharing methods in order to best use data visualization and visual analytics technologies. Keywords: Cyber-physical Systems Toolchains, Interoperability, Interoperability Assessment, Data Visualization, Visual Analytics.
Sammanfattning Cyber-fysiska system (CPS) är ett resultat av mångfacetterade produktutvecklingsprocesser, som innefattar flerdimensionell komplexitet. I CPS:s utvecklings- och produktionsmiljöer, innefattar dessa tätt integrerade processer olika tekniska discipliner, utvecklings- och produktionsavdelningar, och programvaruverktyg som arbetar tillsammans, där alla tekniska ingenjörsprocesser blir strikt sammanflätade. Beslut som fattas av en intressent kan således ha en inverkan på andra intressenter. Verktygskedjor för CPS:s utveckling och produktion har därför en mycket heterogen karaktär, och det är därför nödvändigt med stödjande utvecklare av verktygskedjan för att förbättra förståelsen av sambanden mellan verktyg. För detta ändamål fokuserar denna avhandling främst på interoperabiliteten hos CPS:s verktygskedjor, med ambitionen att förbättra förståelsen för interoperabilitet och, som en följd, vägleda verktygskedjans utvecklare att fatta kostnadseffektiva och hållbara beslut baserade på förbättrad förståelse. En litteraturundersökning genomfördes för att analysera litteratur om interoperabilitet med syfte att förstå hur interoperabilitet bedöms. Resultaten av litteraturgenomgången visade att de befintliga metoderna huvudsakligen använder mognadsliknande bedömningsmodeller för att bedöma interoperabiliteten, och de fokuserar på selektiva aspekter av interoperabiliteten. Dessa modeller använder olika nivåer och vägleder inte intressenterna i hur det aktuella läget för interoperabilitet kan förbättras. Detta visade att det behövs en mer flexibel inställning för att bedöma interoperabiliteten av CPS:s verktygskedjor. Den systematiska litteraturöversikten avslutades genom att tydliggöra att visualisering och visuell analys visar lovande möjligheter för att externalisera den kunskap som nås av bedömningsmodeller med de möjligheter som visualiseringar kan ge. För att studera situationen gällande interoperabilitet i utvecklingen av CPS, utvecklades och genomfördes en fallstudie med ambitionen att testa visualiseringsmetodens tillämplighet. Fallstudien visade en verktygskedjas interoperabilitet, som används för att utveckla ett inbäddat slutet loopkontrollsystem med olika visualiseringstekniker. Totalt har tre olika visualiseringstekniker utvärderas: (a) cirkulärt ideogram, (b) nodlänkdiagram, och (c) ballonglayout med en klusteralgoritm som en utökad version av nodlänkdiagram, vilket gav vissa insikter om vilka tekniker som är mest lämpliga. Varje teknik diskuteras i detalj med ett interoperabilitetsperspektiv. De utmaningar och möjligheter som datavisualisering och visuella analyser ger förklaras dessutom för att synliggöra interoperabilitet. Denna avhandling avslutas med att lyfta fram att datavisualiseringar och visuella analyser inte bara är metoder för att förstå interoperabiliteten av CPS:s verktygskedjor utan också en nödvändighet. Datavisualiseringsmetoder skapar många möjligheter att slutligen göra interoperabilitet synlig och CPSindustrin bör fokusera sina ansträngningar på lämplig datainsamling, användande och delningsmetoder för att på bästa sätt utnyttja datavisualisering och visuella analystekniker.
To mom and Johanna for teaching me what love really means.
Terminology The meaning of many terms found in this thesis differ depending on the context in which they are used. To provide a common starting point for readers and avoid misunderstandings, some of the most important and commonly used terms are defined here. •
Cyber-physical Systems (CPS): A systems that includes integrations of computation, networking, and physical processes with feedback loops where physical processes affect computations and vice versa (Lee & Seshia, 2011).
•
Data: Reinterpretable representation of information in a formalized manner suitable for communication, interpretation, or processing (International Standards Organisation, 2008).
•
Data Visualization: The interactive presentation of data in a pictorial or graphical format to enable decision makers to see analytics presented visually, so they can grasp difficult concepts or identify new patterns (SAS Institute, 2016).
•
Exploratory Case Study: A study that investigates distinct phenomena characterized by a lack of detailed preliminary research, especially formulated hypotheses that can be tested, and/or by a specific research environment that limits the choice of methodology (Mills, Durepos, & Wiebe, 2009).
•
Information: Knowledge about things, facts, concepts, and so on that is exchangeable among users in a universe of discourse (International Standards Organisation, 2010).
•
Product Lifecycle: The entire lifetime of an end product, from the very first specification of its requirements up to the point at which it is disposed of. This lifetime is a combination of a number of phases, according to the sequence of engineering activities.
•
Review Study: A study that collects and critically analyzes multiple research studies or papers (Mills et al., 2009).
•
Tool: A software tool used to perform one or several engineering tasks in the product lifecycle.
•
Toolchain: A chain of software tools that supports different stages of the product lifecycle.
•
Tool Interoperability: The ability for a development tool to work with another tool without any special effort of the user and the ability to exchange information for this purpose across the product lifecycle.
•
Toolchain Interoperability Assessment: An action of applying specific documented criteria to a specific toolchain for the purpose of determining its interoperability status.
•
Visual Analytics: The science of analytical reasoning supported by interactive visual interfaces, such as data visualizations (Cook & Thomas, 2005).
Acknowledgements First, I would like to thank my supervisor, Jad El-Khoury. Without his help, support, and guidance, I would not have been able to do this. He always listens to even my craziest ideas with patience and finds a way to make them a reality. I have been extremely lucky to have a supervisor who cares so much about my work and who responds so promptly to my questions and queries. Jad, you are not only the best supervisor ever, but also a very good friend! I also want to express my appreciation to my main supervisor, Martin Törngren, for the opportunity to work with him and for his advice, feedback, encouragement, and enthusiasm throughout this work. I would also like to thank all the staff members in the Mechatronics Division who provided the wonderful working environment. In particular, I would like to thank Fredrik Asplund for the feedback, contributions, and suggestions he made throughout this work. Before anything else, he manages to pay attention to my critiques on politics, life, and even academia, and provided me a safe space to feel not alone. JinZhi, Xinhai, Sagar, Frederic, Mahmood, Daniel, Baha, and other Ph.D. students in the department, thank you for long talks and nice discussions during lunchtimes. Thank you, Vicki, for gracefully offering your time whenever I needed it and for supporting my veganism at heart. Some parts of this work were only possible due to support from the ITM School at KTH, ABB Corporate Research Centre, and the Embedded Multi-Core Systems for Mixed Criticality Applications in Dynamic and Changeable Real-time Environments project. Their role is gratefully acknowledged. Last but not least, I thank my family: my mom, Johanna, Mehmet, Meral, Tansel, Nilay, and Adile. But above all, I want to thank these four human beings—Okyanus, Polen, Armin, and Arya—for reminding me how beautiful the world is and how, as a big sister and aunt, I am responsible for making decisions accordingly. Completing this work would have been very difficult among the many other things in my life without the support and understanding provided by all of you. Thank you.
Contents Terminology Acknowledgements Contents
vi vii
viii
List of Appended Publications
ix
List of Additional Publications
ix
1 Introduction
1
1.1 Background .......................................................................................................... 1 1.2 Problem Formulation ........................................................................................... 2 1.3 Thesis Scope ........................................................................................................ 3 1.4 Thesis Objective .................................................................................................. 3 1.5 Thesis Outline ...................................................................................................... 4
2 Research Design
6
2.1 Case Study Methodology ..................................................................................... 6 2.2 Soft Systems Methodology .................................................................................. 8 2.3 Literature Review Study .................................................................................... 11 2.4 Exploratory Case Study ..................................................................................... 11
3 State of the Art
13
3.1 Interoperability................................................................................................... 13 3.2 Interoperability Assessment ............................................................................... 15
4 Data Visualization and Visual Analytics
18
4.1 The Origins of Data Visualization ..................................................................... 18 4.2 Case Study Findings .......................................................................................... 19 4.3 The Opportunities and Challanges ..................................................................... 22
5 Conclusion and Future Work
25
5.1 Conclusion ......................................................................................................... 25 5.2 Future Work ....................................................................................................... 26
Bibliography
28
APPENDIX A
31
APPENDIX B
33
Appended Papers
List of Appended Publications •
Paper A
Gürdür, D., Asplund, F., El-khoury, J., Loiret, F., & Törngren, M. (2016). Visual analytics towards tool interoperabilty: A position paper. In Proceedings of the 11th Joint Conference on Computer Vision, Imaging and Computer Graphics Theory and Applications (pp. 139–145). ISBN 978-989-758-175-5. DOI: 10.5220/0005751401390145 Gürdür developed the idea and wrote the paper. Asplund, El-khoury, Loiret, and Törngren provided feedback. •
Paper B
Gürdür, D., Asplund, F., El-khoury, J., & Törngren, M (2016). Assessing tool chain interoperability in cyber-physical systems: A systematic review. Manuscript submitted to the Journal of Systems and Software. Gürdür conducted the systematic literature review and wrote the paper. Asplund helped on the structure of the discussion and the paper. El-khoury and Törngren provided feedback. •
Paper C
Gürdür, D., El-khoury, J., Seceleanu, T., & Lednicki, L. (in press). Making interoperability visible: Data visualization of cyber-physical systems development tool chains. Journal of Industrial Information Integration. DOI: 10.1016/j.joi.2016.09.002 Gürdür developed the work behind the case study and wrote the paper. El-khoury provided feedback. Seceleanu and Lednicki from ABB Corporate Research Centre provided the case study.
List of Additional Publications •
Gürdür, D., Asplund, F., & El-khoury, J. (2016, June). Measuring tool chain interoperability in cyber-physical systems. In System of Systems Engineering Conference (SoSE), 2016 11th (pp. 1– 4). IEEE.
•
El-Khoury, J., Gurdur, D., & Nyberg, M. (in press). A model-driven engineering approach to tool interoperability based on linked data. International Journal On Advances in Software.
•
El-Khoury, J., Gurdur, D., Loiret, F., Törngren, M., Zhang, D., & Nyberg, M. (2016). Modelling support for a linked data approach to tool interoperability. In ALLDATA 2016: The Second International Conference on Big Data, Small Data, Linked Data and Open Data (includes KESA 2016) (pp. 42–47).
•
Shariatzadeh, N., Gurdur, D., El-Khoury, J., Lindberg, L., & Sivard, G. (2016). Using linked data with information standards for interoperability in production engineering. Procedia CIRP, 41, 502–507.
Chapter 1
“
I never am really satisfied that I understand anything; because, understand it well as I may, my comprehension can only be an infinitesimal fraction of all I want to understand about the many connections and relations which occur to me, how the matter in question was first thought of or arrived at, etc., etc.” ― Ada King Lovelace
Introduction This thesis discusses the interoperability needs in cyber-physical systems (CPS) toolchains and presents a novel data visualization approach in this context that helps understand the state of interoperability. This chapter introduces the background, describes the problem that has been studied, and explains the limitations and focus of this thesis. Moreover, this chapter outlines the thesis by defining the relationship between the appended publications and the chapters of this thesis.
1.1
Background
Today, new products are introduced to the market more rapidly than in the past, making it critical for the manufacturing industries to maintain competitiveness by facilitating the time from innovation to market. In the past decade, Internet-based systems and applications have provided the opportunity for industries to adapt to distributed development and manufacturing environments (Bi, Da Xu, & Wang, 2014). This opportunity brings new ways of thinking about whole production environments, which could help keep competitiveness and support streamlined. Now, for the first time in history, it is possible to move away from the conventional methods for product development to begin using new technologies—such as Internet of Things (IoT) or cloud computing—to achieve better-integrated environments. The industry is not far away from interoperable development and production environments where different software tools share information about product designs, connect requirements with processes, reflect changes throughout different development phases, and even tweet the state of manufacturing tools by sending short text messages all over the production plant (Lennartson, Bengtsson, Wigström, & Riazi, 2016). A substantial amount of research focuses on these emerging technologies and their capabilities. However, these new approaches do not focus on understanding, assessing, or analyzing the current situation, and they are not risk-free. Above all, they are costly and still not mature enough for industry-wide adaptation. While the need for interoperable toolchains for producing CPS is apparent, questions remain about how to proceed in this direction. One way to accomplish well-integrated toolchains is through homogenous tightly coupled tools from the same vendor. The problem with this approach, however, is that no vendor exists that can provide all necessary tools for the production of CPS. Secondly, this approach could lock in the company to working with only one or two vendors. Even though this solution has been used by the industry, especially for
2|
some parts of the production lifecycle, there are many issues in connection with it. Some of these issues and important factors are introduced in Section 1.2. Another way to achieve better integration is to use a loosely coupled approach, as prompted by technologies such as the Semantic Web and Linked Data. For example, Open Services for Lifecycle Collaboration (OSLC) is an open standard that works on specifications for integrating tools. Despite the opportunities of the standard, the solutions it provides are labor-intensive, costly to develop, and demand complex configurations and the adherence to integration standards (Biehl, El-Khoury, & Törngren, 2012). Irrespective of the integration approach taken, there will always be a need to integrate the vast number of tools in a toolchain. While much research has focused on the integration technologies (Asplund & Törngren, 2015), there is less focus on understanding. Furthermore, it is crucial to understand the existing interoperability state in toolchains in order to efficiently use the product development process, time, and resources.
1.2
Problem Formulation
CPS is a result of multifaceted product development processes, which include multidimensional complexity. Due to these tightly integrated technologies in CPS development and production environments, all of the technical engineering processes become strictly intertwined; as a result, decisions made by one stakeholder can have an impact on other stakeholders (El-khoury, Asplund, Biehl, Loiret, & Törngren, 2013). First, the development process includes different engineering disciplines working together. Each discipline is specialized based on different parts, functions, and applications of the end product. Moreover, for each discipline, engineers, developers, and designers are allocated according to different experience levels. These people work in different departments of the company with different work priorities. Development of CPS requires tool support for the tasks associated with the different engineering disciplines or departments throughout different phases of the product lifecycle. An effect of this is that the tools supporting each separate technical engineering process need to be adequately integrated with tools of other technical engineering processes. This becomes problematic since many of the tools employed throughout the different processes typically come from separate sources and are, hence, likely to be incompatible. These tools produce artefacts and product data, which include both internal and external dependencies. CPS toolchains have highly heterogeneous data formats and structures with a vast amount of dependencies, and “efficient development of these products necessitates support for dealing with the intricate relations between viewpoints, at the levels of people, models, and tools” (Törngren, Qamar, Biehl, Loiret, & El-Khoury, 2014, p. 746). As seen above, there are complex interdependencies related to technical, social, process, organizational, and management aspects of development efforts. Each of these interdependencies is accompanied with challenges that need to be handled to achieve more integrated, interoperable toolchains for CPS product lifecycle. Furthermore, some additional factors impact the decision-making process of improving interoperability. Three factors that have been identified for further investigation are as follows: •
Cost plays a big role for companies that want to remain profitable amid intense global competition. Bosch (2012) pointed out the importance of cost by exemplifying two alternatives for cost-effective production by comparing the efficiency improvement of development and reducing the development cycles. He stated, “No efficiency improvement will outperform cycle time reduction.” (p. 1) One should consider the cost in different aspects of the toolchain, such as the cost of tool addition, change, integration, maintenance, and so on, but also its effect on the cycle time reduction in relation to interoperability.
•
Furthermore, performance plays an important role in the interoperability of toolchains. Wellintegrated, interoperable toolchains drive continuous development and enable the seamless exchange of information and knowledge between tools. This need of a continuous development in the manufacturing industry is a fundamental requirement for the growth of competitive small and large companies (Vinnova, 2014), and it is directly proportional to the performance of interoperable toolchains.
|3
•
Another vital factor is the sustainability of the toolchain. This concept relates to the objective to maintain or improve current interoperability while reconciling ecological, economical, and ethical concerns. The associated discussion about sustainability focuses on spanning the lifecycle of products and services with the aim to minimize negative environmental impact and conserve energy and natural resources during the product lifecycle. There are no known methods that analyze the interoperability in toolchains from this sustainability perspective. Therefore, it is important to consider the sustainability of development and production environments while aiming to understand and, in the long term, improve the interoperability.
To this end, this thesis mainly concentrates on the interoperability of CPS toolchains with an ambition to improve the understanding of interoperability and, as a result, guide toolchain architects to make cost-effective and sustainable decisions based on improved understanding.
1.3 Thesis Scope The research proposed in this thesis is mainly focused on how to improve the understanding of the interoperability of CPS development and production environments. The purpose of this research is to understand the complex nature of interoperability, in order to support toolchain architects in assessing the current interoperability status and making decisions on improvements. Given the challenges discussed in Section 1.2, this thesis takes an approach of using information visualizations and visual analytics for improving the understanding of interoperability in CPS toolchains. This thesis investigates the use of information visualization techniques and technologies to gain a better understanding of the interoperability in CPS toolchains. It does not, however, use these technologies to specifically target the challenges related to the cost, sustainability, and performance of the toolchain. An exploratory case study was conducted as part of this thesis to test the applicability of the data visualization approach. This case study focuses on some aspects of the toolchain and includes some stakeholders. The objectives of the case study do not relate to the realization of the application of the end product, but instead focus on the relationships between tools within the toolchain. Thus, in brief, the study aims to visualize interactions between tools at different stages in the design flow to guide toolchain architects to understand more about the current interoperability situation and help them to evaluate and make better decisions according to the visualizations. The thesis also promotes data collection for enabling data visualization generation and data analysis about the toolchains, yet it does not exclusively include guidelines for a systematic way to undertake this action.
1.4 Thesis Objective The origin of the present work lies in the consideration that assessing the current state of the interoperability in toolchains would enable decision makers to better understand the situation and make decisions in an analytical, knowledge-intensive way. Therefore, the main hypothesis can be summarized as follows: Understanding the existing situation of interoperability in toolchains is a prerequisite for improvement of interoperability. Therefore, in consideration of literature on interoperability assessment, it is possible to reuse existing approaches to yield tangible benefits in toolchain interoperability context and assess these approaches using an adequate method, such as visualizations, to utilize the understanding and eventually improve the interoperability. Based on the problem statement and the scope of this research, one main research question and three derivative research questions were defined: •
Main Research Question: How can one improve the understanding of the interoperability of CPS toolchains for the purpose of assessing their status and making improvement decisions?
•
Research Question 1 (RQ1): What is the main focus of current research on interoperability assessment?
4|
•
Research Question 2 (RQ2): How can existing approaches for interoperability assessment be adapted to handle interoperability during CPS development and production?
•
Research Question 3 (RQ3): How feasible are data visualization techniques to improve the understanding of interoperability in CPS toolchains?
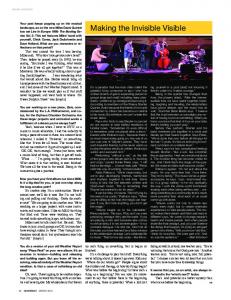
1.5 Thesis Outline The overall plan for this research is shown in Figure 1.1. The timeline is divided into four main phases: preliminary studies, literature review, defining the research problem, and research design to solve the problem. Preliminary studies were done during the first six to eight months of the study, when earlier research and relevant literature were investigated to understand the new research area. This lead to the idea about using the information visualization and visual analytics approach, which was later developed and then presented in Paper A. Afterward, the literature review process was initiated to answer RQ1 and RQ2, as outlined in the above subsection. The systematic literature review examined the existing approaches to assessing interoperability and the specific needs of CPS toolchains. These needs and transferable concepts are presented in Paper B. Then, a case study was conducted to investigate the applicability of the proposed information visualization approach and was presented in Paper C.
Figure 1.1 Timeline of the research leading to licentiate.
|5
This thesis is organized as follows: Chapter 1 provided an introduction to the topic under discussion. The background, problem formulation, and scope of the thesis were presented in this section. The problem definition was described briefly and research questions were presented. In addition, this chapter provided the outline of the thesis and described the relationship between the thesis chapters and the appended publications. The discussion summarized in this section relates to Paper A, Paper B, and Paper C at different levels since they all summarize the need for interoperability. Chapter 2 describes the research design adopted in this thesis by presenting the case study methodology (Fidel, 1984) and soft-systems research methodology (Checkland & Scholes, 1990). The chapter provides clarification on the research design and the applied systematic literature review process and protocol, in addition to a brief explanation of the exploratory case study carried out. Chapter 3 presents the details of the state-of-the-art. The literature review study is conducted for understanding the existing approaches on interoperability assessment. The most cited interoperability assessment models are investigated through a systematic literature review, and findings are published in Paper B. This chapter summarizes the research presented in this paper and answers RQ1 and RQ2. Chapter 4 explains the information visualization approach and provides details about the exploratory case study, where the applicability of different visualization techniques and clustering algorithms is discussed. This chapter summarizes the research presented in Paper C with an aim to answer RQ3. Finally, Chapter 5 concludes the thesis by recapitulating the findings of the research and presenting the areas where future efforts will be devoted.
6|
Chapter 2
“
The popular view that scientists proceed inexorably from wellestablished fact to well-established fact, never being influenced by any unproved conjecture, is quite mistaken. Provided it is made clear which are proved facts and which are conjectures, no harm can result. Conjectures are of great importance since they suggest useful lines of research.” ― Alan Turing
Research Design A methodology is a system of methods used in a particular field. In the context of software engineering, a methodology is a collection of procedures, techniques, tools, and documentation guidelines that help system developers in their efforts to implement a new information system (Avison & Fitzgerald, 2003). This chapter summarizes the methodologies used in this thesis. The research conducted in this thesis aimed to contribute toward a better understanding of interoperability in CPS toolchains. Such an understanding can then lead to further research on identifying important aspects for assessing and improving the interoperability. These objectives are mentioned in the form of research questions in Section 1.4. This chapter aims to position the research methodology adopted to find answers to these research questions. To this end, the chapter describes case study methodology as the main research methodology in Section 2.1 and soft-systems methodology as the problem-solving methodology in Section 2.2. Moreover, the chapter briefly explains the literature review study and exploratory case study in the remaining two sections.
2.1 Case Study Methodology In this thesis, case study methodology (CSM) is used as the main methodology to understand the interoperability in CPS toolchains based on a particular case study from ABB Corporate Research Centre, in order to validate the applicability of data visualization technologies. One of the reasons that CSM is adapted as the main methodology is the complex, multidimensional nature of the toolchain interoperability, where qualitative and quantitative research is needed. Since the early 1900s, CSM has had a long history across several disciplines. Case study methodology was viewed as a useful methodology that assisted researchers in making acceptable interpretations from events outside the lab that were initially within the discipline of anthropology. Consequently, the importance of this research strategy increased, and it is used for identifying rich sources of data, emerging into a method that combines both qualitative and quantitative research. Although, initially, the methodology was only used in the social sciences, the case study approach has gained wider popularity and has been found to be especially valuable in practice-oriented fields.
|7
The analytical research paradigm is insufficient for investigating complex real-world issues, such as those involving humans and their interactions with technology. Therefore, case study methodology is an ideal methodology for complex, multidimensional problems when a holistic, in-depth investigation is needed (Feagin, Orum & Sjoberg, 1991; Shneiderman & Plaisant, 2006). CSM plays a crucial role when one analyzes a particular organization or system with the aim of improving its functions. Nevertheless, it is always the goal of the researcher to generalize the findings of the individual case in which the case study methodology is applied. This goal obliges researchers to discuss the validity of their research, which will be more deeply examined later in this section. Fidel (1984) stated that “case studies are appropriate for investigating phenomena when: •
a large variety of factors and relationships are included,
•
no basic laws exist to determine which factors and relationships are important,
•
when the factors and relationships can be directly observed.” (p. 273)
Given the applicability criteria posed above, CSM is a suitable methodology to understand the need for interoperability assessment, and the importance of the relationships, roles, and stakeholders. Stake (1998) stated, “As a form of research, case study is defined by an interest in individual cases, not by the methods of inquiry used.” (p. 236) In other words, what is crucial to case study research is not the methods of investigation, but the object of study. In a broad sense, both the qualitative and quantitative research strategies are establish either on a theory (Glaser & Strauss, 1967) or surveys (Nachmias & Nachmias, 1981). However, case study as another research strategy has no specific requirements guiding the methodology. For instance, Yin (1994), as one of the well-known case study researchers, stated that there are no tangible guidelines on the design of the CSM. Such flexibility on the requirements side of the methodology could be both a strength and the weakness of the approach. The discussion about favorable and unfavorable sides of the methodology is not a particular focus of this thesis. Yet I would like to mention some criticisms of the CSM and provide brief explanations on how they have been considered in this research. One important criticism that CSM receives is the risk of selecting poor cases and, as a consequence, the generalization of the findings are weak. It is generally desired to seek a set of generalizable results out of a study. In spite of agreeing with the opinion that choosing a case that represents reality is a necessity, it is also crucial to underline that understanding a practical, context-dependent problem and building knowledge in this, given that narrow context, is still as valuable as the general, theoretical, context-independent knowledge. Above all, a case study can still contribute to scientific development even with results that cannot be generalized (Flyvbjerg, 2006). As Sykes (1990) mentioned courageously, in certain circumstances, it is very difficult or even impossible to use methods other than case studies. Nevertheless, carefully designing a case study could avoid, or at least lower, the risks that come with using CSM. Increasing the integrity of the research is one of the most important actions to avoid these risks. Using validity tests for determining the integrity of case study research is mandatory. Contrary to traditional belief, validity is beyond internal/external validity tests. Miles and Huberman (1994) summarized five approaches to achieve the integrity or rigor of validity in CSM. These approaches are construct validity, confirmability, internal validity, external validity, and finally, reliability. Construct validity: Emory and Cooper (1991) outlined construct validity as the validity that ensures sufficient operational measures for the investigated concepts. In another words, it “testifies to how well the results obtained from the use of the measure fit the theories around which the test is designed” (Sekaran & Bougie, 2010, p. 173). To achieve construct validity in CSM, one needs to develop its establishment through evidences from earlier studies. In this thesis, an extensive literature review examined different resources and we used establishing a chain of evidence as a practice to construct validity. Confirmability: Confirmability is the validity that other researchers could use to satisfy themselves about the research results. One should use data management techniques to ensure the confirmability for allowing
8|
other researchers to observe the chain of evidence in the study. By giving access to test data, a researcher provides an opportunity for third parties to review and, hence, can warrant confirmability. The data collected during the case study is, therefore, available if one needs to repeat the study to ensure confirmability. Internal validity: Internal validity, or credibility, refers to the identification of cause-effect or causal relationships that have certain influences on variables that have been considered for a research study. In other words, internal validity checks how well the case is studied by ensuring the effect of each variable during the study. The emphasis on constructing an internally valid research process in CSM lies in establishing phenomena in a credible way (Emory & Cooper, 1991). In contrast to qualitative research, which mainly deals with the generative mechanisms and causal powers to establish phenomenon in a credible manner and does not interfere with this cause-effect relationship, case studies aim to locate the generative mechanism that helps in determining the influences to the real-world phenomenon. In this thesis, internal validity is established using the following methods to demonstrate the internal consistency of the information collected: •
using case analysis, assurance of internal coherence of findings,
•
considering expert reviews,
•
developing diagrams, illustration, and data matrices
External validity: External validity, or transferability, is the validity to check the replication of research findings beyond the proposed research case studies (Emory & Cooper, 1991). CSM helps to accomplish analytical generalization where the findings are generalized into a wider theory. Using multiple case studies and comparing the findings of these cases by replicating the logic is chosen to achieve this generalization aim. However, at the time of thesis writing, these additional cases had not been conducted. Instead, this is suspended to the later stages of the research were more mature findings would guide forward for generalization. Reliability: Conclusively, the test of reliability, or dependability, contracts with the ability of other researchers to carry out the same study and achieve similar results (Emory & Cooper, 1991). In case studies, the problematic side of this type of validity is the assumption of the existence of one, a single reality that could be studied repeatedly. Since imitating the same research depends on the researcher's data collection and methods approach, it is vital to perform traceable case study procedures and to have proper documentation. In this thesis, the case definition, data collection method, and results are shared to ensure reliability. Last but not least, Flyvbjerg (2011) brought the definition of the case study up for a wider discussion and examined the misunderstandings about the CSM. Flyvbjerg uses the definition from the Penguin Dictionary of Sociology (Abercrombie, Hill, & Turner, 1984): The detailed examination of a single example of a class of phenomena, a case study cannot provide reliable information about the broader class, but it may be useful in the preliminary stages of an investigation since it provides hypotheses, which may be tested systematically with a larger number of cases. In addition to the objection to the definition that it gives wrong interpretations about the case study, which is so oversimplified as to be grossly misleading, Flyvbjerg also redefines the CSM as follows: A technique for detailed exploratory investigations, both prospectively and retrospectively, that attempt to understand and explain phenomenon or test theories, using primarily qualitative analysis. This definition describes exactly why and how I intend to use CSM in this thesis.
2.2 Soft Systems Methodology Interoperability in CPS development requires the correct adaptation of many heterogeneous, complex systems interacting in different phases of the product lifecycle, often with humans included in the loop. As mentioned in the first chapter, there are usually several stakeholders with different ideas on what is important or, at least, what is most important. These stakeholders have different roles and positions in the company, which require different responsibilities. For instance, a product developer focuses on the end product, while a
|9
toolchain architect concentrates on the integration scenarios of the toolchain with an aim to increase its interoperability and potentially improve the efficiency of the end product development. At the same time, the project manager is more concerned about the overall project from business and management perspectives. Besides the main CSM methodology, this thesis also introduces a problem-solving methodology. This methodology aims to structure the interactions between the different stakeholders in the case study and ensures the validity concerns introduced in the previous section are addressed. The choice of problem-solving methodology is soft systems methodology (SSM), which is used to analyze human activities and identify user requirements and activity as the basis for subsequent system design (Checkland & Scholes, 1990). For problems such as interoperability, SSM is an appropriate methodology that is not “formulated as a search for an efficient means of achieving a defined end” (Checkland, 2000, p. 316). Despite the exploratory goals and heterogeneous context of this thesis, SSM allows for arguing from different perspectives while actively interacting with the research objectives. In this way, it is possible to support the stakeholders with the experience of visualization while ensuring that they were the primary decision makers in the assessed solutions. As detailed in the next section, I eventually chose to focus the discussion on one pertinent perspective—that of the toolchain architect. The SSM artifacts found below are those related to this perspective, while others are left out for the sake of clarity. For the cases in which these artifacts are not self-explanatory, I refer the reader to the Section 2.4 about the exploratory study, which contains a corresponding textual description of the case. The use of SSM in this thesis, and the corresponding SSM artifacts, are outlined in the steps described below, which are taken from Checkland and Poulter (2010). 1.
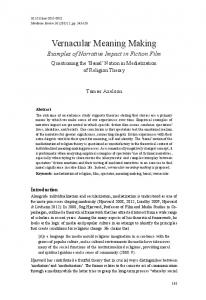
Identify the initial situation that is seen as problematic: SSM starts with drawing a so-called rich picture (see Figure 2.1) of the situation at hand and performing analyses. In this case, this entails drawing the interoperability context and the stakeholders identified as having an important role in decision-making concerning toolchains in CPS development for product lifecycle (PLC). The picture is a result of several meetings with ABB Corporate Research Centre to test the structure of the interoperability problem in toolchains and the development processes involved in the case. There is no commonly agreed-upon syntax for the creation of the rich pictures in general. A rich picture should consist of symbols and sketches that can contain as much information as deemed necessary. The purpose of the picture is to inform stakeholders about the problem being described in an unstructured way. “The real value of this technique is the way it forces the creator to think deeply about the problem and understand it well enough to express it pictorially (a process is known as action learning)” (Avison et al., 2003, p. 398). However, as Williams and Hummelbrunner (2010) pointed out, “It is important that the picture should not structure the situation (as in a logic model or process chain). The whole point of a rich picture is to reflect as much going on as possible without privileging, predetermining, or presuming a particular point of view.” (p. 227)
10 |
Figure 2.1 Rich picture of the interoperability problem.
2.
Make some purposeful activity model: The second step of SSM is to model the system as a meaningful activity from pertinent perspectives. This starts with so-called root definitions (RDs), which are statements that concisely describe the system of interest. The RD describing the tool chain architect’s perspective I have chosen to focus on is the system that supports the toolchain architects to understand and make decisions according to real data about the tool interactions in order to reach better interoperability in CPS toolchains. To model the system, data collection and visualization techniques are used. For this purpose, the activity model in this step is defined to conduct the case study. The corresponding activity model is found below (see Figure 2.2).
| 11
Figure 2.2 The Activity Model.
3.
Question the real situation, define the action needed to improve the situation, and take that action according to the activity model: The third step aims to compare the results of the executed activity model with reality, draw insights from the comparison, and determine ideas for improvements. Checkland (2000) suggested four ways to perform this comparison: •
Unstructured discussions
•
Structured questioning of the model using a matrix approach
•
Scenario or dynamic modelling
•
Real-world model using the same structure as the conceptual model
This step is the real powerhouse of the methodology, and in this thesis, it involves unstructured discussions focused on the findings of the real-world case study. Therefore, the outcome of using the activity models to assess pertinent activities is shared in Chapter 4. A dedicated chapter is used for this step because it explains and discusses three different visualization techniques to visualize the interoperability of an example toolchain in detail.
2.3 Literature Review Study The first stage of this study is focused on analyzing the literature on interoperability and, especially, understanding the need to assess interoperability. An extensive study of the literature was undertaken to reveal
12 |
the characteristics of interoperability assessment models and to identify concepts that could be valuable to transfer to the CPS toolchains for interoperability assessment. The literature survey is conducted according to a protocol, and the procedures are adopted from Kitchenham et al.’s (2010) guidelines for this purpose. This protocol can be found in the Appendix A and addresses the following headlines: research questions, search processes, inclusion criteria, exclusion criteria, data collection, and data analysis methods. The strategy of selecting literature, details about the protocol, and inclusion/exclusion criteria can be found in appended Paper B. The academic papers, theses, and reports included in this literature review have, thus, been read with an eye toward answering two research questions defined in Section 1.4, RQ1 and RQ2. To answer RQ1, the survey started with concentrating on understanding the main focus of the interoperability assessment research. To that end, the literature was broken down in a way that allowed this discussion to identify themes that facilitated the continued investigation into RQ2. The systematic literature review gives an overview of the literature about interoperability assessment methods. In total, more than 70 papers were found as a result of digital library searches with the relevant keywords, such as interoperability measurement, interoperability assessment, and integration measurement. Thirty-one documents were selected for in-depth reading after the first iteration. Eleven additional publications, cited by these papers, were selected early in the literature review and were eventually included in the survey based on the inclusion criteria that has explained on the protocol. Thus, 42 documents were included in the final analysis, which are summarized in the Appendix B. Chapter 3 discusses the findings of this literature review by underlining the main problems with identified assessment problems and some transferrable concepts of these models. Chapter 3 also points out the data visualization approach as a promising direction to be used in accessing CPS toolchain interoperability.
2.4 Exploratory Case Study The exploratory case study corresponds to the second stage in the research and is focused on the applicability of the proposed data visualization approach. According to the main methodology and problemsolving methodology described above, the data about the toolchain is acquired, parsed, filtered, mined, and finally, visualized to improve the understanding of interoperability during CPS development. The details about the case study, visualization techniques, and data-related methods are described in Chapter 4.
| 13
Chapter 3
“
If you can’t explain it simply, you don’t understand it well enough.” ― Albert Einstein
State of the Art This chapter presents the state-of-the-art study on interoperability assessment that will be useful throughout the discussions in this thesis. The chapter is partitioned into two parts. The first part details the interoperability definitions found in the literature and discusses different types of interoperability associated with these definitions. The second part specifically examines interoperability assessment research and narrows the focus to interoperability assessment models with an aim to identify valuable concepts. As mentioned earlier, this chapter summarizes the work presented in Paper B with an aim to answer the following research questions: RQ1: What is the main focus of current research on interoperability assessment? RQ2: How can existing approaches for interoperability assessment be adapted to handle interoperability during CPS development and production?
3.1 Interoperability Interoperability has been an academic research area since the 1970s and the research has continued to grow quite rapidly. As the industry seeks to advance its ability to accomplish simultaneously working, interdependency aware, networked, and integrated environments, improving the interoperability of systems explicitly became an important factor. Interoperability is a multidimensional concept that comprises several perspectives and approaches from different communities in various application domains. Today, several terminologies exist in the literature: Ford, Colombi, Graham, and Jacques (2007) listed 34 distinct interoperability definitions. The most popular definitions are found below: (1)
“The ability of systems, units, or forces to provide services to and accept services from other systems, units, or forces and to use the services so exchanged to enable them to operate effectively together” (Department of Defense, 1977);
(2)
“The ability for a system or a product/service to work with other systems or products/services without the special effort of the user” (IEEE, 1990);
(3)
“The ability of an Enterprise to interact with other Enterprises, not only on an Information Technology point of view but also on organizational and semantic points of view. This
14 |
interaction must be flexible and be developed at the lowest cost” (Li, Cabral, Doumeingts, & Popplewell, 2006); and (4)
“The ability of two or more systems or components to exchange and use the exchanged information in a heterogeneous network” (Geraci et al., 1991).
In the same study, Ford et al. (2007) commented that the definition of interoperability remains vague and context-dependent. During the literature review for this thesis, no definitions specifically for interoperability within the CPS toolchain context were found. However, the definitions above highlight different characteristics of interoperability, each of which is relevant for CPS. In CPS toolchains, providing and using services (1), having a relationship without any special effort of the user (2), having information technology, as well as an organizational and semantic point of view in mind (3), and certainly exchanging the information in a heterogeneous network (4) are all important attributes and abilities to consider. Nevertheless, it is likely that different perspectives on the interoperability problem in CPS toolchains could choose to define interoperability in a different way. Having different definitions of interoperability is not the only element to consider within the interoperability issue. Ford et al. (2007) compiled 64 different interoperability types from the literature. The 10 most studied interoperability types are listed below: •
System interoperability is defined in line with the generic “combination of interacting elements organized to achieve one or more stated purposes” (Haskin, Forsberg, Krueger, Walden & Hamelin, 2011), and systems interoperability is the ability of these systems to operate together.
•
Technical interoperability is the condition achieved among communications systems, electronics systems, or their equipment when information or services can be exchanged directly and satisfactorily between them and/or their users (Department of Defense, 1992).
•
Enterprise interoperability is concerned with interoperability between organizational units or business processes, either within a large distributed enterprise or within a network of enterprises (Chen & Vennadat, 2003).
•
Functional interoperability is the capability to reliably exchange information without error (Casey, 2015).
•
Programmatic interoperability is the ability of a set of communicating entities engaged in acquisition management activities to exchange specified acquisition management information and operate on that acquisition management information according to specified, agreed-upon operational semantics (Smith, Mayers & Fisher, 2007).
•
Operational interoperability is a relation between/among actors cooperating to achieve a common goal, an overall, mutual capability necessary to ensure successful and efficient cooperation (Munk, 2002).
•
Process interoperability is a property referring to the ability of diverse business processes to work together, to so-called "inter-operate" (Tsagkani, 2005).
•
Information interoperability is the ability of processes and systems to effectively exchange and use information services (Miller, Malloy, Masek, & Wild, 2001).
•
Data interoperability is defined as the ability of data (including documents, multimedia content, and digital resources) to be universally accessible, reusable, and comprehensible by all transaction parties (in a human-to-machine and machine-to-machine basis), by addressing the lack of common understanding caused by the use of different representations, different purposes, different contexts, and different syntax-dependent approaches (Mykkänen & Tuomainen, 2008).
| 15
•
Constructive interoperability is the ability of organizations responsible for constructing or maintaining a system to cooperate.
Similar to the definition of interoperability, these types of interoperability do not perfectly fit with CPS toolchains due to the nature of CPS. This research takes a holistic perspective on interoperability of CPS toolchains. This perspective includes different dimensions of interoperability, which have been used in earlier studies to distinguish between interoperability types. To this end, one type is not enough to warrant transferring to the CPS context. In fact, all of them can be included in the interoperability needed in CPS toolchains. I would like to underline that the aim of this section is not to find the perfect definition or type of interoperability that fits the CPS context, but to consider the term’s different usages and meanings in order to point out the coexistence of a pluralism. Along the same line as the systematic literature review in this thesis, Jardim-Goncalves et al. (2013) conducted an analysis about interoperability frameworks, interoperability theories, and interoperability models. According to their analysis, academia developed frameworks specific to enterprise interoperability, with more or fewer layers and variables, but most frameworks are structured similarly, considering the technological, business and organizational perspectives. They also recommended that: researchers abstain from creating more diversity in terms of approaches since the problem space is overall confined and rather focus on the opportunity to further refine the details along with providing more clearly detailed analysis about the interrelationships between the various variables on the different layers and perspectives and aim at delivering a systematised cause-effect framework. (p. 7) As the surveyed literature shows, the literature on the meaning of the term interoperability is not constitutionalized and includes pluralism. Interoperability has been defined and categorized several times in the literature for different purposes. This pluralism has resulted in new context-dependent interoperability types, which, in the case for this thesis, made understanding interoperability more difficult. However, this study does not focus on clarifying this indefinability of the interoperability term. Alternatively, this study applied a systematic literature survey on an assessment of interoperability to review, extend, and reuse the existing literature by including any interoperability type in order to extract useful concepts to be used in the CPS context.
3.2 Interoperability Assessment Kasunic and Anderson (2004) made remarkable comments about interoperability assessment: Developing and applying precise measurements in an area as multidimensional and complex as interoperability is difficult. However, measurement, assessment, and reporting of interoperability results in a visible way are essential to continued focus and to setting the right priorities. (p. 16) Interoperability has been examined from several different perspectives. Still, there is no comprehensive or systematic approach for interoperability assessment (Kasunic and Anderson, 2004). Carney and Oberndorf (2004) underlined the importance of interoperability assessment by stating, “Interoperability must be quantifiable to be achievable.” (p. 22) Inarguably, developing an approach to assess interoperability is an important need. However, it is challenging to identify quantifiable attributes that characterize the interoperability. This section summarizes the findings of the literature survey (Paper B). The purpose was to review the current status of interoperability assessment approaches in order to understand their importance, applicability, achievements, and any missing aspects, and to identify concepts that could be valuable to transfer with regard to toolchain interoperability in CPS development. The systematic literature review revealed the focus of interoperability assessment studies. Furthermore, it helped to narrow down my study according to specific findings. One of these findings concerned the domains where interoperability assessment are studied, as discerned by the emphasis placed on particular areas by the
16 |
author(s). The survey results show that the enterprise and defense domains are primary domains that studied interoperability the most and have probably significantly influenced the field. Another finding of the survey indicated that most research focused on specific aspects of interoperability assessment. I categorized the publications based on these aspects. Notably, 10 of the publications defined, explained, or focused on the use of models for interoperability assessment. This is followed by nine surveys on interoperability assessment models that offered analyses of the models through literature reviews. In other words, 19 of the documents—which is nearly half of the total literature examined for this thesis—either defined models or studied them in surveys. Interestingly, even if not all of the documents focused on models, nearly all of them mentioned models as part of their research. The focus of the research on models became decisive on the progression of the interoperability assessment study since they indicated a huge effort to model the interoperability. Therefore, I took a closer look at the interoperability assessment models that were mentioned in the reviewed documents. In the second phase of the literature study, a subset of the literature was studied in detail in order to extract relevant information regarding the interoperability models. In total, 26 different models were studied during this second iteration. Four of these models were selected for further detailed examination due to their high popularity. Here, the definition of the term popularity is the number of times each model was been cited out of these total 42 publications. A full list of the models can be found in Paper B. The most popular models and their popularity rate are as follows: •
Levels of Information Systems Interoperability: The Levels of Information System Interoperability (LISI) (C4ISR, 1998) model focuses on technical interoperability and the complexity of interoperations between information systems (Guédria, Naudet & Chen, 2008). LISI has been cited by 22 publications.
•
Organizational Interoperability Agility Model: The Australian Defence Science and Technology Organisation developed the Organizational Interoperability Maturity Model (OIM) (Clark & Jones, 1999; Clark & Moon, 2001; Fewell & Clark, 2003) to deal with the ability of organizations to interoperate. OIM assesses the non-technical, or human activity, aspects of one organization’s ability to interoperate with another. OIM has been cited by 18 different papers.
•
Levels of Conceptual Interoperability Model: Tolk and Migura (2003) proposed the Levels of Conceptual Interoperability Model (LCIM) to address the need for levels of conceptual interoperability that extend across technical models, such as LISI. LCIM has been cited by 17 publications.
•
System of Systems Interoperability (SoSI): This is the main model that focuses on system-ofsystem concerns (Morris et al., 2004). This model looked at the full range of barriers preventing interoperability between systems-of-systems. SoSI has been cited by 11 different papers.
Yet another finding of this study points out that only a few models have been widely accepted as a foundation within the field, while most are rarely used. Despite a large amount of effort spent by academia on these models, they are not widely adopted by industry. It is a necessity to understand the reason behind this low adaptation before suggesting any solution for assessing interoperability specific to CPS toolchains. For this purpose, prominent characteristics of these models—such as how they differ from each other on defining the degree of interoperability, which type of interoperability they are focusing on, and what kind of guidance they provide for improving interoperability—are analyzed. These characteristics bridged over to explain why the effort to develop interoperability models did not result in a wide industry adoption. Paper B details three main problems after analyzing the four models. These are summarized below: (1) The models either use complex metrics, separate levels, or combinations of the two. (2) The models mainly concentrate on selective aspects of interoperability. (3) The models focus on structure and content, providing little guidance on how to deal with problems.
| 17
The systematic literature review concludes by highlighting the visualization and visual analytics approach as a promising direction to harmonize the knowledge accessed by models that have been studied with the opportunities the visualizations can provide. •
Data visualization of toolchains provides an overview of the real situation of interoperability, which can be modified to filter data and ensure analytics for different stakeholders. Thus, holistic, dynamic, and bridged analysis could overcome problem (1).
•
Moreover, the data could be collected for different aspects of the interoperability in order to extend the visualizations to cover more than one selective aspect and create an opportunity to analyse the interactions between different aspects. This is an important opportunity to overcome problem (2).
•
The data analytics approach aims to guide users toward better interopreability by allowing the toolchain stakeholders to see the big picture. Furthermore, this analytical approach could be combined with some metrics, as previously mentioned (cost, performance, sustainability), and analysis can guide the toolchain owners or architect to make decisions acording to these metrics. This approach could be used to solve problem (3).
The review suggests that interoperability researchers consider data visualization and visual analytics techniques to promote stakeholder uptake of interoperability assessments. Additionally, the study identifies three potentially valuable concepts: the elaborated parts of system contexts, types of interoperability, and the theory connected to interoperability as a balance between interests rather than an optimization of a single, uniform metric. Paper B discusses these concepts in detail.
18 |
Chapter 4
“
Above all else show the data.” ― Edward Tufte
Data Visualization and Visual Analytics This chapter aims to build on the findings of the survey, which was explained in the previous chapters, by presenting data visualization and visual analytics as a promising approach for developing a better understanding on interoperability of CPS toolchains. This chapter presents the background of data visualization to highlight its importance and explains the challenges and opportunities that can be used to make interoperability visible. Moreover, the chapter summarizes the results of a case study (Paper C) that investigated the applicability of data visualization—and different visualization techniques—in understanding toolchains.
4.1 The Origins of Data Visualization Recent advances in computing and data storage technologies have made the existence of vast volumes of data possible (Keim, Mansmann, Schneidewind, & Ziegler, 2006). This is a powerful opportunity to discover new insights, and big data related research is trending. However, finding valuable information in these vast data sets is not easy. It is known that a picture is worth a thousand words, especially when a reader tries to find relationships and wants to understand the insights of the data. Koch et al. (2006) found that the human retina transmits data to the brain at the rate of 10 million bits per second, which is close to the rate of an Ethernet connection. This kind of bandwidth in the visual cortex system allows much faster perception of geometric and spatial relationships than any other kind of a system (McCormick, DeFanti, & Brown, 1987). The special properties of visual data perception may facilitate the discovery of relationships, trends, and hidden patterns, or, as Bertin (1981) says, “it is the visual means of resolving logical problems.” (p. 16) In this thesis, the visualization approach is identified as a solution to make interoperability of CPS toolchains visible, leading to a better understanding of interoperability needs. While a complete historical perspective on data visualization is not within the scope of this thesis, it is sufficient to highlight data visualization as a fundamental method that has historically, and repeatedly, been used to increase understanding. The use of graphic representations of information is not a new method. In fact, Friendly (2008) began his discussion of the history of data visualizations by looking at pre-17th-century early maps and diagrams. He then continued with several examples from the 17th century, such as the visualization of changing configuration of sunspots over time by Christopher Scheiner (1626), the graph of determinations of the distance
| 19
in longitude from Toledo to Rome by Michael Florent van Langren (1644), Edmund Halley’s (1701) New and Correct Sea Chart Shewing the Variations in the Compass in the Western and Southern Ocean. The term visualization was used in a 1987 ViSC report as a vital and highly promising scientific process (McCormick et al., 1987). The report highlights that visualization offers a way to see the unseen. Gershon defined visualization in 1992: Visualization is more than a method of computing. Visualization is the process of transforming information into a visual form, enabling users to observe the information. The resulting visual display enables the scientist or engineer to perceive visually features, which are hidden in the data but nevertheless are needed for data exploration and analysis. (p. 9) Later, Mazza (2004) summarized visualization as a cognitive activity “facilitated by graphical external representations from which people construct an internal mental representation of the world” (p. 5). Mazza defined visualization independently from computing and digital technologies. Both Gershon’s and Mazza’s definitions concentrate on the understanding of the information and underline the importance of this ability rather than any particular technology (Ruddle, Brodlie, & Dimitrova, 2002; Spence, 2001; Ware, 2012).
4.2 Case Study Findings This section discusses the findings of the study by underlining the contributions made to improve the understanding of the interoperability. The case study further explained in Paper C studied the interoperability situation in CPS development and aims to answer the following research question: RQ3: How feasible are data visualization techniques to improve the understanding of interoperability in CPS toolchains? In this exploratory study, data is collected during the development of a prototype application targeting the Cooling System for Transmission Plant (CSTP) at ABB. This application is a closed loop control system where a number of sensor elements and actuators are connected by various interfaces. The system performs relevant actions depending on the input signals, the internal system state, the configurable logic, and possibly on operator commands. The system is required to perform a variety of computation intensive operations, with very high real-time requirements, on data coming in concurrent streams. The description of the case study is detailed in Paper C. As mentioned previously, the objectives of this exploratory case study do not relate to the realization of the application described above, but instead focus on the toolchain that supports its development. Thus, in brief, the study aimed to visualize interactions and data exchanges between the tools at the different stages in the design flow within the used toolchain in order to guide the toolchain architects to understand more about the current interoperability situation and help them to evaluate and make improvement decisions according to this information visualization. The data used to evaluate the case study have been recorded through continuous use of the toolchain by a CSTP developer. The exercise was run for a period of one month. A developer’s user activity was recorded by tracking software, which registered the software usage periods. The data about user activity is deliberately defined in a compact form in order to collect the minimum information necessary to make data collection and filtering as easy as possible. This small amount of data, however, demonstrated valuable insights about the interoperability of the toolchain. First, as mentioned in Chapter 2, I adopted two different methodologies for this study: CSM for the case studies research and SSM for problem-solving methodology. The SSM methodology initiated the discussion on interoperability, including different viewpoints. Several stakeholder understandings of the interoperability problem were gathered, and each opinion was discussed. The discussion then provided overall understanding of the current situation, and the needs and priorities for the toolchain. This resulted in identifying the needs, from
20 |
the visualizations perspective, for interoperability assessment. These needs and how they have been considered are listed below: Tool Information: Each tool needs to have properties to be easily distinguished from the others. Different colors for each tool representation are used for this purpose. The most important information about the tool is the time different stakeholders spend using the tool. For this reason, the size of tool representation should be proportional to this property. Interactive tooltips are also added to the graphical representations for more information about each tool. Tool Interactions: The interactions between tools are the main focus of interoperability assessment in the studied case. One reason behind this is to reveal the interaction patterns and indentify the tools that interact the most with an aim of improving the understanding of interoperability. For this purpose, the interactions are added to the visualizations as an arc or link shape. The opacity of lines represents the interaction frequency between tools. In addition, the size of the shapes is proportional to the interaction rate. Additional Information: Toolchain architect alternatively needs more information to assess the interoperability. One data to support this is the department or division information of the tool in use. The toolchain I examined only focuses on one department and one toolchain. However, it was noted by the stakeholders that a bigger toolchain, which includes further stages of the product lifecycle, would benefit from this information. For instance, in Paper A, the importance of geospatial data for assessing the interoperability of the toolchains is mentioned. In some cases, the CPS product lifecycle also includes business units from different geographic locations, and the interaction between these units should be considered for interoperability assessment. Secondly, this exploratory study was a first attempt to use data visualization in interoperability research. CSM provided an opportunity to test the applicability of data visualization techniques to improve the understanding of the interoperability of toolchains. The case study investigated the interoperability of toolchains using different visualization techniques. In total, three different visualization techniques were evaluated: circular ideogram (CI), node-link diagram (NLD), and with a clustering algorithm, as an extended version of NLD, balloon layout (BL). •
CI (Figure 4.1) readability was found to be incomprehensive in the study. Since this visualization technique is not a traditional way to show network-like structures, it has been found that the toolchain architect struggled to process the information, even in such a small case. After meetings and interviews with the toolchain architects, the circular ideogram technique has been found difficult to understand. Toolchain architects also commented on the problem concerning the percentages associated with each tool. The switching frequency, which is represented by the chord width, is related to the usage of the associated tool (arc size), and it is difficult to understand specific tool switching behavior. Even though the chord diagram has the potential to create a clean visualization, at this stage of tool interactions, these opportunities did not aid in visualization of toolchain interoperability.
Figure 4.1 Circular ideogram of the development toolchain.
| 21
•
NLD (Figure 4.2) helps to observe global patterns of interactions in a toolchain. It allows one to more easily spot the unexpected connections and understand the frequency of switch behavior. Furthermore, visual features, such as color and size, reveal the heterogeneity and time spent using each tool. I found that toolchain architects found the visualization easy to read, and they immediately pointed out the need for better interoperability. Stakeholders commented that the NLD visualization has great potential to be used in reports and presentations to get the attention of other departments focused on investing in interoperability needs. Despite the fact that NLD is a very effective way to show the overall picture, it has some disadvantages. For instance, different layouts could create ambiguity when the tool number increases. Especially in the cases of very large and dense graphs, the problems of edge-crossings and overlapping nodes can be very severe, and reading the visualization becomes extremely complex. While small and sparse graphs can often be drawn without edge-crossings, large graphs and those that are highly connected cannot be laid out properly (Keller, Eckert, & Clarkson, 2006). Moreover, Ghoniem, Fekete, and Castagliola (2005) showed that density has a strong impact on readability in these diagrams. When focusing on basic readability tasks, such as finding a node or determining if two nodes are linked, NLD performs poorly for heavy networks, even with few nodes. Even though, in this specific case, this problem did not arise, I still considered it a potential downside that needs to be further evaluated.
Figure 4.2 Node-link diagram of the development toolchain.
•
BL (Battista, Eades, Tollis, & Tamassia, 1999; Herman, Melançon, & Marshall, 2000, Dickerson, Eppstein, Goodrich, & Meng, 2004; Holten, 2006) is introduced and developed as a third data visualization technique to increase the readability of NLDs by using algorithms to obtain clustered graph layouts that optimize certain aesthetic criteria. One such method for clustering is called Micro/Macro Graphs (Baur & Brandes, 2007). The BL had tools clustered into parent balloons representing departments as additional information. The BL (Figure 4.3) technique utilizes the available space more efficiently than rooted layout techniques and is a potential solution for visualizing toolchain interoperability.
22 |
Figure 4.3 Balloon layout for development toolchain.
The SSM analysis in this case study showed that the visualizations of toolchain interaction data have the potential to inform toolchain stakeholders about the interoperability situation and help them to make decisions accordingly. NLDs could be effective visualization tools, especially for small toolchains where links are not dense. Moreover, BL is a promising solution for larger visualizations and should be considered for future research. The CI, on the other hand, is exercised to try a non-traditional way of expressing the interactions in toolchains. However, this technique did not receive the necessary attention from the toolchain architects due to their unfamiliarity with it.
4.3 The Opportunities and Challenges Visualization and visual analytics technologies offer a lot of opportunities to make interoperability visible and understandable in CPS toolchains. There are some new initiatives that work for better-integrated engineering environments, such as the Industrial Internet Consortium, the Advanced Manufacturing Partnership, Industrie 4.0, and La Nouvelle France Industrielle. These initiatives deploy new technologies that can improve the current state of interoperability. One of the technologies considered by these institutions is visual computing. For instance, Industrie 4.0 mentions visual computing as a valuable support for acquiring, analyzing, and synthesizing data (Posada et al., 2015), while the Advanced Manufacturing Partnership organized workshops with the visualization, informatics, and digital manufacturing work group to define fundamental research opportunities for these technologies with respect to smart manufacturing (Smart Manufacturing Leadership Coalition, 2016). My state-of-the-art study showed that the interoperability problem is context-dependent, where different stakeholders, experience levels, distinct product properties, different hierarchical structures, and different data types interfere with each other. As a result, current assessment methods and models that measure the interoperability status use complex metrics and focus on selective aspects of interoperability. Moreover, they do not provide decision support for the toolchain architects to achieve better interoperability. On one hand, the interoperability literature is quite mature but restricted to models that assess interoperability, and on the other hand, emerging technologies—such as visualizations, analytics, and big data—bring a host of new possibilities. There is a need to design an approach to use toolchain data, especially one that can be generalizable for
| 23
different industries, products, and stakeholders. Visualizations and visual analytics, therefore, can incorporate many opportunities to assess interoperability in CPS toolchains. The data visualization approach investigated is the case study uses data to visualize the interactions between the development tools. The data itself is adequate for determining different organizational structures. It is flexible enough to be applied in different use cases since the method is not fixed to one specific domain. In addition, instead of building a model for a specific organization, focus can be concentrated on the data extraction and usage methods to visualize interoperability as quickly and as comprehensively as possible. The data itself is a fundamental piece that includes different properties about the company, organization, products, and toolchain. The discussion related to data will follow in the next paragraphs, but first, the most prominent opportunities data visualizations and visual analytics offer are summarized below: •
Visualization has a significant value in aiding toolchain architects, engineers, analysts, decisionmakers, and other stakeholders to promptly gain insights from the high volumes of data.
•
When combined with analytics, data visualization promises opportunities in exploring data quickly and serves as an interaction medium to augment requirements analysts’ knowledge discovery with advanced computational capabilities. This could positively affect the whole toolchain interoperability and thereby improve productivity.
•
Visualization and visual analytics are an opportunity to extract patterns of toolchains and tool interactions; to evaluate the complexity of toolchains; to create an overview of the infrastructure with different viewpoints; to optimize performance, automation, and cooperation of distributed development teams; and overall, to improve the understanding of interoperability.
There are also challenges to visualization techniques working adequately. Fulfilling all of the prerequisites/requirements to overcome these challenges is not within the scope of this thesis. It is, however, important to consider them to outline the limitations. Three identified challenges one needs to consider are detailed below.. One challenge underlies the unrealized importance of the data. As the data visualization’s name suggests the most vital part of this approach is the data. However, one of the most data-producing industries, manufacturing, is perhaps one that utilizes big data the least. There are many ways the manufacturing industry can use big data technologies to get an edge on its competition, but it remains unused. Product data, for instance, is available during the production throughout the product lifecycle; however, most of the time it is not analyzed further. The traditional manufacturing industry is not completely utilizing the benefits of the data to improve its development and production processes. This study specifically aimed to show how data could help improve the understanding of complex issues like interoperability. Another challenge is the lack of data sharing with researchers. Even though valuable data exists on, for instance, PLM system’s data warehouses of the CPS manufacturers, it is still challenging to reach it. Despite popular opinion, getting the data right is not a challenge that organizations face (LaValle, Lesser, Shockley, Hopkins, & Kruschwitz, 2011). In the survey LaValle et al. (2011) conducted, only about one out of five respondents cited concern with data quality or ineffective data governance as a primary obstacle. The main challenge found by this study was a “lack of understanding of how to use analytics to improve the situation.” (p. 3) To this end, the lack of sharing data of the product lifecycle plays an important role. Currently, the industry does not have enough experience dealing with data, does not yet have any defined methods for this purpose, and on top of it, does not allow academia access to its data for analysis due to various internal procedures and security concerns. Yet the case study, explained in Paper C, illustrates how a small amount of data could be useful to exercise different visualization techniques and creates an opportunity for industry and academia to have common ground to discuss and develop solutions to complex issues specific to understanding interoperability. One other challenge on ahead is how to utilize the existing data. The challenge underlies the lack of structure in data. The unstructured data is more than 80% of all data in the organizations (Grimes, 2008). The
24 |
data collection was not planned in a pre-defined manner to support analysis and generally do not include any data model for this purpose. However, first initiating research in CPS development and production, and finding suitable methods to derive information from these unstructured data and, secondly, motivating pre-defined methods for future data collection mechanism are necessities. Overcoming this challenge would support the visual analytics approach and improve the toolchain interoperability.
| 25
Chapter 5
“
If we have data, let’s look at data. If all we have are opinions, let’s go with mine.” ― Jim Barksdale
Conclusion and Future Work 5.1 Conclusion This study set out to understand toolchain interoperability in the CPS context. It did so by reviewing the literature on interoperability assessment and determining the applicability of data visualization approaches for better understanding of CPS toolchains. To this end, this licentiate thesis effort started with three research questions that were answered during the research presented throughout the thesis: RQ1: What is the main focus of current research on interoperability assessment? The presented literature review has identified that the current research done on interoperability assessment is mainly derived from the defense and enterprise domains. The research has also shown that the literature is mainly dominated by interoperability assessment models. These models have been developed and extensively studied by researchers. However, they were not adopted by the industry. These findings confirmed that there is a need for more flexible, adaptable solutions for assessing interoperability other than the fixed assessment models approach. RQ2: How can existing approaches for interoperability assessment be adapted to handle interoperability during CPS development and production? The literature review study identified three main problems that limit the acceptance of the interoperability models by the industry. These are summarized below: 1. 2. 3.
The models either use complex metrics, separate levels, or combinations of the two. The models mainly concentrate on selective aspects of interoperability. The models focus on structure and content, providing little guidance on how to deal with problems.
The systematic literature review study highlighted that the visualization and visual analytics approach can be a promising direction to complement the assessment models in order to handle interoperability during CPS development and production. Data visualization of toolchains provides an overview of the real situation of interoperability, which can filter data and ensure analytics for different stakeholders with different visualizations. Thus, holistic and dynamic analysis could be possible to overcome problem (1). Moreover, the
26
data could be collected for different aspects of the interoperability in order to extend the visualizations to cover more than one selective aspect and provide an opportunity to analyze the interactions between different aspects. This is an important opportunity to overcome problem (2). The data analytics approach aims to guide tool chain architecture toward better interoperability by seeing the big picture. Furthermore, this analytical approach could be combined with some of the factors mentioned in Section 1.2 (cost, performance, sustainability), and analysis can guide the toolchain owners or architect to make decisions according to these metrics. This approach could be used to solve problem (3). RQ3: How feasible are data visualization techniques to improve the understanding of interoperability in CPS toolchains? The case study showed that the visualizations of toolchain interactions have the potential to inform toolchain architects about the interoperability situation and help them make decisions accordingly. In this thesis, different visualization techniques were used to test the applicability of the data visualization approach. The study illustrated that using the NLD technique to visualize the data of toolchain interactions has the potential to inform the toolchain architects about the overall interoperability of toolchains. Thus, NLDs could be an effective visualization tool, especially for small toolchains where a toolchain includes a large number of tools. Moreover, the BL technique is a promising solution for larger toolchains and should be considered for future research. Overall, I conclude that that data visualizations and visual analytics are not only a method to understand the interoperability of CPS toolchains, but a necessity. Data visualization approaches hold many opportunities to finally make interoperability visible. The weight of the evidence in this study supports that data visualizations and visual analytics are a promising solution for analyzing the cost, performance, and sustainability factors of toolchains. Therefore, the CPS industry should focus its effort on appropriate data collection, usage, and sharing methods to best use data visualization and visual analytics technologies.
5.2 Future Work This section provides a plan for future work, including a list of relevant questions to guide the work. The research presented in this thesis mainly focused on the understanding of the interoperability in CPS development and production environments. This thesis aimed to build scientific knowledge on the importance of interoperability and the challenges of its complex and heterogeneous nature. Future research can take different possible directions that are beneficial to consider for improving interoperability in CPS toolchains. In this thesis, data visualization was presented as the solution to better understanding interoperability. The case study showed the benefits of visualization, and I briefly touched upon the importance of data. However, I have not yet extensively studied systematic data acquisition and analysis methods. As a next step, I would like to work with large data sets, for instance data from PLM systems, to analyze the needs of data acquirement, parsing, filtering, mining, and representation. One main topic of this particular research was interoperability. I would like to continue to study the methodologies described in this thesis in order to define metrics that can be used to assess interoperability. These metrics will not be simple numbers, but characteristics of interoperability that can be used in analytical reasoning for evaluating interoperability of the toolchains. For this purpose, one needs to find a new way of measuring, in fact assessing, the interoperability of toolchains. These metrics would vary for different viewpoints and domains. However, it is possible to conduct surveys and interviews in addition to literature reviews in order to extract the metrics to assess the interoperability of toolchains. It is definitely a future plan to work on data analytics techniques to develop visual analytics for assessing the interoperability of toolchains. Even though this thesis included discussion on the benefits of visual analytics, techniques associated with analytical reasoning were not explicitly studied. The goal is using these analytics to suggest methods to improve interoperability in toolchains. As I mentioned in Section 1.1, there are promising approaches and studies on tool integration. I strongly believe that visual analytics can suggest the best technical integration solutions according to the metrics needed to improve interoperability.
| 27
CPS themselves are faced with the challenges associated with interoperability. There is a need to understand and improve interoperability in CPS. It is also possible to focus on the interoperability of CPS, instead of CPS toolchains, in the future and to aim for improving the understanding of CPS interactions by using visualization and visual analytics techniques. In this case, one should re-analyze the literature and existing scientific knowledge to re-design the focus of data visualization. Still, it is applicable to use most of the knowledge from this research and apply it toward CPS interoperability.
28
Bibliography Abercrombie, N., Hill, S., & Turner, B. S. (1984). Dictionary of sociology. Harmondsworth, UK: Penguin. Asplund, F., & Törngren, M. (2015). The discourse on tool integration beyond technology, a literature survey. Journal of Systems and Software, 106, 117–131. Avison, D., & Fitzgerald, G. (2003). Information systems development: Methodologies, techniques, and tools. London, UK: McGraw-Hill. Battista, D. G., Eades, P., Tollis, I. G., & Tamassia, R. (1999). Graph drawing: Algorithms for the visualization of graphs. Upper Saddle River, NJ: Prentice Hall. Baur, M., & Brandes, U. (2007, September). Multi-circular layout of micro/macro graphs. In H. Seok-Hee, N. Takao, & Q. Wu. (Eds.), Graph Drawing (pp. 255–267). Springer Berlin Heidelberg. Bertin, J. (1981). Graphics and graphic information processing. Berlin: Walter de Gruyter. Bi, Z., Da Xu, L., & Wang, C. (2014). Internet of things for enterprise systems of modern manufacturing. IEEE Transactions on Industrial Informatics, 10(2), 1537–1546. Biehl, M., El-Khoury, J., & Törngren, M. (2012, June). High-level specification and code generation for service-oriented tool adapters. In Proceedings of the 12th International Conference on Computational Science and Its Applications (ICCSA), 2012 (pp. 35-42). IEEE. Bosch, J. (2012, June). Speed and innovation through architecture. In Proceedings of the 15th ACM SIGSOFT Symposium on Component Based Software Engineering (CBSE '12) (pp. 1–2). New York, NY, USA: ACM. Carney, D., & Oberndorf, P. (2004, April). Integration and interoperability models for systems of systems. In Proceedings of the System and Software Technology Conf. (pp. 1–35). Casey, A. (2015). Health Informatics Standards. In K. J. Hannah, P. Hussey, M. A. Kennedy, & M. J. Ball (Eds.), Introduction to Nursing Informatics (pp. 97–144). New York: Springer-Verlag London. Checkland, P. (2000). Soft systems methodology: A thirty-year retrospective. Systems Research and Behavioral Science, 17(S1), S11. Checkland, P., & Poulter, J. (2010). Soft systems methodology. In M. Reynolds & S. Holwell (Eds.), Systems approaches to managing change: A practical guide (pp. 191–242). London: Springer-Verlag London. Checkland, P., & Scholes, J. (1990). Soft systems methodology in action (p. 330). Chichester, GB: John Wiley & Sons. Chen, D., & Vernadat, F. B. (2003). Enterprise interoperability: A standardization view. In K. Kosanke, R. Jochem, J. G. Nell, & A. Ortiz Bas (Eds.), Enterprise Inter-and Intra-Organizational Integration (pp. 273–282). Boston: Springer US. Clark, T., & Jones, R. (1999, June). Organisational interoperability maturity model for C2. In Proceedings of the 1999 Command and Control Research and Technology Symposium. Clark, T., & Moon, T. (2001). Interoperability for joint and coalition operations. Australian Defence Force Journal, 2336. Cook, K. A., & Thomas, J. J. (2005). Illuminating the path: The research and development agenda for visual analytics (No. PNNL-SA-45230). Richland, WA (U.S.): Pacific Northwest National Laboratory (PNNL). Department of Defense. (1997, Mar. 11) Standardization and interoperability of weapons systems and equipment within the North Atlantic Treaty Organization (NATO) (DOD Directive 2010.6). Washington, DC: Author. Department of Defense. (1992, Nov. 18). Procedures for compatibility, interoperability, and integration of command, control, communications, and intelligence (C3I) systems (DOD Instruction 4630.8). Washington, DC: Author. Dickerson, M., Eppstein, D., Goodrich, M. T., & Meng, J. Y. (2004, September). Confluent drawings: Visualizing nonplanar diagrams in a planar way. In G. Liotta (Ed.), Graph Drawing (pp. 1–12). Springer Berlin Heidelberg. El-Khoury, J., Asplund, F., Biehl, M., Loiret, F., & Törngren, M. (2013, May). A roadmap towards integrated CPS development environments. In 1st Open EIT ICT Labs Workshop on Cyber-Physical Systems Engineering. Trento, Italy. Emory, C. W., & Cooper, D. R. (1991). Business research methods (4th ed.). Boston, MA: Irwin. Feagin, J. R., Orum, A. M., & Sjoberg, G. (Eds.). (1991). A case for the case study. Chapel Hill: University of North Carolina Press Books.
| 29
Fewell, S., & Clark, T. (2003). Organisational interoperability: evaluation and further development of the OIM model. Defence Science and Technology Organisation. Fidel, R. (1984). The case study method: A case study. Library and Information Science Research, 6(3), 273–288. Flyvbjerg, B. (2006). Five misunderstandings about case-study research. Qualitative Inquiry, 12(2), 219–245. Flyvbjerg, B. (2011). Case study. In N. K. Denzin & Y. S. Lincoln (Eds.), The Sage Handbook of Qualitative Research (4th ed., pp. 301–316). Thousand Oaks, CA: Sage Publications. Ford, T. C., Colombi, J. M., Graham, S. R., & Jacques, D. R. (2007, June). A survey on interoperability measurement. In: Proceedings of the 12th International Command and Control Research and Technology Symposium (pp. 19–21). Newport, RI: Air Force Institute of Technology. Friendly, M. (2008). A brief history of data visualization. In C. Chen, W. K. Härdle, & A. Unwin (Eds.), Handbook of data visualization (pp. 15–56). Berlin: Springer. Geraci, A., Katki, F., McMonegal, L., Meyer, B., Lane, J., Wilson, P.,…Springsteel, F. (1991). IEEE standard computer dictionary: Compilation of IEEE standard computer glossaries. Piscataway, NJ: IEEE Press. Gershon, N. D. (1992). From perception to visualization. Computer Graphics, 26(2), 414–415. Ghoniem, M., Fekete, J. D., & Castagliola, P. (2005). On the readability of graphs using node-link and matrix-based representations: A controlled experiment and statistical analysis. Information Visualization, 4(2), 114–135. Grimes, S. (2008). Unstructured data and the 80 percent rule. Carabridge Bridgepoints. Guédria, W., Naudet, Y., & Chen, D. (2008, November). Interoperability maturity models–survey and comparison–. In OTM Confederated International Conferences" On the Move to Meaningful Internet Systems" (pp. 273-282). Springer Berlin Heidelberg. Haskins, C., Forsberg, K., Krueger, M., Walden, D., & Hamelin, D. (2006, June). Systems engineering handbook. In INCOSE. Herman, I., Melançon, G., & Marshall, M. S. (2000). Graph visualization and navigation in information visualization: A survey. IEEE Transactions on Visualization and Computer Graphics, 6(1), 24–43. Holten, D., 2006. Hierarchical edge bundles: Visualization of adjacency relations in hierarchical data. IEEE Transactions on Visualization and Computer Graphics, 12(5), 741–748. IEEE, IEEE standard computer dictionary: A compilation of IEEE standard computer glossaries, 1990. International Standards Organisation. (2008). ISO/IEC 25012:2008(E): Software product quality requirements and evaluation (SQuaRE) — Data quality model. Switzerland: ISO International Standards Organisation. (2010). 24765-2010 - Systems and software engineering – Vocabulary. Piscataway, NJ: IEEE Computer Society. Jardim-Goncalves, R., Grilo, A., Agostinho, C., Lampathaki, F., & Charalabidis, Y. (2013). Systematisation of Interoperability Body of Knowledge: the foundation for Enterprise Interoperability as a science. Enterprise Information Systems, 7(1), 7-32. Kasunic M., & Anderson W. (2004). Measuring systems interoperability: Challenges and opportunities (CMU/SEI-2004TN-003) Pittsburgh, PA: Carnegie Mellon University Software Engineering Institute. Keim, D. A., Mansmann, F., Schneidewind, J., & Ziegler, H. (2006, July). Challenges in visual data analysis. In Tenth International Conference on Information Visualization. IV 2006 (pp. 9–16). IEEE. Keller, R., Eckert, C. M., & Clarkson, P. J. (2006). Matrices or node-link diagrams: Which visual representation is better for visualising connectivity models? Information Visualization, 5(1), 62–76. Kitchenham, B., Pretorius, R., Budgen, D., Brereton, O. P., Turner, M., Niazi, M., & Linkman, S. (2010). Systematic literature reviews in software engineering–a tertiary study. Information and Software Technology, 52(8), 792–805. Koch, K., McLean, J., Segev, R., Freed, M. A., Berry, M. J., Balasubramanian, V., & Sterling, P. (2006). How much the eye tells the brain. Current Biology, 16(14), 1428–1434. LaValle, S., Lesser, E., Shockley, R., Hopkins, M. S., & Kruschwitz, N. (2011). Big data, analytics and the path from insights to value. MIT Sloan Management Review, 52(2), 21. Lee, E. A., & Seshia, S. A. (2011). Introduction to embedded systems: A cyber-physical systems approach. Morrisville, NC: LeeSeshia.org. Lennartson, B., Bengtsson, K., Wigström, O., & Riazi, S. (2016). Modeling and optimization of hybrid systems for the tweeting factory. IEEE Transactions on Automation Science and Engineering, 13(1), 191–205.
30
Li, M. S., Cabral, R., Doumeingts, G., & Popplewell, K. (2006). Enterprise interoperability research roadmap. an enterprise interoperability community document. Work coordinated by the enterprise interoperability cluster of the Information Society and Media Directorate-General, European Commission. Published by European Commission in. Mazza, R. (2004). Introduction to information visualisation. Faculty of Communication Sciences, University of Lugano. McCormick, B. H., DeFanti, T. A., & Brown, M. D. (1987). Visualization in scientific computing. IEEE Computer Graphics and Applications, 7(10), 69–79. Meyers, B. C., & Smith, J. D. (2007). Programmatic interoperability (CMU/SEI-2008-TN-012), Software Engineering Institute, Carnegie Mellon University, Pittsburgh. Miles, M. B., & Huberman, A. M. (1994). Qualitative data analysis: An expanded sourcebook. Thousand Oaks, CA: Sage Publications. Mills, A. J., Durepos, G., & Wiebe, E. (Eds.). (2009). Encyclopedia of case study research. Thousand Oaks, CA: Sage Publications. Munk, S. (2002). An analysis of basic interoperability related terms, the system of interoperability types. Academic and Applied Research in Military Science, 1, 117–132. Miller, B., Malloy, M. A., Masek, E., & Wild, C. (2001). Towards a framework for managing the information environment. Information Knowledge Systems Management, 2(4), 359–384. Morris, E., Levine, L., Meyers, C., Place, P., & Plakosh, D. (2004). System of Systems Interoperability (SOSI): final report (No. CMU/SEI-2004-TR-004). Carnegie Mellon Software Engineering Institute. Mykkänen, J. A., & Tuomainen, M. P. (2008). An evaluation and selection framework for interoperability standards. Information and Software Technology, 50(3), 176–197. Posada, J., Toro, C., Barandiaran, I., Oyarzun, D., Stricker, D., de Amicis, R., … Vallarino, I. (2015). Visual computing as a key enabling technology for industrie 4.0 and industrial Internet. IEEE Computer Graphics and Applications, 35(2), 26–40. Ruddle, R., Brodlie, K., & Dimitrova, V. (2002). Communication, visualization, and interaction [Course handbook]. School of Computing, University of Leeds. SAS Institute. (2016). Data visualization: What it is and why it matters. Retrieved October 7, 2016, from http://www.sas.com/en_us/insights/big-data/data-visualization.html Sekaran, U., & Bougie, R. (2010). Research method for business, a skill building approach. New York: John Wiley & Sons Inc. Shneiderman, B., & Plaisant, C. (2006, May). Strategies for evaluating information visualization tools: multi-dimensional in-depth long-term case studies. In Proceedings of the 2006 AVI workshop on Beyond time and errors: novel evaluation methods for information visualization (pp. 1-7). ACM. Smart Manufacturing Leadership Coalition. SMLC-NSF Workshop [online]. Retrieved July 5, 2016, from https://smartmanufacturingcoalition.org/smlc-nsf-workshop Smith, J., Meyers, C., & Fisher, D. (2007). Systems-of-Systems Programmatics: Guidelines for Program Managers. Technology, 2007. Spence, R. (2001). Information visualization (Vol. 1). New York, NY: Addison-Wesley. Stake, R. E. (1995). The art of case study research. Thousand Oaks, CA: Sage Publications. Sykes, W. (1990). Validity and reliability in qualitative market research: A review of the literature. Journal of the Market Research Society, 32(3), 289–328. Tsagkani, C. (2005). Inter-organizational collaboration on the process layer. In Proceedings of the IFIP/ACM SIGAPP INTEROP-ESA Conference (pp. 23–25). Tolk, A., & Muguira, J. A. (2003, September). The levels of conceptual interoperability model. In Proceedings of the 2003 fall simulation interoperability workshop (Vol. 7, pp. 1-11). Citeseer. Törngren, M., Qamar, A., Biehl, M., Loiret, F., & El-Khoury, J. (2014). Integrating viewpoints in the development of mechatronic products. Mechatronics, 24(7), 745–762. Vinnova. (2014). Made in Sweden 2030: Strategic agenda for innovation in production. Retrieved October 7, from https://www.teknikforetagen.se/globalassets/i-debatten/publikationer/produktion/made-in-sweden-2030-engelsk.pdf
Ware, C. (2012). Information visualization: Perception for design. Boston: Elsevier. Williams, B., & Hummelbrunner, R. (2010). Systems concepts in action: A practitioner's toolkit. Stanford, CA: Stanford University Press. Yin, R. (1994). Case study research: Design and methods. Thousand Oaks, CA: Sage Publications.
| 31
APPENDIX A Protocol for Literature Review Background Interoperability/integration metrics are under research for many years with the goal of increasing communication between different tools for more productive environment. The purpose of the study described in this protocol is to review the current status of interoperability/integration metrics and the methods/techniques/parameters to measure the success. It is planned to review articles in particular describing methods, techniques and parameters to measure interoperability/integration and their usage to define metrics in tool chains according to this protocol.
Research Questions The research questions to be address by this study are: RQ1: How authors define earlier works done on interoperability measurement and in what concept/domains? RQ2: What is proposed by authors to measure interoperability? RQ3: What metrics the authors define on their work about interoperability measurement?
Search Process The search process is a manual search of specific government or corporate reports, conference proceedings, thesis, workshop and journal papers. The digital libraries are listed below. Source ACM Digital Library Google Scholarship IEEE Xplore Digital Library JSTOR ScienceDirect Scopus Springer Link
Inclusion Criteria Articles relevant to following keywords will be included. Keywords Interoperability Measurement Integration Measurement Interoperability Assessment After searching databases with different keyword but not accessing relevant articles, I decided to use another method to identify relevant studies. Scanning reference list of existing reviews and eligible studies and identifying relevant papers would be the second method to detect potentially relevant studies.
32
Exclusion Criteria The following type of papers will be excluded • Informal literature surveys (no defined research questions, no search process, no defined data extraction or data analysis process). • Papers that are not discussing interoperability/integration of tools/software. • Papers not subject to peer review. When a paper has been published in more than one journal/conference, the most complete version of the survey will be used. To eliminate duplications search results will be filtered on the resource list (excel file).
Primary Study Selection Process The results will be tabulated as follows: • ID • Title • Year • Authors • Domain • Subject • Qualitative/Quantitative • RQ1 • RQ2 • Metrics • Notes
Data Collection The data extracted from each paper will be: • ID • Title • Year • Authors • Domain • Subject • Qualitative/Quantitative • RQ1 • RQ2 • Metrics • Notes
Data Analysis The data will be tabulated (ordered according to ID numbers) to show basic information about each study and the number of studies in each major category will be counted. The tables will be reviewed to answer the research questions and identify any interesting similarities/trends or major differences.
| 33
APPENDIX B Data for Literature Review Study
Title
Year
Author(s)
Measuring Organizational Interoperability in Practice: The Case Study of Population Welfare Department of Government of Sindh, Pakistan
2012
Maheshwari, Janssen
An Approach for Enterprise Interoperability Measurement
2008
Chen et al.
ISO Standards for Interoperability: A Comparison.
2006
Kosanke
Enterprise interoperability measurement-Basic concepts
2006
Daclin et al.
Interoperability Measurement
2008
Ford
Barriers driven methodology for enterprise interoperability
2007
Chen, Daclin
Methodology for Enterprise Interoperability
2008
Daclin et al.
A General Method of Measuring Interoperability and Describing Its Impact on Operational Effectiveness
2009
Ford et al.
The interoperability score
2006
Ford et al.
Survey on Interoperability Measurement
2007
Ford et al.
MFI Based Interoperability Measurement of Business Models in Service-based Enterprises
2013
Li et al.
A Reliability-Based Measurement of Interoperability for Systems of Systems
2013
Jones-Wyatt et al.
Interoperability Maturity Models–Survey and Comparison
2008
Guédria et al.
Measuring medical informatics systems interoperability using the LISI model
2010
Vida, Stoicu-Tivadar
Interoperability-how do we know when we have achieved it?
1989
Pridmore, Rumens
Effects of Enterprise Interoperability on Integration Efforts in Supply Chains
2009
Mouzakitis et al.
2015
Pirayesh Neghab et al.
2014
Maheshwari et al.
2008
Panetto, Molina
2012
Zutsh et al.
2012
Ducq et al.
2014
Daclin et al.
2014
Camara et al.
2008
Chen et al.
Performance evaluation of collaboration in the design process- Using interoperability measurement Reconceptualizing measuring, benchmarking for improving interoperability in smart ecosystems Enterprise integration and interoperability in manufacturing systems: Trends and issues The Business Interoperability Quotient Measurement Model A contribution of system theory to sustainable enterprise interoperability science base Developing enterprise collaboration: a methodology to implement and improve interoperability A methodology for the evaluation of interoperability improvements in interenterprises collaboration based on causal performance measurement models Architectures for enterprise integration and interoperability- Past, present and future
34
Methodology for Prior Evaluation of Interoperability
2014
Mamadou et al.
Enterprise Integration Performance Modeling and Measurement Based on Category Theory
2009
Ormandjieva, Mikhnovsky
Enterprise interoperability maturity model (EIMM)
2005
Athena
Levels of Information Systems Interoperability (LISI)
1998
C4ISR Architecture Working Group
Addressing Interoperability in Military Systems-of- Systems Architectures
2012
Jones-Wyatt et al.
A review of interoperability assessment models
2013
Rezaei et al.
Measuring systems interoperability: challenges and opportunities
2001
Kasunic
Military Communications and Information Systems Interoperability
1996
Amanowicz, Gajewski
System of Systems Interoperability (SOSI)
2004
Morris et al.
Interoperability evaluation models - A systematic review
2014
Rezaei et al.
Organisational Interoperability Maturity Model for C2
1999
Clark, Jones
Addressing interoperability in military systems-of-systems architectures
2012
Jones-Wyatt et al.
Software Metrics and Interoperability
1983
Resm et al.
2012
Yahia et al.
2007
Blanc et al.
2010
Camara et al.
2015
Liu et al.
2003
Fewell, Clark
Formal measures for semantic interoperability assessment in cooperative enterprise information systems Evolution management towards interoperable supply chains using performance measurement Methodology for Prior Evaluation of Interoperability Evaluation Frameworks for Information Systems Integration: From a Semiotic Lens Organisational Interoperability: Evaluation and Further Development of the OIM Model