Malware Filtering for Network Security Using Weighted Optimality Measures Michael Bloem∗ , Tansu Alpcan†, Stephan Schmidt‡ , and Tamer Bas¸ar∗ ∗ Coordinated
Science Lab, University of Illinois, 1308 West Main Street, Urbana, IL 61801, USA Email: {mbloem2, tbasar}@control.csl.uiuc.edu † Deutsche Telekom Laboratories, Technische Universit¨at Berlin, Ernst-Reuter-Platz 7, 10587, Germany Email:
[email protected] ‡ DAI-Labor, Technische Universit¨at Berlin, Franklinstr. 28, 10587, Germany
[email protected] Abstract— We study the deployment and configuration of the next generation of network traffic filters within a quantitative framework. Graph-theoretic and optimization methods are utilized to find optimal network traffic filtering strategies that achieve various security or cost objectives subject to hardware or security level constraints. We rely on graph-theoretic concepts such as centrality measures to assess the importance of individual routers within the network, given a traffic pattern. In addition, we consider several possible objectives involving financial costs associated with traffic filtering, the cost of failing to filter traffic, a utility associated with filtering traffic, and combinations of these costs and this utility. These optimization problems are solved taking into account constraints on networkwide filtering capabilities, individual filter capabilities, and also lower and upper bounds on the effective sampling rate for source-destination pairs. Centralized but dynamic solutions of the resulting problems are obtained under varying network traffic flows. The resulting optimal filtering strategies are simulated in MATLAB using real traffic data obtained from the Abilene project. Simulations comparing these strategies with some heuristic approaches demonstrate that they are more effective in achieving network traffic filtering objectives.
I. I NTRODUCTION Computer networks have become an ubiquitous but vulnerable aspect of corporate, university, and government life. Yet the increased complexity of computer networks combined with the ingenuity of attackers means that they remain susceptible to expensive attacks from worms, viruses, trojans, and other malicious software, which we simply refer to as malware [1]–[3]. Network traffic filtering is one of many security methods available to network administrators. Network traffic filters provide protection by sampling packets or sessions and either comparing their contents to known malware signatures or looking for anomalies likely to be malware. Filtering capabilities have begun to be integrated into routers themselves, so as to reduce hardware deployment costs and to allow for more adaptive security [4]. Future traffic filters are expected to be configurable, networked, and even autonomous. Our objective in this paper is to investigate the deployment and configuration issues of such devices within an optimization framework. 1 Research 2 Research
supported in part by the Deutsche Telekom AG. supported in part by the a grant from the Boeing company.
A. Related Work A related and more studied area of research is network monitor placement for traffic measurement. In this paper we make use of the framework introduced by Cantieni et. al. [5] on the monitor placement problem. In the mentioned paper, the authors set up various optimization problems using the sum of the squared relative errors of traffic flow sizes as the convex objective function for minimization problems involving constraints on sampling rates and capacity. Another relevant paper on the monitor placement problem takes a similar approach, but uses more sophisticated cost models involving discrete variables indicating where monitors will be placed [6]. The same paper also considers constraints requiring that some minimum benefit be provided while a cost metric is minimized. While the malware filter placement problem has not been studied using an optimization framework similar to those discussed above, it has been analyzed from a game theoretical perspective. Kodialam and Lakshman [7] consider the most difficult filter placement scenario where the attacker has complete awareness of the network topology and can choose the path that malignant traffic will take. In [8], a Markov game between an attacker and an intrusion detection system (IDS) is considered. The attacker selects nodes to attack from and nodes to target while the IDS chooses links on which to deploy traffic filters. Yet another approach to the malware filter placement problem is currently being pursued by researchers at BenGurion University in Israel. This approach involves centrality measures, which originated in social network analysis. Recent developments allow for these measures to be calculated quickly [9]. B. Summary of Contributions One of the questions we investigate in this paper is the value or importance of a single router or link in a network with a given traffic pattern. Using modified versions of wellknown centrality measures from graph theory, we show that when source-destination pairs are weighted based on traffic magnitude in centrality algorithms, the resulting centrality measure for each router is equivalent to the traffic seen at each router under certain assumptions on routing algorithms.
This intuitive but not immediately obvious result allows us to easily use these centrality measures in cost functions, leading to quantitative expressions of common network security objectives. The main contribution of this paper is the development of a quantitative optimization framework where filtering strategies are derived. These strategies indicate at what rate to filter packets or sessions at a specific configurable filtering router or device at a given time. We set up and solve a variety of optimization problems to determine the optimal filtering strategy for different objectives involving security level, centrality, and costs. Furthermore, we take into account various hardware- and security-level constraints. The optimal strategies resulting from these problems are simulated in a dynamic environment with real traffic data.
sources, D ⊂ R be the set of all destinations, and P be the set of all source-destination pairs (s, d). The number of shortest paths between s ∈ R and d ∈ R is σsd . The number of these shortest paths that pass through some r ∈ R is σsd (r). Moreover, the amount of traffic between s and d is usd . TBC assumes that there are multiple shortest paths between a source and destination and that they are equally likely to be used. TBC of a router r, denoted by CT B (r), is then defined as the fraction of shortest paths of all sourcedestination pairs that pass through a particular router, with each source-destination pair being weighted by its traffic magnitude. X σsd (r) (1) usd CTB (r) := σsd
II. M ODEL AND P ROBLEM F ORMULATIONS
If at least one shortest path for any source-destination pair passes through a given router r, then CT B (r) > 0. A special case would be based on stress centrality and called traffic stress centrality (TSC). Here we do not assume that all shortest routes are used with equal likelihood but rather that one is chosen. In this case if a node is on this selected shortest route, then σsd = 1, otherwise it is 0. TSC of a router r is then defined as X usd σsd (r) (2) CTS (r) :=
Computer network administrators face a variety of objectives and constraints involving the network security level and the financial or technical cost of achieving that security level. We combine and express these constraints and objectives within the four malware filter placement problems evaluated in this paper. We consider a network of configurable, networked routers with traffic filtering capabilities which can be dynamically and remotely set by a centralized server. Some subset of these routers are source routers and another (potentially overlapping and typically identical) subset are destination routers. Other routers are core routers. We do not explicitly consider the effectiveness of malware filters. We assume that filtered packets are marked so that we do not redundantly filter particular packets. In addition, we assume that the network administrator has full knowledge of the network traffic, possibly with some delay. Finally, we do not consider how the act of filtering malware will alter the quantity of traffic on a link or the quantity of malware at future routers because we assume that the proportion of malware in the network is relatively low. Although we will discuss here packet filtering, all of the developed theory and results also apply to the filtering of sessions. A. Centrality Measures for Network Link Assessment We introduce two new centrality measures within the context of communication networks. Traditional centrality measures, as described in [9], involve source-destination pairs, but each pair is weighted identically. A more relevant and accurate centrality measure would weight sourcedestination pairs according to the magnitude of traffic that travels between them. Moreover, traditional centrality measures consider every node to be a potential source and destination, but this is not the case for core routers. Therefore, we propose only considering those nodes that are in fact sources and/or destinations (i.e. no core routers) in our centrality calculation. Traffic betweenness centrality (TBC) is betweenness centrality with the above two changes. Let R be a set of all vertices in an undirected graph. Let S ⊂ R contain all the
(s,d)∈P
(s,d)∈P
There exists an intuitive but not immediately obvious relationship between the traffic centrality measures defined here and the actual traffic that passes through a router. Assume that the traffic between all source-destination pairs on this network is routed using either (a) a load-balancing shortest path routing scheme where all the packets sent from a source node to a destination one are equally likely to be delivered through multiple shortest paths between them or (b) a simple shortest path scheme where all packets between the source and the destination nodes are delivered consistently through a single shortest route. Then, the amount of traffic on a router r is equal to the TBC measure in the case of routing scheme (a) and the TSC measure in the case of scheme (b). These relationships can easily be proved by comparing the definitions of traffic centrality measures with simple equations for traffic at routers under these routing schemes. Traffic centrality measures capture the importance of routers on a network, and hence are helpful when defining objective functions for malware filtering problems. B. Centrality-Based Problem Failing to filter a portion of traffic at a router with a high centrality measure is likely to be more damaging than failing to filter at a router with low centrality. This motivates using a cost of the form CTS (r)(1 − pr ) summed over all routers. We choose to square this quantity because we assume that as increasing amounts of malware pass through a network, the cost to the network increases quadratically. Call mr (t) the number of malignant packets to traverse a router r ∈ R in some amount of time t. If a filtering rate of pr is in
place at this router r, then mr (t)(1 − pr ) of these packets will successfully pass by the router undetected. If we assume that the amount of malware at a router is proportional to the amount of traffic at the router, then it is also proportional to the centrality of the router. Thus, we can substitute a traffic centrality measure in for mr (t) in the previous expression, leading to the same cost expression. Call p a vector of all of the filtering rates pr . The centrality-based problem is therefore defined as X min Mr (pr ), (3) p
r∈R
where Mr (pr ) = CTS (r)2 (1 − pr )2 .
(4)
We consider a constraint θ on the total number of packets that we may filter. This constraint reflects the aggregate capacity limitations of the filtering devices at hand. Let ur (t) denote the traffic observed at router r at time t. Then the constraint is expressed as X ur (t)pr ≤ θ. (5) r∈R
If we assume that filtered packets are marked and not filtered again, we can easily impose restrictions on the effective sampling rate for source-destination pairs. Let the index j refer to a source-destination pair in the set of sourcedestination pairs P . Let the fraction of shortest paths that a router r lies on for a particular source-destination pair j be specified by ξj (r). If there is only one shortest path or only one that is used for source-destination pair j, we can set ξj (r) to 1 for all routers on that path and 0 for all other routers. Finally, let yr be a discrete variable indicating whether or not filtering is enabled on the router r. Considering that packets are not sampled twice because of packet marking, the effective sampling rate for pair j becomes X ρj = ξj (r)pr yr . (6) r∈R
Note that the pr values refer to the proportion of the total amount of traffic at a router that is filtered, even though we assume that filtered packets are labeled and not filtered twice. This problem may entail some additional constraints. The pr values must remain between 0 and 1. Furthermore, the effective sampling rate may be required to remain between some minimum effective sampling rate α and 1, as any value greater than 1 would indicate that packets are sampled more than once. These additional constraints are pr ∈ [0, 1], r ∈ R ρj ∈ [α, 1], j ∈ P
(7)
When we enforce these constraints, we call this problem the constrained centrality-based problem. Notice that, since we are minimizing a strictly convex function on a convex nonempty set, a unique optimal solution always exists. In this case a centralized server calculates optimal filtering for the current time step based on traffic measurements from
the last time step by solving the quadratic programming problem (3) with the constraints (7). This problem can be solved using a gradient projection method with the Armijo projection arc step size rule (see [10] Section 2.3). This method is guaranteed to identify the correct set of active constraints when there are too many constraints. C. Centrality and Sampling Cost-Based Filtering Problem In this problem, we do not put an upper bound on the number of packets that can be filtered network-wide, but rather place a cost on packet sampling and include it with the centrality-based metric in the objective to be minimized. Hence, we minimize a sum of the Mr (pr ) and a cost on the sampling itself, weighted by γ1 u ¯. We multiply by u ¯ so as to allow more accurate comparisons of γ1 values across networks with different traffic loads. Thus the problem becomes X min [Mr (pr ) + γ1 u ¯ u r p r cr ] , (8) p
r∈R
where cr is a per-packet sampling cost on link r. We no longer face a constraint on the number of packets to filter but only require that each pr value must remain between 0 and 1. The constraints on the effective sampling rate remain as in 7. We again have a convex optimization over a compact set, so we will have a globally optimal solution. Note that if γ1 = 0 and the constraint on the total quantity of filtering θ is added, we arrive at the centrality-based problem. The centrality and sampling cost-based problem can be solved using the same methods as for the centrality-based problem. D. Effective Sampling Rate and Filtering Cost-Based Problem In this problem we minimize a cost that combines the cost of enabling traffic filters at routers and also a per-packet sampling cost less a utility that captures the benefit of higher effective sampling rates. A constraint is set up such that each source-destination pair has some minimum effective sampling rate. Assume that fr is the cost of implementing filtering at a particular router r ∈ R per time step. Let yr be a discrete variable (yr = {0, 1}) that indicates whether or not filtering is enabled at a particular router. Moreover, we assign a utility to sampling sourcedestination pair traffic. Thus in certain cases it will be beneficial to filter so as to achieve effective sampling rates above the minimum required effective sampling rate. We then minimize the costs associated with filtering packets and implementing filters less this utility. Let us define this utility function as U (ρj , j) = ρj sj dj . (9) In this case we simply multiplicatively weight ρj by the value of the destination dj and the suspicion level of the source sj . This problem then becomes the mixed-integer non-linear program (MINLP) defined as
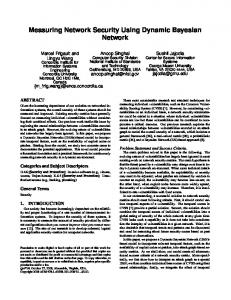
Fig. 1. Topology of the Abilene network.
min p,y
X
[fr yr + yr cr pr ur ] − γ2 u ¯
r∈R
X
U (ρj , j).
(10)
j∈P
An interesting special case of this problem is when γ2 = 0. Then the concern is simply to achieve the constraints on p and the effective sampling rates ρj while minimizing the filtering costs. The constraints on the effective sampling rate are similar to those in previous problems. Suppose also that a vector pmax denotes the maximum filtering rate available at each r ∈ R. Then, the set of constraints are:
Input: Traffic measurements for last time step, network topology, network routing Output: Filter configuration f , filtering rates g Solve optimization problem defined by (10) and (11) with continuous yr values; foreach r ∈ R do if yr pr < α/3 then yr ← 0 else yr ← 1; end f ← resulting configuration; Keeping the yr values fixed at f , again solve the optimization problem defined by (10) and (11); g ← resulting filtering rates; m ← resulting cost; foreach r ∈ R do if yr = 1 then yr ← 0 else yr ← 1; f 0 ← resulting configuration; Keeping the yr values fixed at f 0 , again solve the optimization problem defined by (10) and (11); g0 ← resulting filtering rates; c ← resulting cost; if c < m then m ← c; f ← f 0; g ← g0 ; Restart for loop. end end Algorithm 1: Algorithm for finding optimal filter configuration and filtering rates
ρj ∈ [α, 1] ∀j pr ∈ [0, pmax (r)] , r ∈ R yr ∈ {0, 1}, r ∈ R
(11)
A globally optimal solution to this problem will exist, but it may not be unique. For each filter configuration (specification of which routers have filtering enabled and which do not), we have a linear optimization problem on a compact set, which will have an optimal solution that may not be unique. If this optimization problem is solved for each possible filter configuration (there are 2R such configurations), we will be able to find the (potentially nonunique) globally optimal solution. We use Algorithm 1 to solve the resulting MINLP for a small network (tens of nodes) in two steps. Here a filter configuration indicates which routers will have routing enabled and which will not. We enable routers where yr pr ≥ α/3 because these are routers where the optimization process indicates that a nontrivial quantity of filtering should occur. Note that this algorithm is guaranteed to find a router-by-router minimum but not necessarily the global minimum. III. S IMULATIONS
AND
R ESULTS
We utilized actual traffic data from the Abilene project for our simulations [11]. Fig. 1 shows the Abilene network topology.
A. Constrained Centrality-Based Problem Results When simulating the constrained centrality-based problem described by (3), (5), and (7), we compared our optimal solution (described in Section II-B) with a benchmark approach. The most likely heuristic to be applied in a variety of contexts is to simply filter as much traffic as possible. This benchmark strategy can be specified as a linear program which is solved at each time step. The objective ofPthis linear program is to filter as much as possible: maxp r∈R pr . The constraints are given by (5) and (7). The upper bound on filtering at each time step will be set to 600 million bits per time step. The lower bound on the effective sampling rate (α) is 0.15. The two filtering approaches are compared by investigating the costs incurred by each. The cost incurred when using the optimal solution to the filtering problem (2.83 × 10¹²) is consistently but not significantly lower than the cost incurred when using the benchmark approach (3.00 × 10¹² ). In fact, this is only about a 5.75% improvement. The benchmark approach picks filtering rates such that as much filtering as possible (given the θ constraint) is performed. The optimal approach also filters θ packets because filtering more packets leads to lower costs, and so this bound is tight. How the available filtering is distributed across the routers does matter, and the optimal solution achieves a slightly lower cost by filtering more at routers with high centrality measures.
TABLE I
TABLE III
ROUTER T RAFFIC - WEIGHTED S TRESS C ENTRALITY AND F ILTERING
R ESULTS OF E FFECTIVE S AMPLING R ATE AND F ILTERING C OSTS
R ATES UNDER B ENCHMARK AND O PTIMAL A PPROACHES TO THE C ONSTRAINED C ENTRALITY-BASED P ROBLEM
P ROBLEM S IMULATIONS WITH VARIOUS γ2 VALUES
Router
CTS (r)
Optimal
Benchmark
γ2
STTL SNVA LOSA NYCM WASH DNVR HSTN KSCY CHIN IPLS ATLA
201 370 246 518 393 670 215 793 593 815 305
0.068 0.080 0.060 0.087 0.055 0.100 0.077 0.200 0.054 0.221 0.067
0.411 0.000 0.150 0.289 0.000 0.150 0.289 0.000 0.000 0.150 0.150
0.025 0.05 0.5
Benchmark Cost Filtered (×106 ) 1190 384 866 384 -5040 384
Algorithm 1 Cost Filtered (×106 ) 715 595 208 768 -13800 912
% Improvement 40.1% 76.0% 173%
a quarter of that. More than two-thirds of the cost of implementing the benchmark approach is a result of the filtering cost, while this cost only accounts for a quarter of the optimal approach’s cost. This leads the optimal approach to incur a 38.8% lower cost than the benchmark approach. C. Effective Sampling Rate and Filtering Costs Problem Results
Thus, these two approaches lead to similar cost results. It is interesting to examine how the filtering is distributed by the optimal solution, as this is what leads to its lower cost. Table I shows the filtering rates at each router specified by the optimal and benchmark approaches as well as the trafficweighted stress centrality of each router for a particular time step. In general, higher CTS (r) values lead to higher filtering rates at routers for the optimal solution, but not for the benchmark solution. This allows the optimal solution to achieve a lower cost even while filtering the same quantity of traffic as the benchmark approach. B. Centrality and Sampling Costs Problem Results Here we consider simulations of the problem specified in Section II-C. For this problem we use the same approach as for the constrained centrality-based problem. The results in this case depend largely on the value of the γ1 parameter in the centrality and sampling costs problem ((8) and (7)). Thus, results are presented for various values of the γ1 parameter in Table II. We will use the same benchmark approach as in Section III-A, but without the constraint on total filtering. In each case in Table II the optimal solution to the problem performs better than the benchmark approach. The γ1 parameter captures the trade off between the two costs in this problem (8). When γ1 is zero as in the first simulation, there is no cost on filtering packets and we have the same problem as the constrained centrality-based problem but without the upper bound on filtering (θ). Thus in this case the optimal solution chooses to filter significantly (1043 million bits per time step). The benchmark approach also filters significantly (948 million bits per time step) and thus is quite competitive with the optimal solution. The optimal solution achieves a lower cost by distributing its filtering mostly to the routers with the highest centrality. As the γ1 parameter increases, the optimal solution filters less because a cost is incurred when sampling traffic. When γ1 = 10, the benchmark approach filters near 1000 million bits per time step, but the optimal solution filters just over
In this section we discuss simulations of the problem specified in Section II-D. 1) No Utility Consideration (γ2 = 0): First we will examine the special case of (10) where γ2 = 0. This means that constraints on the effective sampling rate (11) must be met, but there is no utility award for achieving higher effective sampling rates. We set cr = 1 and fr = 100. We also set pmax to be 0.20. This means that each router can filter at most 20% of its traffic, which could be the result of a hardware constraint. We compare the solution determined by algorithm 1 with a benchmark approach of simply filtering at a rate of α/2 at each router. The average cost per time step incurred by the benchmark solution is 1520, while the sub-optimal solution leads to an average cost of only 1110. This represents a cost savings of 27.0%. The choice of filter placement suggested by algorithm 1 meets the constraints on the effective sampling rate while using only six filters. By using five fewer filters than the benchmark approach this solution generates cost savings. 2) With Utility Consideration (γ2 6= 0): For these simulations the source and destination weights will be set to 1. As in Section III-C.1, the cost on filtering a unit of traffic is set to 100 times cheaper than the cost of enabling a filter at a router for one time step. We set the maximum filtering rate pmax to 0.20 for these simulations while the benchmark approach will be the same as used in Section III-C.1. In this benchmark approach, all routers are utilized as filters. The results, as for the centrality and sampling costs problem, depend largely on the value selected for γ2 . As γ2 becomes larger, the utility achieved by higher effective sampling rates becomes the a more important factor in the minimization problem, and thus filtering at higher rates and enabling more filters becomes reasonable. Eventually, filtering as much as possible without redundant filtering becomes optimal. Table III shows the cost results and average number of packets filtered for various values of γ2 . The solution generated by algorithm 1 always achieves a lower cost. When γ2 increases even slightly from 0 to 0.025,
TABLE II C OSTS FOR O PTIMAL AND B ENCHMARK S OLUTIONS TO THE C ENTRALITY AND S AMPLING C OSTS P ROBLEM Benchmark
Optimal
γ1
Filtered (×106 )
Cost (×1012 )
% Filtering
Filtered (×106 )
Cost (×1012 )
% Filtering
% Improvement
0 3 5 10
948 948 948 948
2.41 3.88 4.85 7.30
0.00% 37.8% 50.4% 67.0%
1043 316 270 226
2.23 3.67 3.95 4.46
0.00% 13.2% 17.4% 25.8%
7.92% 5.23% 18.6% 38.8%
Effective Sampling Rate for Traffic From Seattle at time step 2 1 0.9
Effective Sampling Rate
0.8 0.7 0.6 0.5 0.4 0.3 0.2 Optimal Benchmark
0.1 0
SNVA LOSA NYCM WASH DNVR HSTN KSCY CHIN IPLS ATLA Destination
Fig. 2. Effective sampling rates for traffic originating in Seattle at time step 2 under algorithm 1 and the benchmark approach.
the solution from algorithm 1 begins to filter more than when γ2 = 0. The algorithm filters more because of the utility to be gained by filtering. This utility gain decreases the cost and leads to a greater cost reduction when algorithm 1 is used instead of the benchmark approach than in the case where γ2 = 0. These trends continue as γ2 increases. By the time γ2 has increased to 0.5, algorithm 1 filters as much as possible. Fig. 2 shows the dramatic difference in the effective sampling rates resulting from the benchmark approach and algorithm 1 at a particular time step when γ2 = 0.5. IV. C ONCLUSIONS
AND
F UTURE W ORK
We have studied malware filter placement problems from an optimization perspective. After drawing the connection between traffic-weighted centrality measures and traffic measurements at routers, we chose a convex cost objective involving centrality measures. The first optimization problem we considered involves minimizing this cost subject to sampling and effective sampling rate constraints, as well as a constraint on the amount of traffic that can be filtered network-wide. Next we studied the case where instead of placing a hard upper bound on the quantity of filtering, we assign a cost to filtering and minimize a sum of it and the cost metric derived earlier. We then minimized a different cost metric involving a sum of filter deployment and filtering costs less a utility measure under the same constraints. We found exact or approximate centralized and dynamic solutions to these optimization problems and simulated the resulting strategies. Network traffic data from the Abilene
dataset was used in these simulations. We compared these strategies with benchmark approaches to network traffic filtering. The simulation results confirm that by applying optimization tools we can achieve lower costs in a variety of contexts and when traffic magnitudes change rapidly. There are several obvious extensions to this work. The optimization problems developed here should be solved in a decentralized manner for increased reliability and security. Various update algorithms could be considered when evaluating decentralized solutions. A natural extension to this paper would involve incorporating filter effectiveness with Bayesian analysis. This would allow for a comparison between signature-based and anomalybased filters. Constraints on the amount of signature-based and anomaly-based filtering could be set. Finally, we are planning to use the Abilene data to perform more thorough simulations with the realistic Network Security Simulator (NeSSi), described in [8], [12]. R EFERENCES [1] Reuters, “The cost of ‘code red’: $1.2 billion,” USA Today, Aug. 2001, http://usatoday.com/tech/news/2001-08-01-code-red-costs.htm. [2] D. Moore, V. Paxson, S. Savage, C. Shannon, S. Staniford, and N. Weaver, “Inside the slammer worm,” IEEE Security & Privacy Magazine, vol. 1, pp. 33–39, July-Aug. 2003. [3] D. Moore, C. Shannon, and K. Claffy, “Code-red: a case study on the spread and victims of an internet worm,” in Proc. of ACM SIGCOMM Workshop on Internet measurement, Marseille, France, 2002, pp. 273– 284. [4] Cisco, “Network security features on the Cisco integrated services routers,” data sheet, 2005, http://www.cisco.com/application/pdf/en/us/guest/products/ps5854/ c1650/cdccont 0900aecd80169b0a.pdf. [5] G. R. Cantieni, G. Iannaccone, C. Barakat, C. Diot, and P. Thiran, “Reformulating the monitor placement problem: Optimal network-wide sampling,” February 2005. [Online]. Available: citeseer.ist.psu.edu/753975.html [6] K. Suh, Y. Guo, J. Kurose, and D. Towsley, “Locating network monitors: complexity, heuristics, and coverage,” in Proc. of 24th IEEE Infocom, Miami, FL, USA, March 2005. [7] M. Kodialam and T. V. Lakshman, “Detecting network intrusions via sampling: A game theoretic approach,” in Proc. of 22nd IEEE Infocom, vol. 3, San Fransisco, CA, USA, April 2003, pp. 1880–1889. [8] K. Luther, R. Bye, T. Alpcan, A. M¨uller, and S¸. Albayrak, “A cooperative AIS framework for intrusion detection,” in Proc. of IEEE Int. Conf. on Communications (ICC-2007), Glasgow, Scotland, June 2007. [9] U. Brandes, “A faster algorithm for betweenness centrality,” Journal of Mathematical Sociology, vol. 25, no. 2, pp. 163–177, 2001. [10] D. Bertsekas, Nonlinear Programming, 2nd ed. Belmont, MA: Athena Scientific, 1999. [11] Abilene, “Abilene network data,” http://abilene.internet2.edu/. [12] K. Luther, R. Bye, S. Schmidt, K. Bsufka, T. Alpcan, and S. Albayrak, “NeSSi - A network simulation tool for the security domain,” white paper, 2005.