Department of Tropical Plant & Soil Science, University of Hawaii at Manoa, ... The College of Tropical Agriculture and Human Resources Journal Series No.
Agricultural Systems 65 (2000) 1±27
www.elsevier.com/locate/agsy
Management-oriented modeling: optimizing nitrogen management with arti®cial intelligence$ MengBo Li *,1, R.S. Yost Department of Tropical Plant & Soil Science, University of Hawaii at Manoa, Honolulu, HI 96822,USA Received 6 January 2000; received in revised form 15 May 2000; accepted 22 May 2000
Abstract Increasing nitrate levels in groundwater have been attributed to inappropriate nitrogen (N) management. The application rates, timing, and methods of both N fertilization and irrigation are important management tools that determine and control the fate and behavior of N in soilÿplant systems. For example, multiple applications with small amounts of fertilizer (e.g. split application) usually enhance plant uptake and reduce potential nitrate leaching, although increasing costs. Precision N management requires that the models evaluate so many alternatives that traditional N models are challenged beyond their intended use. The objective of this study was to construct and test a model that searches for optimal N management to: (1) minimize nitrate leaching; (2) maximize production; and (3) maximize pro®ts. Managementoriented modeling (MOM), a dynamic simulation modeling with arti®cial intelligence optimization techniques, was developed for these purposes. MOM consists of a generator that generates a set of plausible management alternatives, a simulator that evaluates each alternative, and an evaluator that determines which alternative meets the user-weighted multiple criteria. MOM uses `hill-climbing' as a strategic search method that uses `best-®rst' as a tactical search method to ®nd the shortest path from start nodes to goals. In a maize production scenario, MOM found an optimal management solution that would have increased the pro®t from $570 to $935 haÿ1 and reduced the nitrate leaching from 36 to 7 kg N haÿ1. Goal-driven simulation of MOM oers new opportunities to balance N and irrigation water management while meeting multiple objectives. # 2000 Published by Elsevier Science Ltd. Keywords: Nitrogen optimization; Arti®cial intelligence; Heuristic searching; Simulation; Water quality; Nitrogen use eciency
$
The College of Tropical Agriculture and Human Resources Journal Series No. 4477. * Corresponding author. 1 Former graduate student at University of Hawaii: MS in Information & Computer Sciences, PhD in 0308-521X/00/$ - see front matter # 2000 Published by Elsevier Science Ltd. PII: S0308-521X(00)00023-8
2
M. Li, R.S. Yost / Agricultural Systems 65 (2000) 1±27
1. Introduction Improving nitrogen (N) management has become essential in recent years because of increased levels of nitrate in groundwater associated with high rates of N applied to crops. The application rates, timing, and methods of both N fertilization and irrigation are ways to improve N management. For example, multiple applications with small amounts of fertilizer (e.g. split application) usually enhance plant uptake and reduce potential nitrate leaching, although increasing costs. The increased cost and labor requirements are examples of competing objectives of high-yield requirements to meet demands for food and raw material for industries, but also concern for environmental impairment, all while making a steady, dependable income. The number of possible combinations of N application rate and timing as well as irrigation application rate and timing are so great that assistance is needed in identifying appropriate combinations. Decision-aids that include some assistance for determining management options would obviously be of great value. There are an increasing array of simulation models for N becoming available, however, relatively few are designed to support the evaluation of competing objectives that is necessary in environmentally sensitive crop N management. Optimizing N management is often confused in discussions among agronomists meaning the adjusting of N applications to `synchronize' applications with crop requirement and the systems science term, which means identifying a combination of factors which best meets speci®ed criteria. In this paper we will use the term optimize in the latter sense and discuss the development and implementation of optimizing routines. This distinction is important because the goal of N management can not be assumed to only `synchronize' N fertilizer applications. Several procedures are available to achieve an `optimum' solution of a decision. One of those sometimes used is the linear programming approach, whereby an objective function is either minimized or maximized, subject to a number of mathematical constraints (Anderson et al., 1994). If the problem can be satisfactorily expressed in numerical terms and the constraints are linear the method works well. An example determining the optimum liming material for soil improvement subject to a complex set of characteristics and requirements is described in Li et al. (1995). Another method of optimizing is `dynamic programming'. This approach has been used more often in optimizing irrigation scheduling than nutrient application (Yakowitz, 1982). Plant and Stone (1991) concluded that implementation of dynamic programming in agriculture was complicated because: (1) the accuracy of the system model may be insucient; (2) the model parameters may be dicult to estimate; and (3) the model computations become intensive with stochastic situations. Another approach to optimization has been to embed knowledge-based systems in simulation models. An example of such a system was Schaub and Stone (1989) who designed a system that consisted of three simulation models combined together using a rule-based system. These authors used arti®cial intelligence (AI) search methods, speci®cally heuristic search methods, to ®nd nearly optimal rules for pest control (Schaub and Stone, 1989). The objective of the study and software development eort described herein was to attempt to use heuristic rules and information to
M. Li, R.S. Yost / Agricultural Systems 65 (2000) 1±27
3
guide the simulation and in the evaluation of the results. In addition we wanted to develop a system that recognized the existence of multiple goals and obtained solutions according to criteria that implemented each of the goals, but with the user's choice of emphasis and priority. 2. Methods and materials 2.1. MOM structure 2.1.1. Search techniques Using simulation models that mimic ®eld experiments in order to ®nd optimal management strategies can be illustrated by a simple example called `burgling a safe' using generate-and-test method in AI (Winston, 1992). To try a three-number and two-digit safe, one can start with the combination 00-00-00, move to 00-00-01, then 00-00-02, and continue on through all possible combinations until the door opens. In AI terms selecting the combinations is called the generation procedure and the twisting the safe handle is called the testing procedure. One of the classic applications using this AI technique is DENDRAL (Winston, 1992). This method was used to identify the structure of an organic chemical by comparing the real-mass spectrogram with those produced by a computer generator. To use simulations to conduct experiments with fertilizer and irrigation rates, for example, the procedure of designing treatments in the experiment is performed by the `generator' and analyzing results of experiment is carried out by the `tester' in the generate-and-test method. So there are three components, a generator, a simulator, and an evaluator, involved in the experiment conducted by computer simulation. In our experiments, the generator produces the combinations of management strategies (e.g. the treatments of fertilizer N rates and timing plus irrigation rates and timing). The simulator executes the management strategies and simulates their eects on a soil±plant system such as nitrate leaching, crop yields and pro®ts. The evaluator examines the simulation results to ®nd which management strategy produces a better result (e.g. less nitrate leaching, higher yields and pro®ts). If one wants to ®nd optimal combinations of fertilizer rates plus irrigation rates, the evaluator information can be fed back to the generator to adjust the rates of both fertilizer and irrigation. This experimental procedure is repeated until acceptable solutions are found. The experiment is conducted by the computer models using a `generator±simulator± evaluator' procedure. Since this modeling approach concentrates on optimizing management strategies, we call it management-oriented modeling (MOM). The MOM structure is shown in Fig. 1. 2.2. MOM characteristics 2.2.1. Two-way modeling There are at least two ways for decision-makers to interact with the real world. First, the world is described and understood by mapping the real world to the
4
M. Li, R.S. Yost / Agricultural Systems 65 (2000) 1±27
Fig. 1. Management-oriented-modeling structure.
decision-maker's brain. Second, after understanding, decision-makers make some `modi®cations' to control and change the real world (Fig. 2). Many existing N simulation models simulate the N cycle in soil±plant systems based on inputs of soil, plant, weather and management data (Yost and Li, 1997). This is an important type of modeling, `description'. In addition to description, MOM is designed to model the decision-maker's `modi®cation' of the real world. In other words, MOM not only attempts to simulate natural processes of the real world, but also to simulate human actions on the real world to search for possible optimal `modi®cations.' We call this modeling approach two-way modeling. After analyzing `native' situations (without the fertilization and irrigation) of a soil±plant system, MOM selects a management action of fertilization and irrigation to `modify' the `native' situations. Then the management eects on the soil±plant system are evaluated to determine if they are improvements toward optimal management strategies. If no optimal management strategies are reached, MOM improves the management strategies and repeats the simulations to assess the management eects. MOM continues to repeat alternately between the two ways of modeling as the processes above until optimal management strategies are found according to user-speci®ed criteria (Fig. 2). 2.2.2. Goal-driven modeling Traditionally simulation models were driven by data. For example, to reduce nitrate leaching during cropping, the modeling starts from the management practices under given local natural conditions and outputs predictions of crop yield and N leaching. The solutions are crop yields and leachate nitrate. The modeling processes are driven by data, including management practices, hence the term `datadriven' modeling. The number of input datasets determines how many sets of model outputs are generated (Fig. 3). In many circumstances of N management practices,
M. Li, R.S. Yost / Agricultural Systems 65 (2000) 1±27
5
Fig. 2. Diagram of two-way modeling between human actions and natural processes of the real world.
however, people want N models to assist in ®nding optimal management strategies that are better than current ones, instead of only an assessment of the current practices. To meet these objectives the model solutions become management strategies. To solve this kind of problem, the modeling starts from user goals, such as high crop yields and low nitrate leaching. Then it simulates the possible management practices under local physical conditions and outputs optimal management strategies that can reach the goals (Fig. 3). The modeling direction is reversed from the traditional simulation modeling. In MOM modeling, the amount of management data needed depends upon the goals. MOM only chooses management strategies that produce the results approaching the user-speci®ed goals. We call this modeling `goal-driven' modeling. This goal-driven simulation is one of the ways that MOM diers from the traditional simulation models. 2.2.3. Multiple solutions In reality, there are often multiple solutions for a goal. For example, among all possible combinations of the N management strategies, some combinations with dierent fertilizer and irrigation rates may result in approximately the same yield and/or nitrate leaching (refer to Fig. 3). In other words, MOM may ®nd multiple answers for a goal without changing the data inputs and given physical conditions. This characteristic provides users with opportunities to choose the most suitable solution among a group of answers. It also oers users alternative solutions if their situations change.
6
M. Li, R.S. Yost / Agricultural Systems 65 (2000) 1±27
Fig. 3. Comparing data-driven modeling with goal-driven modeling.
2.2.4. Knowledge representation A knowledge representation principle says `once a problem is described using an appropriate representation, the problem is almost solved' (Winston, 1992). To solve the problems of N management using AI techniques, the major task is to appropriately represent the knowledge of the N management with AI language. Assume that a set of management strategies consist of N fertilizer applications and irrigations of various rates and timing. Each management strategy produces a pro®t, crop yield, and N leaching rate (Table 1). MOM's task, for example, is to ®nd which management strategy produces a maximum crop yield and pro®t with a minimum N leaching, among the seven strategies in this example.
Table 1 Hypothetical management strategies and their simulated results Management strategy No.
N Fertilizer Rate (kgN haÿ1)
Timing applicationsa
Rate (mm)
Timing applicationsb
1 2 3 4 5 6 7
80 80 80 60 240 240 240
14 14 2 14 2 14 2
407 136 271 407 136 271 271
2 2 2 7 2 7 2
a b
Irrigation
Number of N fertilizer applications during the cropping season. Number of irrigation days a week.
Pro®t ($ haÿ1)
Yield (kg haÿ1)
Leachate N (kgN haÿ1)
461 475 685 742 759 802 976
7480 7486 7797 10399 8611 11003 10881
40 0 15 37 0 8 8
M. Li, R.S. Yost / Agricultural Systems 65 (2000) 1±27
7
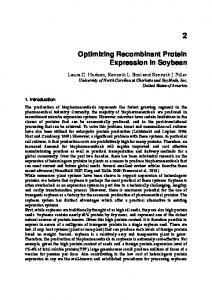
To visually illustrate the AI representation for this example, the pro®ts against leachate N were plotted in Fig. 4. The points (circles) in Fig. 4 represent the N management strategies (rates and times of fertilizer application and irrigation) in Table 1, which are called `nodes' in terms of AI language (Winston, 1992). The result (crop yield, pro®t and leachate N) of each corresponding management strategy is called the `state' of the node. To perform MOM's task, ®nding a better management strategy, the system compares the results of the management strategies one by one until the answer is found. The process of examining the results to ®nd solutions is called the `search'. During the search, a move from one node to another is called a `link' or `path' between the nodes. A path or link denotes a transition between states, which is actually a change of the management strategy in MOM. The nodes linked by paths form a `semantic net'. It is also called a `state space' in which the states of nodes are represented by their positions in a two-dimension space (e.g. a plot of pro®ts vs. leachate N in Fig. 4). The search `objective', an optimal management strategy in this example, is called a `goal'. The node that satis®es the goal is called a `goal node'. The state of the goal node, characterized by a minimum of N leaching and maximum of the yields and pro®ts in this example, is also called a goal in the following discussion. So the `goal' in MOM consists of three sub-goals: minimizing N leaching, maximizing yields, and maximizing pro®ts. MOM's task, in AI language, is ®nding `goal nodes'. Comparing the pro®ts, yields, and leachate N of all management strategies, the states of the nodes of strategy Nos. 6 and 7 (Table 1), for example, are closer to the goal state than others. If three sub-goals are of the same importance, an overall nearly optimal solution among the strategies is management strategy No. 7 for this example.
Fig. 4. Knowledge representation in management-orientated modeling using arti®cial intelligence language. The state space consists of nodes linked by paths. The states of the nodes are denoted by their positions in the space with dimensions of pro®ts versus leachate nitrate.
8
M. Li, R.S. Yost / Agricultural Systems 65 (2000) 1±27
3. Results 3.1. Implementation 3.1.1. MOM generator The MOM generator (Fig. 1) is designed to produce a plausible set of N management strategies consisting of the rates and timing for N fertilizers and irrigation. Winston (1992) suggested that a good generator usually has three properties: complete (eventually producing all possible solutions), nonredundant (never compromise eciency by proposing the same solution twice), and informed (use possibilitylimiting information, restricting the solutions that they propose accordingly). 3.1.1.1. Combinations of management strategies. Recalling the example of `burgling a safe' in Section 2.1, the total combinations for the safe of three-number with twodigit are 1003=one million. The situation of N management is much more complicated than this example. Among the N management factors, the rates and timing of both N fertilizer and irrigation are chosen to test the MOM concept in this study Ð which are the important factors in controlling the fate of N in soil-plant systems. Changing these factors will change crop yields, pro®ts, and nitrate leaching rates, which are the goal states of three sub-goals in MOM. Consider N management practices that specify fertilizer rates and irrigation rates which are split during the cropping season. An N management strategy in MOM consists of three factors: fertilizer rate, irrigation rate, time (what day or frequency of fertilization and irrigation). It can be expressed as: Mi f
fertilizerRatei ; irrigationRatei ; Timei
1
where Mi is a management strategy in MOM (i=1, 2, 3,. . .1). Theoretically there are an in®nite number of combinations of management strategies. To simplify the situation by considering only three rates for N fertilizer and three rates of irrigation during a 140-day cropping season, the problem becomes one of ®nding an optimal management combination among three N fertilizer rates combined with three irrigation rates scheduled during 140 days. The number of combinations from the fertilizer rates and the irrigation rates with a time factor can be calculated by: Combination
fertilizerRates � irrigationRatestime
2
It implies that the number of management combinations in dynamic systems will increase exponentially because of involving the time factor (what day or frequency of fertilization and irrigation). For instance, the management strategies for scheduling 1 day are nine combinations (fertilizerRates�irrigationRates=3�3=9). However, the number of combinations for 2 days is 92=81, and 93=729 for 3 days. The total number of the combinations for a 140-day cropping cycle is 9140�4�10133. Reducing the time steps to weekly applications, the total number of the combinations is 920�1019, still an astronomical ®gure. An N management problem is thus far
M. Li, R.S. Yost / Agricultural Systems 65 (2000) 1±27
9
more complex than the `burgling a safe' case. Assuming the simulation of the N cycle in a soil±plant system for a growth season can be ®nished in 0.001 sec, it will theoretically take about 3�108 years to examine all combinations without accounting for the time of search in the computation. 3.1.1.2. Prune unnecessary combinations. Facing the challenge of the huge combinations, the ®rst task for the MOM generator is to reduce the large number of the combinations to a reasonable range in which the most promising combinations are included. Unnecessary combinations can be pruned by analyzing the real situation of the soil±plant system relevant to MOM. In an example of tomato N fertilization experiments (Fig. 5, Yost et al., 1997b), the crop yield increased with increasing N fertilizer rate until a yield plateau (point B in Fig. 5) was reached. The risk of potential nitrate leaching (represented by Excess N in soil pro®les, Fig. 5) was very low when N fertilizer rate was less than the maximum (plateau) crop requirement (point B in Fig. 5). After the N supply exceeded the crop requirements, the soil nitrate increased proportionally. The same analysis can be applied to irrigation rates. For an upland crop, the yield response to increasing water supply may increase at ®rst to a peak, then drop. A general situation of N fertilization with irrigation for an upland crop was summarized in Fig. 6. The ®g. implies that there exists a range (between point `A' to point `B' in Fig. 6) in which the N fertilizer and irrigation rates are close to the crop requirements. Within the range, the optimal solutions for the combined MOM goals, maximizing crop yields and minimizing nitrate leaching, should occur. The range is the area labeled from the point `A' to
Fig. 5. N-BALANCE model predicted and measured tomato yields and excess N remaining in soil with changes of N fertilization rates (Yost et al., 1997).
10
M. Li, R.S. Yost / Agricultural Systems 65 (2000) 1±27
point `B' in Fig. 6, called the `promising solution zone' in MOM. In other words, the management nodes outside of the promising solution zone can be considered as unnecessary combinations and should be pruned. To eliminate unnecessary management combinations, the MOM generator needs a procedure to identify the promising solution zone for each speci®c situation. 3.1.1.3. Determine the promising solution zone. The daily crop requirements of N and water change during growth: MOM needs a dynamic simulation analysis to trace this situation. A situation analyzer, the algorithm estimating soil N and water supply, was developed for the MOM generator to analyze the crop dynamic dierences between crop requirements and soil supplies. In the analysis procedure, MOM generator ®rst detects the `native' supply potential of soil N and water by calling NSIMULATOR (Li and Yost, 1999a) in the background mode (the simulation without N fertilizer and irrigation, see Section 3.1.2). This simulation records soil moisture and soil mineral N content for each growing day. Then daily soil water supply potential can be estimated by soil water supply index, SupIxwater: SupIxwater log
�Background ÿ �PlantLmt �PlantGoal ÿ �PlantLmt
3
where �Background is the background soil water content without irrigation on a simulation day. �PlantLmt is the soil water content at the low plant extractable limit. �PlantGoal is the soil moisture goal that a crop requires. �PlantGoal= K�goal��DrainLmt. �DrainLmt is the soil water content at the drained upper limit (Li and Yost, 1999a). K�goal (0-1) is a coecient of optimal soil moisture for a speci®c crop. K�goal is used to adjust the soil moisture goal. If a crop requires soil moisture at
Fig. 6. The N fertilizer and irrigation rates within promising solution zone (range between point A and point B) nearly match the crop requirements. The optimal solutions for the management-orientated modeling goals should be within this zone.
M. Li, R.S. Yost / Agricultural Systems 65 (2000) 1±27
11
�DrainLmt, K�goal=1.0. If a crop requires soil moisture as a half of �DrainLmt, K�goal= 0.5. The soil water supply index, SupIxwater, can be used to ¯ag the soil water supply to a crop: If SupIxwater=0, the soil moisture satis®es the crop requirement If SupIxwater0, the soil moisture exceeds the crop requirement The daily soil N supply potential is estimated by soil mineral N supply index, SupIxN: SupIxN log
Froot � Nsupply =NplantDemand
4
where NplantDemand is the amount of N a plant demands (refer to Li and Yost, 1999a). Nsupply is soil N supply potential (refer to Li and Yost, 1999a). Froot is a root density fraction (refer to Li and Yost, 1999a). The interpretation of SupIxN is similar as SupIxwater: If SupIxN = 0, soil N supply is sucient for the crop If SupIxN < 0, soil N supply is not sucient for the crop If SupIxN > 0, soil N supply exceeds the crop requirement Examples of the analyses of soil mineral N and water supply potential during a cropping season are shown in Fig. 7. 3.1.1.4. Generate primary management schedule. The previous analyses provide the generator with a dynamic estimation of the shortages of soil N and water supplies. To estimate the amounts of N and water needed on a growing day, the MOM generator compares the amounts of N and water that a crop demands with the soil N and water supply in the `native' situation. The daily water needs, Wneed (mm), is calculated by Wneed 10
K�goal � �DrainLmt ÿ �Actual � Lyr ET ÿ Rain
5
where K�goal, �DrainLmt and �Actual are the same as in Eq. (3). Lyr (cm) is the thickness of a root zone. The daily N needs, Nneed (kg N haÿ1), is calculated by Nneed
NplantDemand ÿ Nuptake =Efert
6
where NplantDemand (kg N haÿ1) is maximum N the crop requires and Nuptake (kg N haÿ1) is the N that the crop absorbs, without applied N fertilizer, on the current simulation day or week. Efert is the amount of N fertilizer absorbed by the crop per unit application (Yost et al., 1997a). With Eqs. (5) and (6), the generator determines approximate amounts of N and water needed (the implementation is calling DetectWater and DetectNitrogen simulation modes. See Section 3.1.2). Then MOM generator produces a `primary management combination', a schedule of N fertilization and irrigation during the
12
M. Li, R.S. Yost / Agricultural Systems 65 (2000) 1±27
Fig. 7. The analysis diagrams of soil water and nitrogen supply potential. The supply indexes in three soil layers show that there exists both water and N shortages in the surface layer in this example.
cropping. This management combination should fall within the promising solution zone, the range from the point `A' to point `B' in Fig. 6. An example of a primary management combination in week steps is shown in Fig. 8. Around this primary management schedule, the generator produces the ®rst group of the management combinations by extending the primary rates of N fertilizer and irrigation. How the generator improves its following generations of management combinations will be discussed in Section 3.1.3. The management strategies can be used by the other two MOM components, the simulator and the evaluator. 3.1.2. MOM simulator To implement Management-Oriented Modeling, the MOM simulator is designed by extending the running modes of the dynamic simulation model, N-
M. Li, R.S. Yost / Agricultural Systems 65 (2000) 1±27
13
SIMULATOR (Li and Yost, 1999a). As the MOM simulator, N-SIMULATOR operates in a MOM session in six simulation modes: Validation, Background, DetectWater, DetectNitrogen, Optimization, and PredictGrowth. 3.1.2.1. Validation mode. Validation mode is a MOM session when NSIMULATOR simulates datasets without changing original management factors. The primary purpose of this mode is designed for users to calibrate the MOM simulator parameters to their speci®c site situations using local datasets. This mode enables users to use MOM as a traditional simulation model for any purpose with-
Fig. 8. A primary management combination in weekly steps, the schedule of N fertilization and irrigation, is produced by the management-orientated modeling generator. The schedule nearly synchronizes the crop requirements during the growth.
14
M. Li, R.S. Yost / Agricultural Systems 65 (2000) 1±27
out the optimization of management. The default outputs of the Validation mode are database ®les and screen graphics. The graphic outputs are used to analyze the simulation results immediately during the simulation. They include daily outputs of soil water and N supply potential, in®ltration, fertilization, crop N uptake, leachate nitrate, soil nitrate content and soil ammonium content in three soil layers during the cropping season. The output ®les are in Paradox1 format that can be retrieved by spreadsheets such as Quattro Pro1, or Excel1, and used for further analysis and assessment. The default outputs in the database ®les include runo, in®ltration, waste irrigation N, fertilizer N, top biomass N, root N, leachate nitrate, denitri®cation, and predicted soil-layer nitrate, ammonium, soil-moisture content, and organic N released from several pools including soil-organic matter, organic wastes, and waste irrigation. 3.1.2.2. Background mode. A `native' situation in MOM is a simulation in which no N fertilizer or irrigation are applied. All other management activities are included in the `native' situation such as pest control and preplant organic residues, which are treated as natural or existing conditions like rainfall in MOM sessions. The Background mode ignores the fertilizer and irrigation applications in the data inputs and has the same outputs as the Validation mode. This mode is primarily designed as a tool to analyze an unmanaged crop. This background information is used to determine what amount of N and water are needed and when they are applied as users adjust the management strategies manually. This mode is also useful for a strategic management planning before cropping even if users do not use MOM sessions. 3.1.2.3. Detect water, detect nitrogen modes. The speci®cations of the DetectWater, DetectNitrogen modes are described in Section 3.1.1.4. Since the `native' situation would change with any application of fertilizer or irrigation, Eqs. (5) and (6) cannot be statically used to calculate the N and water requirements based on the initial situation. For example, if fertilizer or irrigation is applied at any time, the situations of following days are no longer `native'. Assuming there exist N and water shortages on 7th and 8th weeks in a `native' situation and then N fertilizer and water are applied on 7th week, for example, the original shortages on 8th week may decrease or disappear. Therefore, the eects of the N and water applications in a previous week must be accounted for in estimating the requirements of N and water for following weeks, when determining the primary management strategies based on the `native' situation. In DetectWater mode, MOM assumes that the crop grows normally without N de®ciency, and that normal evapotranspiration of the soil±plant system will prevail during the cropping season. At the beginning of a simulation week, the MOM simulator ®rst estimates the amount of water needed this week by accumulating the amount of water shortage in soil layers using Eq. (5). Then the simulator applies this amount of water to the soil during the daily simulation for this week, on the week days that users scheduled. The applied water will change soil moisture of the week. This changed soil moisture will be used to estimate the amount of irrigation for the following week by Eq. (5). At the beginning of the following week, the simulator
M. Li, R.S. Yost / Agricultural Systems 65 (2000) 1±27
15
estimates the irrigation amount again, and then repeats the above processes week by week. Finally the simulator determines weekly water requirements, or a primary irrigation schedule, for the cropping season (Fig. 8). Based on this irrigation schedule, the simulator switches to estimate the N requirement in the DetectNitrogen mode. In the DetectNitrogen mode, the implementation procedure is dierent from that in the DetectWater mode. In the DetectWater mode, the water requirement of a week can be determined before the beginning of the week simulation because all items in Eq. (5) have been known in advance. But the N requirement of a week, in the DetectNitrogen mode, cannot be determined by Eq. (6) in advance unless the simulation for this week has been ®nished. This is because the amount of N uptake during a week without N fertilizer, Nuptake in Eq. (6), is unknown before the simulation of this week is ®nished. So MOM ®rst estimates Nuptake by simulating this week without N fertilizer applied. Then the amount of N needed during this week, Nneed, is calculated by Eq. (6) and is immediately applied at the end of simulation for the week. Since the applied fertilizer may not be depleted or lost immediately and the crop can usually continue to utilize the fertilizer in following weeks, slightly late (a couple of days) application of Nneed can be considered as nearly on time when it should be applied at the beginning of the week. The major eects of the applied fertilizer on the soil±plant system will be re¯ected in the simulation of the following weeks. The simulator repeats the earlier procedures week by week. At the end of the simulation of DetectNitrogen mode, approximate weekly requirements of soil N supply are detected. The results of the DetectNitrogen and the DetectWater mode are used to generate the primary management combinations (Fig. 8). 3.1.2.4. Optimization, predict growth modes. After the management combinations are generated, a series of experiments are needed to examine the results of the proposed management strategies. The Optimization mode is designed to conduct this series of experiments. This mode uses the same dataset as the Validation mode except for the schedule of N fertilizer and irrigation. The Optimization mode runs N fertilizer and irrigation treatments only from the management combinations produced by the generator, ignoring original management schedules contained in the dataset if any. Although the Optimization mode runs the same N-SIMULATOR processes as the Validation mode, it only outputs three results: crop yields, pro®ts, and leachate nitrate, which are associated with the MOM objectives. The results are saved with the code of management combinations in a working ®le which is retrieved by the MOM evaluator later to search for optimal solutions. The few outputs will ensure MOM execution eciency because the Optimization mode will be called repeatedly until optimal solutions are found. The PredictGrowth mode is designed to predict the response of the soil±plant system to the management combinations. Its outputs and inputs are the same as the Validation mode, except for the inputs of N fertilizer and irrigation data that are one of the management strategies that users have selected. When an optimal solution is found, users can immediately examine the eects of the solution on the soil±plant system graphically by running the PredictGrowth mode. The PredictGrowth mode also outputs the simulation results to database ®les that can be used for further
16
M. Li, R.S. Yost / Agricultural Systems 65 (2000) 1±27
analysis. In addition, the PredictGrowth mode is often used to observe the detailed eects of the management alternatives users selected during the MOM searching sessions. This tool helps users evaluate MOM searches when they try to guide the search process. Users are encouraged to join and guide the MOM searching process when they work on speci®c cases, although the MOM can automatically ®nd optimal solutions. 3.1.3. MOM evaluator The evaluator uses built-in knowledge and user input to analyze the outputs of the simulator and guide the generation of new management options. As speci®ed in the MOM structure, the evaluator employs AI techniques to examine the eects of management strategies to ®nd optimal solutions that produce less nitrate leaching, higher yields and pro®ts. 3.1.3.1. Strategic and tactical search. Recalling the terminology described in Section 2.2.4 and Fig. 4, the evaluator's task is to search for the `nodes' (management alternatives) that satisfy MOM `goals', among the enormous number of potential nodes. To illustrate MOM search methods, the management nodes (alternatives) are displayed in two dimensions of MOM sub-goals, potential nitrate leaching versus pro®ts, to form a `semantic net` for the search (Fig. 9). For example, the evaluator is assigned to ®nd the nodes that nearly match the two sub-goals: high pro®ts and low nitrate leaching. In actual simulations the number of possible nodes in MOM are far more than those given for illustration. The nodes in Fig. 9 are assumed to be the `primary management combinations' that are close to the solutions. Although the search starts near the goals, a limited search time is still computationally challenging because MOM must simulate an entire cropping season for each node. An eective search algorithm was required to ®nd the shortest path from the start node to the goal node without examining all nodes. The hill-climbing and best®rst are two heuristically informed search methods that improve search eciency (Winston, 1992). The hill-climbing search moves through a tree of paths as the depth®rst search does, except that the choices are ordered according to some heuristic measure of remaining distance to the goal. In the best-®rst search, forward motion is from the best open node so far, no matter where that node is in the partially developed search tree, even though it does not lead to the goal with certainty (Winston, 1992). To ensure MOM reaches the goals eectively, a mixed search method, hillclimbing as a strategic search method that uses best-®rst as a tactical search method2 was developed for MOM to ®nd the shortest path from start nodes to goals. The absence of a speci®c goal state is the second challenge for the MOM search algorithm. In other words, MOM cannot specify a certain amount of pro®t or a speci®c nitrate leaching rate as a goal before the simulation. That is, the actual highest pro®t and the lowest leaching rate are unknown before the simulation begins. This problem occurs in other biological systems that employ AI search 2 In addition to hill-climbing and best-®rst methods, other concepts of AI techniques were involved in constructing the MOM search algorithm. For example, the idea of Means±Ends method (Winston, 1992) was adapted to estimating the distances of current nodes to goal nodes.
M. Li, R.S. Yost / Agricultural Systems 65 (2000) 1±27
17
techniques (Plant and Stone, 1991). However, heuristically-informed search methods require goal information in order to evaluate search paths. So a relative goal state is applied in MOM to measure the relative distances between current nodes and goal nodes. For example, the relative goal state is set as the higher the better for pro®ts while nitrate leaching is always set as low as possible. 3.1.4. Strategic search using the hill-climbing method The strategic search in MOM is a search among groups of tactical nodes. In the example of Fig. 9, a strategic search step refers to a strategic node (a big circle marked with `A' or `B' or. . .) that contains nine tactical nodes. The strategic search
Fig. 9. A mixed search method with two heuristically informed searches is used in managementorientated modeling: hill-climbing as a strategic search method to ®nd gloabl optimals, best-®rst as a tactical search method to determine local optimals in a strategic search.
18
M. Li, R.S. Yost / Agricultural Systems 65 (2000) 1±27
is designed to ®nd global optimal solutions among the ®ve big nodes in this example. The search starts from the strategic node `A' that is a group of primary combinations produced by the generator, where pro®ts are not high nor are nitrate leaching estimates low. The tactical search procedure is called to sort this group of nine nodes to determine local optimal nodes, which in this case are the three solid nodes on the upper-left corner. These local optimal nodes indicate that the next strategic move should be in the direction of less nitrate leaching and higher pro®ts. We call it `path information' that points out whether to increase or decrease the rates of the fertilizer and irrigation (detailed discussion is in following paragraph). This information is passed to the generator to create new paths by extending the path of the upper-left corner to its neighbors, regardless of the neighbors of the terminal nodes in other directions. These new paths of the second strategic search move, nine nodes within the circle `B', have a shorter distance to the goals than other neighbors of the terminal nodes of the strategic node `A'. This hill-climbing search calls the tactical search procedure again and repeats the above processes until the global optimal solutions are found. In this example, the strategic search ends at the strategic node `E', where there is no clear `path information' that leads to a better solution than the current state. The solid nodes within the circle `E' are global optimal solutions that have relative high pro®ts and lower nitrate leaching potential than others for this example. Users can choose one of these solutions that is suitable to their particular situation to schedule the N management. Hill-climbing considerably improved the search eciency in this example by examining only 45 nodes among a total of 300 nodes. A scenario of the hill-climbing strategic search is shown in Fig. 10, in which the dataset of the summer corn (Yost and Li, 1999) is used with hypothetical economic data. In the scenario, there are ®ve strategic nodes and each strategic node contains 36 tactical nodes that will be discussed in the following paragraph. The strategic search paths in Fig. 10 illustrate that MOM would have improved management strategies, which would have increased pro®ts and reduced nitrate leaching. 3.1.5. Tactical search using the best-®rst method A tactical search in MOM is a search to ®nd local optimal choices among the nodes within a strategic search move. In the example of Fig. 9, a tactical search means ®nding the nodes whose states are closer to the goal states than others among nine nodes within a strategic node (e.g. in a circle `A' or `B', or others). The best-®rst search is applied as the tactical search method because the paths found by this method are likely to be shorter than those found with other methods (Winston, 1992). In the best-®rst search, MOM orders the tactical nodes by their states. The node which state is the closest to the goal state goes ®rst, the closer second, and the node whose state is far away from the goal is the last to be selected (how to measure a node's state will be discussed in Section 3.1.5.1). Then MOM examines the ®rst 3±5 nodes to determine the `path information' for the next strategic move by comparing the states of nodes. The `path information' in MOM consists of ®ve management factors: fertilizer rate, fertilizer frequency, irrigation rate, irrigation frequency, and fertilizer injection into the irrigation water. MOM analyzes the ®rst 3±5 nodes in the search queue by the following rules:
M. Li, R.S. Yost / Agricultural Systems 65 (2000) 1±27
19
Fig. 10. A scenario of the hill-climbing strategic searching in management-orietated modeling. The search leads to higher pro®ts, yields and less nitrate leaching. The dataset of the summer corn (Li and Yost, 1999b) is used in the scenario with hypothetical economic data.
20
M. Li, R.S. Yost / Agricultural Systems 65 (2000) 1±27
1. IF a level of one of the ®ve factors (e.g. a fertilizer rate) is shared by these nodes, THEN the next strategic search for this factor should move toward the direction that this level indicates 1.1. IF the shared level is at the end of the highest level, THEN the level of the factor should increase in the next strategic search. 1.2. IF the shared level is at the end of the lowest level, THEN the level of the factor should decrease in the next strategic search. 1.3. IF the shared level is in between both ends, THEN the level of the factor should not change in the next strategic search. 2. IF no levels of any factors are shared by these nodes, THEN a plateau state is reached. The automatic strategic search then pauses and waits for instructions from the user. If the ®rst three nodes (solid nodes) in the strategic node `B' share the highest level of the fertilizer rate, for example, the fertilizer rate will be increased in generating the next group of management combinations (the strategic node `C'). The plateau state found by the automatic strategic searching is often near the goal state even though it may be a local optimal state in some cases. If the nearly-optimal solutions satisfy the user's requirements, the solutions can be considered as global optimal solutions. However, the user can continue to search until a better state is found. An example of the best-®rst tactical search is illustrated in Fig. 11, in which 36 tactical nodes are contained in a strategic node that is shown in the scenario of Fig. 10. The arrows across the diagrams indicate the direction of the next strategic move: increase pro®ts and yields while decreasing nitrate leaching. The arrows also indicate the ordering of the nodes that are sorted by best-®rst search. The ®rst couple of paths in the search queue (whose distances to the goals are shorter than all others) appear in the upperleft corner in the diagrams. The last paths that are far away from the goals sit near the low-right corner in the diagrams. 3.1.5.1. Goal weighting and search direction. To sort current tactical nodes in the best®rst ordering, a measurement is needed to determine the distance from the current node's state to the goal node's state. The state of each node is represented by its three characteristics in MOM: pro®t, yield and leachate nitrate. The measurement of each single state characteristic can usually be estimated by the dierence between a current state and the goal state. But this distance cannot be measured in MOM because the goal state of MOM is not known until the search has ended, as discussed in the last section. Therefore, a relative distance, Di, is developed as a measurement to order the tactical nodes in MOM, though the absolute distance is unknown. For sub-goals of pro®ts and crop yields, the relative distance is de®ned as: Di;
profit yield
XGoal ÿ XMin =
Xi ÿ XMin ÿ 1:0
7
where, Di, pro®t yield represents a relative distance from the node i to the sub-goals of pro®ts or crop yield XGoal 5 Xi 5 XMin. XGoal refers to the goal state variable that can be a local goal or a global goal. XMin represents the state variable with minimum value among a group of tactical nodes in one strategic node. Xi is the state variable
M. Li, R.S. Yost / Agricultural Systems 65 (2000) 1±27
21
Fig. 11. A scenario of the best-®rst tactical searching within a strategic search. The dataset of the summer corn (Li and Yost, 1999b) is used in the scenario with hypothetical economic data.
22
M. Li, R.S. Yost / Agricultural Systems 65 (2000) 1±27
representing the current value of a state characteristic of the node i. Eq. (7) implies that the higher the state variable value Xi, the shorter the distance to the goal Di, pro®t yield and the node i is more desirable. In other words, the higher the pro®ts and/or yields, the closer to the goals. For example, when Xi=XMin, Di, pro®t yield !1. When Xi=XGoal, Di, pro®t yield=0, and the goal is attained. For the sub-goal of minimizing nitrate leaching, on other hand, the less the leaching, the shorter the distance to the goal. Its relative distance, Di, leaching, is calculated by: Di;
leaching
XMax ÿ XGoal =
XMax ÿ Xi ÿ 1:0
8
where, Di, leaching represents a relative distance from the node i to the leaching subgoal XGoal 4 Xi 4 XMax. XMax is the state variable with maximum value among a group of tactical nodes in one strategic node. It represents the maximum nitrate leaching rate at local conditions. XGoal is the goal state variable that can be a local goal or a global goal. The minimum goal is no nitrate leaching, XGoal=0. Xi has the same meanings as in Eq. (7). Eq. (8) means that the smaller the state variable value Xi, the shorter the distance to the sub-goal Di, leaching and the node i is more desirable. For example, when Xi=XMax, Di, leaching !1. When Xi XGoal ; Di;leaching 0, and the goal is attained. Another challenge of the MOM search is that three state characteristics (subgoals) must be considered simultaneously even though sometimes three sub-goals may con¯ict with each other. For this challenge, a linear-weighting method was developed to integrate three characteristics into one measurement, a relative weighted distance, Dwt, estimates the spatial dierence from a current node to the goal state. The relative weighted distance of node i, Dwt, i, is expressed as: Dwt;i
1 ÿ 1:0 Xp ÿ XMin Xy ÿ XMin XMax ÿ Xl Wy Wl
Wp XGoal ÿ XMin XGoal ÿ XMin XMax ÿ XGoal
9
where XGoal, XMax and XMin refer to the same meanings as those in Eqs. (7) and (8) respectively. Xp, Xy, and Xl represent current state variables of the pro®t, crop yield, and leachate nitrate, respectively, as Xi in Eqs. (7) and (8). Wp, Wy and Wl refer to the weights of the pro®t, yield, and nitrate leaching in estimating the distances to the goal. The values of weights depend on users' objectives and are uni®ed by: Wp Wp =
Wp Wy Wl
10a
Wy Wy =
Wp Wy Wl
10b
Wl Wl =
Wp Wy Wl
10c
M. Li, R.S. Yost / Agricultural Systems 65 (2000) 1±27
23
Finally the relative weighted distance, Dwt, can be used to estimate the shortest path directing to the next strategic search. Using the best-®rst search procedure, MOM sorts out tactical nodes within a strategic search step into a queue in ascending order by their Dwt values. The usage of this queue for the tactical search was discussed in the last section. The goal weights are used to direct the searching. If the weights of three goals are changed, the relative weighted distances, Dwt, are changed. And the order of tactical nodes in a search queue is changed. Finally the direction of the next strategic move is changed. So goal weighting is an important tool for users to guide MOM's search. An example of diering goal weights in the scenario (used in the last section) illustrates that the goal weighting changes the ®rst ®ve tactical nodes in a search queue and also changes the ®nal choice of optimal solutions (Table 2). With Goal weight-1 in Table 2, the ®rst solution choice is Node 35 with pro®t $880 and no nitrate leaching, in which the management combinations consist of 154 kg N haÿ1 N fertilizer applied in 2 weeks and 229 mm irrigation in 14 weeks during the cropping season. However, if the search is controlled by Goal weight-2 which weights pro®t higher than nitrate leaching, the ®rst ®ve nodes in the queue and their orders are changed. The ®rst solution choice is changed to Node No. 34 with pro®t $935 and 6.8 kg N haÿ1 nitrate leaching, which management combination consists of 154 kg N haÿ1 N fertilizer applied in 2 weeks, and 274 mm irrigation in 14 weeks during the cropping season. 3.1.5.2. Interactively guided searches. MOM is designed as a decision-aid to assist users in ®nding a solution that meets their goals, not a tool that make decisions for users. As discussed earlier, MOM's `intelligence' consists of limited equations and rules. It will lose its way if problems are not covered by the equations and rules. For example, the hill-climbing method has some problems in searching such as ``foothills, plateaus, and ridges'' that are hard to ``climb'' (Winston, 1992). To avoid making mistakes, the MOM search style is designed to accept user interaction. It implements the strategic search under the user's guidance plus an automatic search procedure that works well in most situations. However, if the search reaches a plateau, the user must determine how to change the management combinations (manually adjust management factors: fertilizer rate, frequency, irrigation rate, frequency, fertilizer in irrigation) for the next strategic search move, or declare that the goals are reached. The goal weights that represent the users' objectives can be used to control either the global search or the tactical search. To assist user analysis of the search processes, MOM provides users with on-line state space diagrams (Fig. 12) as graphic tools that examine the search. Users can determine the current relative weighted distances of any nodes to the goal immediately, by using the mouse to circle the nodes on the state-space diagrams (Fig. 12). A user with N management knowledge can adjust the management factors manually between strategic search moves. In addition to guiding the search, users must make the ®nal decision in choosing optimal solutions from the ®nal solution list. This is because an optimal solution may not necessarily ®t a user's particular situation. Therefore, the MOM interface is
24
M. Li, R.S. Yost / Agricultural Systems 65 (2000) 1±27
Fig. 12. Examples of the state space diagrams for on-line search analyses. The relative weighted distances from current nodes to the goal Dwt, are displayed if they are selected by the mouse.
M. Li, R.S. Yost / Agricultural Systems 65 (2000) 1±27
25
designed to facilitate the search sequence as well as to list alternative solutions for users' choices. 3.1.6. MOM execution As a summary of the MOM implementation, a MOM session is brie¯y described below. 1. Detect the shortages of soil N and water for a cropping season. This results in a primary management combination (an N fertilizer and irrigation schedule) that is close to matching crop requirements. 2. Start a strategic search. 2.1. Assemble a group of new tactical search nodes using the generator. The tactical nodes consist of the combinations of management factors: N fertilizer rate and timing, irrigation rate and timing, and fertilization with irrigation systems. The adjustment of these factors will bracket the primary management combinations at the ®rst strategic search. 2.2. Predict the states of current tactical nodes using the simulator. The node's state in MOM consists of three characteristics: the pro®t, yield, and the amount of leached nitrate. The characteristics of the goal state are also called sub-goals. 2.3. Assess the states of current tactical nodes using the evaluator. (1) Adjust the weights of three sub-goals. (2) Estimate the relative weighted distances between current nodes and the goal. (3) Search tactical nodes to ®nd the shortest path toward the goal. 3. Determine if a plateau has been reached. 3.1. If a plateau is not reached, the path information resulting from the tactical search is transferred to the generator to create a new group of tactical nodes by extending the desired neighbors of the terminal nodes. Then repeat step 2. 3.2. If a plateau is attained, users must judge whether the plateau is a local or global optimal situation3. 3.2.1. If the plateau is a local optimal, change the management combinations manually and repeat step 2. 3.2.2. If the plateau is the global optimal, the goals are reached and the search succeeds. Select suitable solutions from the solution list for displaying results. 4. Graphically demonstrate the predicted eects of selected management combination on the soil-plant system, during the search or at the end of the search. 4. Conclusions MOM illustrates the use of AI searches to assist in narrowing intractable problems in natural resource management and in designing environmentally sensitive 3
It is an optimal situation among situations produced by all management choices in a global search.
26
M. Li, R.S. Yost / Agricultural Systems 65 (2000) 1±27
nutrient management plans. Heuristic searches permitted reducing the number of simulations from roughly 1019 to a few thousand. With algorithms adapted from existing models such simulations can be performed in seconds on desktop PCs. Iterative search techniques that permit the user to examine results and re-start the simulation permit user guidance of the search process. In test simulations substantial reduction in nitrate leaching, fertilizer application rate, and increased production were illustrated. The results illustrate that irrigation management and nitrogen fertilization are inextricably linked when considering possible leaching to groundwater and plant utilization. Although the initial results with available simulation data are promising, further ®eld testing of the software and approach is needed. It is curious and perhaps indicative that there are so few datasets with both detailed N measurements and detailed water budget components. Acknowledgements Federal Government Hatch Project F93-272-F-531-8-145, which has fully supported this study, is acknowledged. The authors thank support from Drs. Goro Uehara (Department of Tropical Plant and Soil Science, Carl I. Evensen (Department of Natural Resources and Evironmental Management), Richard E. Green (formerly of the Department of Agronomy and Soil Science, University of Hawaii), and Stephen Y. Itoga (Department of Information and Computer Science, University of Hawaii). References Anderson, D.R., Sweeney, D.J., Williams, T.A., 1994. An introduction to management science: Quantitative approaches to decision making, West Publishing Company, St. Paul, MN. Li, M., Yost, R.S., 1999a. Nitrogen-simulator predicting nitrate leaching in root zones: I. Model description. Submitted for publication. Li, M., Yost, R.S. 1999b. Management-oriented model guided within-season nitrogen management. In: Robert, P.C., Rust, R.H., Larson, W.E. (Eds.), Proceedings of the Fourth International Symposium on Precision-Agriculture. pp. 1871±1881. Li, Z.-C., Widjaja-adhi, I.P.G., Dierolf, T.S., Yost, R.S., 1995. Liming material selection by computer spreadsheet based on lime and soil characteristics and transportation costs. Journal of Natural Resources and Life Sciences Education 25, 26±30. Plant, R.E., Stone, N.D., 1991. Knowledge-based systems in agriculture, McGraw-Hill, New York. Schaub, L.P., Stone, N.D., 1989. Embedding an expert system into a stochastic simulation model for the analysis of control strategies for Heliothis in Texas. Proceedings of the Beltwide Cotton production and Research Conferences. National Cotton Council of America, Memphis, TN, pp. 220±222. Winston, P.H., 1992. Arti®cial intelligence, Addison-Wesley Publishing Company, Reading, MA. Yakowitz, S., 1982. Dynamic programming applications in water resources. Water Resources Research 18, 673±696. Yost, R.S., Li., M., 1997. Evaluation of software for managing nitrogen in agricultural systems. Cooperative Extension Service, Oct. 1997. College of Tropical Agriculture and Human Resources, University of Hawaii, http://agrss.sherman.hawaii.edu/decision_aids/MOM.html.
M. Li, R.S. Yost / Agricultural Systems 65 (2000) 1±27
27
Yost, R.S., Li, M., 1999. Nitrogen-simulator predicting nitrate leaching in root zones: II. Applications. Manuscript in review. Yost, R.S., Li, M., Yang., H., 1997a. Nitrogen Balance for Windows: A computerized static model for estimating N budgets in soil-crop systems: I. Model Description. College of Tropical Agriculture & Human Resources, University of Hawaii, http://agrss.sherman.hawaii.edu/decision_aids/N_Balance/ PAPER-1/NB_PAPE1.htm. Yost, R.S., Li, M., and McLean., M., 1997b. Nitrogen balance for windows: a computerized static model for estimating N budgets in soil-crop systems: II. Applications. Manuscript in preparation.