Revista Brasileira de Cartografia (2016), Nº 68/9, Edição Especial Movimentos de Massa e Processos Erosivos: 1677-1688 Sociedade Brasileira de Cartografia, Geodésia, Fotogrametria e Sensoriamento Remoto ISSN: 1808-0936
MAPPING SOIL EROSION VULNERABILITY USING REMOTE SENSING AND GIS: A CASE STUDY OF MAMUABA WATERSHED, PARAÍBA STATE Mapeamento da Vulnerabilidade à Erosão do Solo por Meio de Sensoriamento Remoto e SIG: O Estudo de Caso da Bacia Mamuaba, Estado da Paraíba Ana Paula Campos Xavier¹,Richarde Marques da Silva² Alexandro Medeiros Silva² & Celso Augusto Guimarães Santos³ Universidade Federal da Paraíba – UFPB
1
Programa de Pós-Graduação em Engenharia Civil e Ambiental – Centro de Tecnologia Cidade Universitária, João Pessoa, PB, CEP, 58059-900, Brasil
[email protected]
Universidade Federal da Paraíba – UFPB
2
Departamento de Geociências – Centro de Ciências Exatas e da Natureza Cidade Universitária, João Pessoa, PB, CEP: 58059-900, Brasil
[email protected],
[email protected]
Universidade Federal da Paraíba – UFPB
3
Departamento de Engenharia Civil e Ambiental – Centro de Tecnologia Cidade Universitária, João Pessoa, PB, CEP: 58059-900, Brasil
[email protected] Received on October 06, 2014/ Accepted on May 1, 2015 Recebido em 06 de Outubro, 2014/ Aceito em 1 de Maio, 2015
ABSTRACT Soil erosion is one of the most significant environmental degradation processes. Mapping and assessment of soil erosion vulnerability is an important tool for planning and management of the natural resources. The objective of the present study was to apply the Universal Soil Loss Equation (USLE) using GIS tools to the Mamuaba watershed, southern Paraíba, for measuring soil erosion vulnerability. An annual rainfall erosivity map was derived from the geographical model adjusted for northeastern Brazil, calculating an annual value for each pixel. The factors of soil erodibility (K), the topography (LS), and land use and management (C) were obtained in a GIS environment from soil type maps, orbital images, and digital elevation model (DEM). The maps of the factors were combined to create the soil erosion vulnerability due to the water erosion. The results showed that, in general, the soils of the Mamuaba watershed present 84% of the area with values between 0 and 1 t ha-1 yr-1, which could be classified as “Slight to Moderate” vulnerability in 1989, and 77% of the area in 2013. In the upper region of Mamuaba watershed, the predominant classes were “Slight to Moderate” and “Moderate”. High values of soil losses were predominant in regions of Red-Yellow Acrisol covered by pasture. Furthermore, the integration of USLE/GIS showed to be an efficient tool for the erosion prediction in this important basin of the Paraíba State. Keywords: Modeling, Geoprocessing, Land Use, Erosion.
Xavier A. P. C. et al.
RESUMO A erosão do solo é um dos processos de degradação ambiental mais significativos. O mapeamento e avaliação da vulnerabilidade do solo à erosão é uma importante ferramenta para o planejamento e gestão dos recursos naturais. O presente trabalho teve como objetivo a aplicação da Equação Universal de Perda de Solo (EUPS) com utilização de um SIG, na bacia do Rio Verde, sul de Paraíba, a fim de avaliar a vulnerabilidade dos solos à erosão hídrica. O mapa do fator erosividade da chuva (R) foi desenvolvido a partir de um modelo geográfico desenvolvido para o Nordeste do Brasil, sendo obtido em nível de pixel. Os fatores de erodibilidade dos solos (K), topográfico (LS) e de uso e manejo (C) foram obtidos mediante mapas de tipos de solos, imagens orbitais e pelo modelo digital de elevação (MDE) em ambiente SIG. Os mapas dos fatores foram combinados por meio de álgebra de mapas, originando o mapa de vulnerabilidade dos solos à erosão hídrica. Os resultados mostraram que, em geral, os solos da bacia Mamuaba apresentam 84% da área com valores entre 0 e 1 t ha-1 yr-1, os quais podem ser classificados como vulnerabilidade “Leve a Moderado” para 1989, e 77% da área em 2013. Nas regiões de cabeceira, as classes predominantes foram “Leve a Moderado” e “Moderado”. Valores elevados de perda de solo foram predominantes em regiões com solos do tipo Argissolo Vermelho-Amarelo cobertos por pastagens. Além disso, a integração EUPS/SIG apresentou-se uma ferramenta eficiente para a predição da erosão nesta importante bacia hidrográfica do estado de Paraíba. Palavras chaves: Modelagem, Geoprocessamento, Uso do Solo, Erosão.
1. INTRODUCTION Widespread human influences like deforestation and urbanization, during the last decades, have strongly influenced erosion and sedimentation patterns in river watersheds in northeastern Brazil. One of the most direct effects of human-induced environmental changes on the landscape has been the generation of sediments through erosional processes and the subsequent transportation and deposition in watersheds (SILVA et al. , 2012). Therefore, this paper intends to evaluate and identify critical sub-watersheds within a Brazilian watershed for soil conservation management using the Universal Soil Loss Equation (USLE) with remote sensing and GIS techniques. Water erosion caused by inappropriate land use compromises the ecosystems and causes economic and social losses. Water erosion is a primary cause of environmental degradation that can affect both soil and water. A wide range of damaging effects involve not only the farming aspects (profitable crop production), but also the concerns of society related to environmental degradation (e.g. impacts on fresh water resources) and food security (degradation of the non-renewable natural resource soil, essential for crop production). Soil erosion is the main environmental impact that affects the Paraíba State, with degradation and impoverishment of soils and reduction of surface water quality in basins. A quick and quite accurate method to qualitatively 1678
assess the erosive potential in a particular region is provided by application of predictive soil loss models, which consider the assets and liabilities of erosion factors. The Universal Soil Loss Equation - USLE (WISCHMEIER & SMITH, 1978) is considered a simple equation for predicting soil erosion, in which the average annual long term soil losses is estimated with acceptable accuracy (BESKOW et al., 2009). In this regard, the topographic parameter gains a more grounded scientific connotation, physically improving the model (ZHANG et al. , 2013). The assessment of the vulnerability of soils to erosion on a large scale, like in watersheds, can be carried out with the USLE as its topographic factor was reformulated, improving the representativeness of it in watershed’s scale (PRASANNAKUMAR et al. , 2012; ZHANG et al. , 2013). However, it requires the use of tools able to collect, store, manipulate and display spatial data (BRAGA et al. , 2013). Therefore, a Geographical Information System (GIS) has been used, especially by applying the technique of map algorithms (OZCAN et al. , 2008; SILVA et al. , 2013). This technique has produced good results with the application of USLE, developing maps with the average spatial distribution of soil losses and its subsequent interpretation in the context of natural vulnerability. The USLE applications in the grid environment with GIS and Remote Sensing would allow us to analyze soil erosion in much more detail. It is more reasonable to
Revista Brasileira de Cartografia, Rio de Janeiro, No 68/9, p. 1677-1688, Out/2016
Mapping Soil Erosion Vulnerability Using Remote Sensing and GIS use the USLE on physical basis than to apply it to an entire watershed as a lumped model. Although, GIS permits more effective and accurate application of the USLE for small watershed, most GIS-model applications are subject to data limitations (MUJABAR & CHANDRASEKAR, 2013; PAN & WEN, 2014). Several researchers have adopted these techniques depending upon the purpose and the available information. Recent studies revealed that Remote Sensing and GIS techniques are of great use in characterization and prioritization of watershed areas and estimation of sediment transport (WASIGE et al. , 2013; KABA et al. , 2014). Thus, the objective of this paper is to evaluate and identify critical sub-watersheds for soil conservation management using the USLE
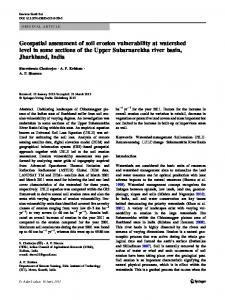
in the Mamuaba watershed, located in the state of Paraíba, northeastern Brazil, through the use of remote sensing and GIS techniques. 2. MATERIALS AND METHODS The Mamuaba watershed is located in Northeastern Brazil and Coastal Mesoregion of Paraíba State, between the latitudes of 7º15′0′′ and 7º21′0′′ S, and 35º03′0′′ and 35º7′30′′ W, with a drainage area of km² (FIGURE 1). The climate is classified as Aw’ with mean annual evaporation of 1,300 mm yr-1. These climate types present two seasons well characterized by mild and rainy summer and cool and dry winter, with annual amount of rain ranging from 1,100 to 1,500 mm, with the rainy season between May and July.
Fig. 1 – Geographical location of Mamuaba watershed in Paraíba State and Brazil. The Mamuaba watershed has high hills, deep valleys, large plateaus and gullies are not present. The major land covers in the watershed are sugarcane and cropland. Sugarcane is the main activity of the people in the area. The climate is tropical, hot, and humid. The maximum daily rainfall in the area is 175 mm. The annual average temperature is 27°C, with a daily temperature range of 25-32°C (SILVA et al. , 2013). The main sediment storage components in the watershed are the floodplain, alluvial fans and colluvium on lower slopes and tributary
valleys, whereas the main sediment sources are the various hillslope erosion processes (inter-rill, rill and gully erosion). 2.1 The Universal Soil Loss Equation – USLE The Universal Soil Loss Equation – USLE was used to determine the average annual soil loss and its spatial distribution within the watershed. The USLE predicts soil loss for a given site as a product of six major erosion factors (Eq. 1), whose values at a particular location can be numerically expressed. The values of these erosion factors vary considerably
Revista Brasileira de Cartografia, Rio de Janeiro, No 68/9, p. 1677-1688, Out/2016
1679
Xavier A. P. C. et al. from their mean values from event to event. The USLE can be expressed as follows: A = R∙K∙LS∙C∙P
(1)
where A is the average annual soil loss per unit of area (t ha-¹ yr-¹), R is the rainfall erosivity factor (MJ mm-¹ ha-¹ h-¹ yr-¹), K is the soil erodibility factor (t h MJ-¹ mm-¹), LS is the topographic factor (dimensionless), which includes slope length factor (dimensionless) and slope steepness factor (dimensionless), C is the cover management factor (dimensionless), and P is the support practice factor (dimensionless). 2.2 Soil Erodibility Factor (K) The soil erodibility (K) is intrinsic susceptibility of the soil to erosion, which is a function of its physical, chemical and pedologic characteristics, such as percentage of silt and sand, structure, permeability, organic matter, parental material and others (PRADHAN et al., 2012). The K values applied in this study were extracted from the literature as this factor has been well studied and documented for region. Then a generalized soil texture map obtained from the soil survey organization, Mamuaba, was used for the preparation of K factor map and the soil types are grouped into four major textural classes, viz., gravelly loam, gravelly clay, clay loam and loam. Erosivity is the potential of rainfall to cause erosion in a given soil with no protection. The R factor takes into account both the total precipitation and kinetic energy of raindrops that fall onto the soil, and is affected by rainfall intensity and raindrop size. Monthly rainfall data from six rain gauges (TABLE 1) were used, and the monthly rainfall erosivity of each station was computed for all the studied years. The rainfall erosivity factor (R) was calculated based on Leprun (1981) as: (2)
where Rx is rainfall erosivity factor (MJ mm ha-¹ h-¹ yr ¹), and Mx is annual mean rainfall (mm).
1680
Soil distribution in the watershed and the K factor values are shown in Table 2. The determination of the soil erodibility factor was based on soil texture using soil map of Mamuaba watershed (XAVIER et al. 2014). Table 2: Area, percentage and soil erodibility values and references Soil Types Spodosol Red-Yellow Acrisol Yellow Acrisol Red Latosol Fonte:
2.3 Rainfall erosivity factor (R)
Rx = 0.13 × (Mx1.24)
Table 1: Location of rain gauges and periods of rainfall data Rain Latitude Longitude Period gauges (m) (m) of Data Acaú 9192520 262630 Fazenda Santa 9183317 266355 Emília Imbiribeira 9196257 273659 Jangada 9188865 270011 Fazenda 9194388 268144 Mamuaba Riacho 9190734 275524 Salto
(1)
Erodibility Area (t ha h ha-1 MJ-1 (%) (km²) mm-1) 0.030 (1) 21.00 34.25 0.024 (1)
35.00 57.08
0.035 (2)
0.83
1.35
0.014 (2)
4.49
7.32
Mendonça et al. (2006) e (2)Farinasso et al. (2006).
2.4 Topographic factor (LS) The LS factor is used in the USLE to consider the effect of topography on erosion. The topographic factor depends on the slope steepness and slope length factor (LS) and it is an essential parameter to quantify the erosion generated due to the influence on surface runoff speed. There are different approaches in the literature for determining the LS factor in a grid-based Digital Elevation Model – DEM. In this study, a DEM of Mamuaba watershed was obtained with 30 m of resolution and was used to generate the slope length and slope steepness factor for each grid cell on the map. This technique for estimating the LS factor was proposed by Moore & Burch (1986), and also used by Zhang et al. (2009):
Revista Brasileira de Cartografia, Rio de Janeiro, No 68/9, p. 1677-1688, Out/2016
Mapping Soil Erosion Vulnerability Using Remote Sensing and GIS LS
[V].[Cell Size] 22.13
0.4
[sin(Q)] 0.0896
1.3
(3)
in which V is flow accumulation, and Q is the slope in degrees. The accumulated flow and slope map were obtained from the digital elevation model (DEM) with a resolution of 30 m using Aster-GDEM images (TACHIKAWA et al., 2011) available at: http://gdem.ersdac.jspacesystems.or.jp. 2.5 Cover-management (C) and support practice (P) factors We analyzed land-cover change using two Landsat-5 TM scenes (Path/Row 168/62 of December, 1984) and Landsat-8 OLI (February, 2000) acquired from the United States Geological Surveys (USGS). The following considerations dictated the choice of the images. First we searched for images matching the timing of the major policy changes and/or events related to land-use changes in the study area over the preceding 20 years. Secondly, the images should reflect similar vegetation conditions. We selected images without cloud cover (primarily winter images). Two images of TM and OLI sensors were selected for land cover classification. We converted the image DN values to radiance following Chander et al. (2009) and Santana et al. (2014). We added shade classes to the classification, and then merged some of them with the neighboring sunlit categories that we had obtained after image classification. After, we clipped the study area from the mosaic of images and cloud masked pairs of imagery in Spring 5.2.6 and next performed two unsupervised classifications, with four classes for each of the selected years. The C and P factors are related to landuse and are reduction factors to soil erosion vulnerability. These factors represent the ratio of soil loss from a given vegetal cover, support practice, soil type, and slope. These are important factors in the USLE, since they represent conditions that can be easily changed in order to reduce erosion. Therefore, it is very important to have good knowledge concerning land-use in the watershed, to generate reliable C and P factor values. The values of C factor used in this study were obtained from the literature (TABLE 3) as well.
Table 3: Area, percentage and c factor values and references Land Uses
C Factor
Rainforest
0.0004
Sugarcane
0.0180
Bare land
1.0000
Grassland
0.0015
Reference Silva et al. (2003) Silva et al. (2012) Silva et al. (2010) Silva et al. (2012)
The C factor was generated for two years (1989 and 2013) using a digital land cover map, originally divided into four land cover categories: sugarcane, grassland, rainforest and bare soil. The C values were assigned according to the land cover category obtained from Da Silva et al. (2007) and the C values for each landuse observed in the Mamuaba watershed. Due to lack of information and maps about conservation practices in the study area, P factor values are assumed as 1 for the watershed. 2.6 Soil erosion vulnerability for Mamuaba watershed The USLE was applied for the identification and prioritization of the vulnerability in the Mamuaba watershed. Simulations were performed using rainfall data in the analyzed years (1989 and 2013) for identifying and prioritizing the critical areas on the basis of average annual soil loss. Table 4 shows the six soil erosion vulnerability classes. According to this classification, an erosion risk map, based on the distribution of soil loss over the Mamuaba watershed, was prepared. The ranges of the erosion rates and their suggested classes were inferred for identification of the critical sub-watersheds. The critical areas were then prioritized related to management scenarios for reducing sediment yield. A particular area may get top priority due to various reasons, but often the intensity of land degradation is used as the basis. This approach of prioritizing watersheds based on actual sediment yield rates is possible only when the number of watersheds to be prioritized is low and the necessary data are available. Furthermore, this method is helpful when the
Revista Brasileira de Cartografia, Rio de Janeiro, No 68/9, p. 1677-1688, Out/2016
1681
Xavier A. P. C. et al. soil loss potentials of different areas do not have great variations. Table 4: Soil loss, vulnerability to soil erosion and critical classes Soil loss Erosion risk Critical (t ha-1 yr-1) classes classes Slight to 200 Extremely High I
due the climatic unevenness in which extreme events occur and rainy in this region. This behavior indicates that the orographic effect has a fundamental importance in the rainfall erosivity pattern. This assessment was possible due to the methodology adopted in this study which applied a geographical regression model for R estimates, avoiding the use a unique average value to represent the entire the basin.
After completing data input procedure and preparation of K, LS and C maps as data layers, they were multiplied in the GIS to provide erosion risk map which shows spatial distribution of soil loss in the study area. Average soil loss was calculated as the product of each pixel value multiplied by pixel area (25 ha) then divided by total pixel area of the basin using ArcGIS 10.1 table calculation option. 3. RESULTS AND DISCUSSION The intent of the USLE is to define long term erosion risk and not only to quantify eventdriven risk. For the development of this study discussed above, estimated erosion values in GIS environment were applied using USLE. 3.1 Soil erosion prediction using USLE Mamuaba watershed
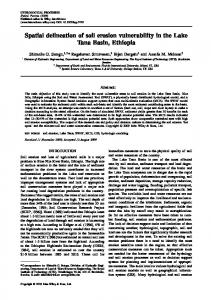
Fig. 2 − Map of erosivity factor in the Mamuaba watershed.
Figure 2 presents the mean annual rainfall erosivity map (R factor) in the Mamuaba watershed, which had values ranging from 895.17 to 1,205.68 MJ mm ha-1 h-1 yr-1. Values greater than 1,000 MJ mm ha-1 h-1 yr-1 can be observed in the eastern region of Mamuaba watershed, specifically in the coastal northeastern region. These values are close to those obtained by Da Silva (2004), who calculated values around 1,000 MJ mm ha-1 h-1 yr-1 for the coastal northeastern region. These values indicate that, climatologically, the watershed had very high erosion potential. However, in spite of showing a high erosivity values, it has been long recognized that the climatic characteristics of these regions together with topographic, soil, and land use factors have escalated water erosion. The substantial sign of the potential risk in these coastal regions of northeastern Brazil is very high
The soil erodibility map (Figure 3) is a reflection of the prevailing pedological units in the Mamuaba watershed (Red-Yellow Acrisols), which covers almost 50% of the entire area. Soils with an incipient B horizon, such as Acrisols, are very susceptible to erosion because they present high content of silt, which may cause surface sealing of exposed soil, with a reduction water infiltration capacity, thus enabling the occurrence of surface runoff. Different soil types are naturally resistant and susceptible to more erosion than other soils and are function of grain size, drainage potential, structural integrity, organic content and cohesiveness. The properties that affect erosion resistance most directly all vary significantly over time. On many hillslopes, systematic spatial
1682
Revista Brasileira de Cartografia, Rio de Janeiro, No 68/9, p. 1677-1688, Out/2016
Mapping Soil Erosion Vulnerability Using Remote Sensing and GIS variations also occur caused by slope shape, aspect or microclimate. These can produce major differences in erosional response during rainstorms, as shown by Bryan (2000). The properties reflect many factors, and some variation is essentially random, with effects that cancel out over long time periods. This was recognized when the USLE’s K factor was defined as a long-term variable rather than an index of response in specific rainstorm events. However, some variations follow predictable trends or cycles and understanding of these is important both for physical event-based erosion models and long-term prediction of hillslope evolution. All the factors influencing these trends or cycles are not fully understood, but the most important appear to be frost action, soil water dynamics, microbial action and organic decomposition (LÓPEZ-MORENO et al. , 2010).
the watershed area and only 15% has LS values greater than 4.
Fig. 4 − Map of slope steepness and slope length factor for Mamuaba watershed.
Fig. 3 − K factor values and map of main soil types in the Mamuaba watershed. The spatial distribution of the LS factor (Figure 4) showed almost 90% of the basin present values less than 10, which represents a moderate vulnerability associated with the topography effect. In contrast, the remaining 10% represents areas with high potential for erosion, especially in headwater regions, as these areas present the greatest LS values. Areas with LS value between 0 and 3 cover 85% of
Spatial distribution of C factor was derived for the years of 1989 and 2013 and is shown in Figures 5a-b. It is found that C value in the study area varies from 0.00004 to 1. The C factor map is the land use classes (C values) and the values were allocated without considering the seasonal variance, generated by reclassification of each land-use/ land-cover type, using values given in Table 5. The watershed was composed of four land use types: sugarcane, rainforest, grassland, and bare soil. The highest C factor values booth images occurred in the hillside areas, due to the plantations presence in those areas. Owing to the larger plantations area located in the hillside edge of the valley, higher C factor values occur in that area as well. Table 5 and Figures 5a-b reveals that around 1989 and 2013. The land cover was dominated by Rainforest in 1989 and sugarcane in 2013. Almost 24% of the total land area was under Rainforest in 2013, up from less than 49% in 1989. However, sugarcane expansion from 1989 to 2013 was not spatially uniform and increased 2 times in the basin. Therefore, the expansion in sugarcane between 1989 and
Revista Brasileira de Cartografia, Rio de Janeiro, No 68/9, p. 1677-1688, Out/2016
1683
Xavier A. P. C. et al. 2013 was significant for the entire study area. The results presented in Table 6 refer to the variation of soil losses for each soil erosion vulnerability class and to each pedological unit. High soil losses values can be explained due to the combination of Yellow Acrisol covered by extensive sugarcane plantations. Soil erosion losses in Yellow Acrisol and Red-Yellow Acrisols accounted for 92.5% of total losses. Soil losses in Red Latosol accounted for 1.2% of total losses. Areas with presence of Spodosol accounted for 5.7% of soil losses. Even covering a significantly larger than the area of Yellow Acrisol, Red Latosol had a lower soil loss rate, demonstrating the importance of the intrinsic soil attributes related to erosion susceptibility regarding the natural protection of soils facing the effects of erosive agents. In addition, most of the soil losses in Red Latosol occurred between “Moderate”
and “Slight to Moderate” vulnerability classes of the total soil losses. This behavior can be explained due to the combination of agriculture and Red Latosol, especially in the lower region of the Mamuaba watershed, since the agriculture practices has high C and P values and the Red Latosol has a high erodibility. 3.2 Soil erosion change detection over 1989-2013 The distribution of soil loss per unit over the 24 years between 1989 and 2013 is shown in Table 6 and Figures 6a-b. Average soil losses of 1.37 t ha-1 yr-1 in 1989 and 1.39 t ha-1 yr-1 in 2013 show an increase of 0.02 t ha-1 yr-1. Among the four soil types, the largest increase was in the Red Latsol with 0.11 t ha-1 yr-1. The Yellow Acrisol showed a decrease of 0.16 t ha-1 yr-1. Soil loss generally increased in across watershed, with some exceptions, over the last 24 years.
Table 5: Land use change for Mamuaba watershed between 1989 and 2013 1989 2013 Classes Area (km²) % Area (km²) % Rainforest 30.22 48.90 14.69 23.77 Sugarcane 24.41 39.50 37.40 60.52 Bare land 1.74 2.82 1.96 3.17 Grassland 5.43 8.79 7.75 12.54
Range (%) -51.39 53.22 12.64 42.73
Fig. 5 − Map of main land uses map in the Mamuaba watershed for: (a) 1989 and (b) 2013.
1684
Revista Brasileira de Cartografia, Rio de Janeiro, No 68/9, p. 1677-1688, Out/2016
Mapping Soil Erosion Vulnerability Using Remote Sensing and GIS Table 6: relationship between soil erosion vulnerability and soil types Vulnerability in 1989 (t ha-1yr-1) Vulnerability in 2013 (t ha-1yr-1) Critica Critica Average Soil Average Soil Soil Types Erosion risk l Erosion risk l -1 Loss (t ha Loss (t ha yr classes Classe classes Classe 1 -1 1 yr ) ) s s Slight to Slight to Yellow Acrisol 0.73 VI 0.57 VI Moderate Moderate Slight to Slight to Red Latosol 0.16 VI 0.27 VI Moderate Moderate Slight to Slight to Spodosol 0.23 VI 0.24 VI Moderate Moderate Slight to Slight to Red-Yellow Acrisol 2.22 VI 2.23 VI Moderate Moderate
Fig. 6 − Spatial distribution of soil loss for Mamuaba watershed: (a) 1989 and (b) 2013. Table 7: Soil loss by classes for Mamuaba watershed between 1989 and 2013 Classes 0 1 1 2 2 5 5 10 10 15 15 30 > 30
1989 Area (km²) 51.94 4.29 3.42 0.71 0.40 0.40 0.83
% 83.77 6.93 5.52 1.15 0.64 0.65 1.34
The soil is the foundation for vegetation growth and various ecosystems, as well as a key factor in maintaining healthy forests and water circulation (PARK et al. , 2011). In particular, surface soil is an important resource, and regions with a high potential for soil erosion face problems of decreased crop productivity and water storage capacity, which, directly and indirectly, cause water pollution. As concerns about the environment grow, the importance of soil loss is being increasingly recognized and research on methods to preserve soil is actively underway.
2013 Area (km²) 47.49 6.75 5.18 1.00 0.41 0.45 0.73
% 76.59 10.89 8.35 1.61 0.67 0.72 1.17
Range (%) -8.57 57.20 51.13 40.39 4.67 11.37 -12.97
Information on soil loss and erosion prevention can serve as primary data for minimizing environmental impacts and developing policies and plans based on predicted soil loss. In Table 7, we can see that approximately 84% of the Mamuaba watershed area showed values between 0 and 1 t ha-¹ yr-¹, which could be classified as “Slight to Moderate” vulnerability in 1989, and 77% of the area showed values between 0 and 1 t ha-1 yr-1 in 2013, i.e., a small reduction, motivated by the increase in larger classes of soil loss. This result can be explained
Revista Brasileira de Cartografia, Rio de Janeiro, No 68/9, p. 1677-1688, Out/2016
1685
Xavier A. P. C. et al. on the basis of the low values for LS and CP factors, especially in the lower regions of the basin near to the drainage network. However, 1.8% of the basin showed soil losses between 5 and 15 t ha-1 yr-1, characterizing these regions of Mamuaba watershed as “Moderate” vulnerability in 1989, and 2.3% of the basin showed soil losses between 5 and 15 t ha-1 yr-1, which shows an increasing soil loss in 2013. The largest increase occurred in the class 10-50 t ha-1 yr-1 (52.25%) The spatial distribution of the soil erosion vulnerability in Mamuaba watershed allows a qualitative classification of soil erosion vulnerability into classes ranging from “Slight to Moderate” to “Moderate”. The interaction of the previously described factors with the type of vegetation is critical to understand the spatial distribution of soils erosion vulnerability in the basin. It’s important to notice that in high altitudes and protected forested areas, the soils vulnerability is low, giving evidence to the importance of vegetation cover for soil protection facing the effects of the active erosion agent (rainfall). This feature can be verified in areas near the drainage, in which the extent of soil loss was considerably lower compared to less steep and lower altitude areas. On the other hand, areas where there is a predominance of sugarcane and bare soil had greater vulnerability, however, in lower part of the basin, values of soil loss are reduced due to the presence of rainforest, which have lower erodibility and therefore less soil erosion vulnerability. The soil loss was higher with Bare land than other covers which could be related with the lack of soil protection, which allows the greater ability to disaggregate soil. The lowest losses occurred in the Rainforest cover, which reduced soil losses in relation to the areas of Bare land and Grassland, functioning as a barrier to free flow, allowing the runoff to remain longer over the ground. Rainforest reduces the kinetic energy of raindrops and the hydrodynamic power of flowing water, protects the ground’s surface from the impact of raindrops, controls the rate of infiltration and reduces surface runoff. The reduction of soil loss in watershed also can be attributed to factors such as the vegetation leaf distribution and due to also soil properties. The 1686
effects of different covers types on sediment generation can be related to: (a) soil organisms that have lived and died in the soils, and (b) the amount of organic matter, which reflects the percentage of plant residues. Current analysis provided a good response with regard to survey and data crossing in GIS environment. However, the factors discussed may be a help in a better exploitation of cultivatable areas and improve the use of more erosion-vulnerable areas to avoid significant erosion-caused loss of soil. 4. CONCLUSIONS In this study, we have shown a rapid conversion of rainforest to sugarcane in the dispersal areas of Mamuaba watershed. The remote sensing data revealed that the area under rainforest decreased from 30 to 15 km². This increase in cultivated land was due to large-scale farming for higher alcohol production. The use of the USLE model integrated to GIS by means map algorithms showed to be an effective tool for assessing the soil erosion vulnerability in a watershed’s scale. The results also showed that, in general, the soils of the Mamuaba watershed have low soil erosion vulnerability, with 77% of the soil losses classified as “Slight to Moderate” class for 2013. In the headwater regions, the predominant classes were “Moderate” and “Moderate to High”. High soil loss values were predominant in areas with Red-Yellow Acrisol covered by extensive pastures. These findings also indicate the need for implementation of conservation practices and soil management to reduce the soil erosion vulnerability in these areas. ACKNOWLEDGMENTS The first and second authors would like to thank the Conselho Nacional de Desenvolvimento Científico e Tecnológico (CNPq) for the scholarship awarded and by the financial support to the project titled “Impactos das mudanças climáticas e a influência da ocupação do solo nos processos hidrossedimentológicos no Estuário do Rio Paraíba” (Proc. 483484/2012-1). The authors are also grateful to the Coordenação de Aperfeiçoamento de Pessoal de Nível Superior (Capes) for the scholarships granted to the third and fourth authors.
Revista Brasileira de Cartografia, Rio de Janeiro, No 68/9, p. 1677-1688, Out/2016
Mapping Soil Erosion Vulnerability Using Remote Sensing and GIS REFERENCES BESKOW, S.; MELLO, C. R.; NORTON, L. D.; CURI, N.; VIOLA, M. R.; AVANZI, J. C. 2009. Soil erosion prediction in the Grande River Basin, Brazil using distributed modelling. Catena, v. 79, n. 1, p. 49-59.
LÓPEZ-MORENO, J. I.; ALVERA, B.; MARTÍ-BONO, C.; ALATORRE, L. C. 2010. From plot to regional scales: interactions of slope and catchment hydrological and geomorphic processes in the Spanish Pyrenees. Geomorphology, v. 120, n. 2, p. 248-257.
BRAGA, A. C. F. M.; SILVA, R. M.; SANTOS, C. A. G.; GALVÃO, C. O.; NOBRE, P. 2013. Downscaling of a global climate model for estimation of runoff, sediment yield and dam storage: A case study of Pirapama basin, Brazil. Journal of Hydrology, v. 498, n. 1, p. 46-58.
MENDONÇA, I. F. C.; LOMBARDI NETO, F.; VIÉGAS, R. A. 2006. Classificação da capacidade de uso das terras da microbacia do Riacho Una, Sapé, PB. Revista Brasileira de Engenharia Agrícola e Ambiental, v. 10, n. 4, p. 888-895.
BRYAN, R. B. 2000. Soil erodibility and processes of water erosion on hillslope. Geomorphology, v. 32, n. 3, p. 385-415.
MOORE, I. D.; BURCH, G. 1986. Physical basis of the length-slope factor in the Universal Soil Loss Equation. Soil Science Society American Journal, v. 50, n. 5, p. 1294-1298.
CHANDER, G.; MARKHAM, B. L.; HELDER, D. L. 2009. Summary of current radiometric calibration coefficients for Landsat MSS, TM, ETM+, and EO-1 ALI sensors. Remote Sensing of Environment, v. 113, n. 5, p. 893-903. DA SILVA, A. M. 2004. Rainfall erosivity map for Brazil. Catena, v. 57, n. 2, p. 251-259. DA SILVA, A. M.; CASATTI, L.; ÁLVARES, C. A.; LEITE, A. M.; MARTINELLI, L. A.; DURRANT, S. F. 2007. Soil loss risk and habitat quality in streams of a meso-scale river basin. Scientia Agrícola, v. 64, n. 4, p. 336-343. FARINASSO, M.; JÚNIOR, O. A. C.; GUIMARÃES, R. F.; GOMES, R. A. T.; RAMOS, V. M. 2006. Avaliação qualitativa do potencial de erosão laminar em grandes áreas por meio da EUPS – Equação Universal de Perdas de Solos utilizando novas metodologias em SIG para os cálculos dos seus fatores na região do Alto Parnaíba – PI/MA. Revista Brasileira de Geomorfologia, v. 7, n. 2, p.73-85. KABA, E.; PHILPOT, W.; STEENHUIS, T. 2014. Evaluating suitability of MODIS-Terra images for reproducing historic sediment concentrations in water bodies: Lake Tana, Ethiopia. International Journal of Applied Earth Observation and Geoinformation, v. 26, n. 2, p. 286-297. LEPRUN, J. C. 1981. A erosão, a conservação e o manejo do solo no Nordeste Brasileiro. Recife: Ministério do Interior. SUDENE, Brasil. 105p.
MUJABAR, P. S.; CHANDRASEKAR, N. 2013. Coastal erosion hazard and vulnerability assessment for southern coastal Tamil Nadu of India by using remote sensing and GIS. Natural Hazards, v. 69, n. 3, p. 1295-1314 OZCAN, A. U.; ERPUL, G.; BASARAN, M.; ERDOGAN, H. E. 2008. Use of USLE/ GIS technology integrated with geostatistics to assess soil erosion risk in different land uses of Indagi Mountain Pass - Çankiri, Turkey. Environmental Geology, v. 53, n. 8, p. 17311741. PAN, J.; WEN, Y. 2014. Estimation of soil erosion using RUSLE in Caijiamiao watershed, China. Natural Hazards, v. 71, n. 3, p 21872205 PARK, S.; OH, C.; JEON, S.; JUNG, H.; CHOI, C. 2011. Soil erosion risk in Korean watersheds, assessed using the Revised Universal Soil Loss Equation. Journal of Hydrology, v. 399, n. 3-4, p. 263-273. PRASANNAKUMAR, V.; VIJITH, H.; ABINOD, S.; GEETHA, N. 2012. Estimation of soil erosion risk within a small mountainous sub-watershed in Kerala, India, using Revised Universal Soil Loss Equation (RUSLE) and geoinformation technology. Geoscience Frontiers, v. 3, n. 2, p. 209-215. SANTANA, E. F.; BATISTA, L. V.; SILVA, R. M.; SANTOS, C. A. G. 2014. Multispectral image unsupervised segmentation using watershed
Revista Brasileira de Cartografia, Rio de Janeiro, No 68/9, p. 1677-1688, Out/2016
1687
Xavier A. P. C. et al. transformation and cross-entropy minimization in different land. GIScience and Remote Sensing, v. 51, 1-17, 2014. SILVA, A. M.; SCHULZ, H. E.; CAMARGO, P. B. 3003. Erosão e hidrossedimentologia em bacias hidrográficas. São Carlos: Rima. 138p. SILVA, R. M.; MONTENEGRO, S. M. G.; SANTOS, C. A. G. 2012. Integration of GIS and remote sensing for estimation of soil loss and prioritization of critical sub-catchments: a case study of Tapacurá catchment. Natural Hazards, v. 63, n. 3, p. 576-592.
WASIGE, J. E.; GROEN, T. A.; SMALING, E.; JETTEN, V. 2013. Monitoring basinscale land cover changes in Kagera Basin of Lake Victoria using ancillary data and remote sensing. International Journal of Applied Earth Observation and Geoinformation, v. 21, n. 1, p. 32-42. WISCHMEIER, W. H.; SMITH, D. D. 1978. Predicting rainfall erosion losses. Admin. U.S. Department of Agriculture. Washington, Agriculture Handbook Science and Education 357, 58p.
SILVA, R. M.; SANTOS, C. A. G.; LIMA, V. C.; SILVA, L. P. 2013. Erosivity, surface runoff, and soil erosion estimation using GIScoupled runoff-erosion model in the Mamuaba catchment, Brazil. Environmental Monitoring and Assessment, v. 185, n. 65, p. 8656-8676.
XAVIER, A. P. C. SILVA, R. M. 2014. G e o p r o c e s s a m e n t o na m o d e l a g e m d a vulnerabilidade à erosão na bacia do Rio Mamuaba, estado da Paraíba. Anais... XXVI Congresso Brasileiro de Cartografia. SBC, Gramado-RS, 2547-2559.
SILVA, R. M.; SILVA, L. P; MONTENEGRO, S. M. G.; SANTOS, C. A. G. 2010. Spatial analysis of vegetal cover and sediment yield in Tapacurá river catchment based on remote sensing and GIS. Land Reclamation, v.42, p. 5-16.
ZHANG, H.; YANG, Q.; LI, R.; LIU, Q.; MOORE, D.; HE, P.; RITSEMA, C. J.; GEISSEN, V. 2013. Extension of a GIS procedure for calculating the RUSLE equation LS factor. Computers & Geosciences, v. 52, n. 1, p. 177-188.
TACHIKAWA, T.; HATO, M.; KAKU, M.; IWASAKI, A. 2011. Characteristics of ASTER GDEM version 2. Proceedings of Geoscience and Remote Sensing Symposium, IEEE International, 24 to 29 July 2011, 3657-3660.
ZHANG, Y.; DEGROOTE, J.; WOLTER, C.; SUGUMARAN, R. 2009. Integration of Modified Universal Soil Loss Equation (MUSLE) into a GIS framework to assess soil erosion risk. Land Degradation and Development, v. 20, n. 1, p. 84-91.
1688
Revista Brasileira de Cartografia, Rio de Janeiro, No 68/9, p. 1677-1688, Out/2016