Syst. Biol. 55(6):957-971,2006 Copyright © Society of Systematic Biologists ISSN: 1063-5157 print / 1076-836X online DOI: 10.1080/10635150601088995
Mapping Uncertainty and Phylogenetic Uncertainty in Ancestral Character State Reconstruction: An Example in the Moss Genus Brachytheciastrum A. VANDERPOORTEN1 AND B. GOFFINET2 1
Institute of Botany, University of Liege, B22 Sart Tilman, B-4000 Liege, Belgium; E-mail:
[email protected] 2 Department of Ecology and Evolutionary Biology, University of Connecticut, Storrs, Connecticut 06269, USA
The study of trait evolution and diversification has traditionally relied on fossil records, comparisons between fossils and extant forms, and among groups of extant species and estimated divergence times (Mooers et al., 1999). The exponential development of molecular techniques and statistical tools has more recently enabled the exploration of diversification and adaptation of traits in a phylogenetic context (Pagel, 1998; Martins, 2000). Phylogenetic reconstruction of ancestral character states offers a unique framework in evolutionary studies when fossil evidence is not available, either due to the nature of the investigated traits (e.g., behavioral or molecular evolution) or in groups of taxa, wherein fossil evidence is absent or exceedingly scarce. This endeavor involves the reconstruction of ancestral character states on phylogenetic trees according to some evolutionary model or set of assumptions (Pagel, 1999a) globally termed 'comparative methods.' Comparative methods can be used to discover, in a manner that might be described as 'statistical paleontology/ the diversity of biological traits exhibited by ancestral species, but also the nature of the underlying evolutionary process, i.e., the mode, tempo, and phylogenetic component of the evolution (Pagel, 1998). Maximum parsimony has been the most widely used principle for inferring character-state transformations onto a phylogenetic tree. The parsimony criterion singles out the solution requiring the minimum amount of changes on a tree. A range of alternative reconstructions on the same tree however exists, creat-
ing a source of error known as 'mapping uncertainty' (Ronquist, 2004) or 'within-tree uncertainty' (Pagel et al., 2004). By contrast, maximum likelihood estimators have enabled an assessment of the accuracy of reconstructions (Cunningham et al., 1998; Cunningham, 1999). Under the likelihood criterion, branch lengths are used to determine the probability of change. Furthermore, and perhaps more importantly, ML methods implement explicit models of evolution and therefore enable one to make and test hypotheses regarding evolutionary processes by contrasting the fit of different models to the data. The characterization of the phylogenetic 'signal' or component of evolution, i.e., the fact that phylogenetically related organisms tend to resemble each other more than distantly related ones (Blomberg and Garland, 2002), has for example important consequences for the understanding of trait evolution itself (Mooers et al., 1999). Nonphylogenetic models indeed assume that no change occurred in the internal branches and that all changes are restricted to terminal branches, as if the historical signal had been erased in the course of the evolutionary history (Mooers et al., 1999; Oakley et al., 2005). In turn, phylogenetic models assume that the branching pattern of the phylogeny predicts phenotypic evolution. The fit of alternative phylogenetic and nonphylogenetic models, which can be tested by standard likelihood-ratio tests (Oakley et al., 2005), can have important consequences in comparative studies involving across-species trait correlations that are not appropriately described by
957
Downloaded from http://sysbio.oxfordjournals.org/ by guest on June 4, 2013
Abstract.— The evolution of species traits along a phylogeny can be examined through an increasing number of possible, but not necessarily complementary, approaches. In this paper, we assess whether deriving ancestral states of discrete morphological characters from a model whose parameters are (i) optimized by ML on a most likely tree; (ii) optimized by ML onto each of a Bayesian sample of trees; and (iii) sampled by a MCMC visiting the space of a Bayesian sample of trees affects the reconstruction of ancestral states in the moss genus Brachytheciastrum. In the first two methods, the choice of a single- or two-rate model and of a genetic distance (wherein branch lengths are used to determine the probabilities of change) or speciational (wherein changes are only driven by speciation events) model based upon a likelihood-ratio test strongly depended on the sampled trees. Despite these differences in model selection, reconstructions of ancestral character states were strongly correlated to each others across nodes, often at r > 0.9, for all the characters. The Bayesian approach of ancestral character state reconstruction offers, however, a series of advantages over the single-tree approach or the ML model optimization on a Bayesian sample of trees because it does not involve restricting model parameters prior to reconstructing ancestral states, but rather allows a range of model parameters and ancestral character states to be sampled according to their posterior probabilities. From the distribution of the latter, conclusions on trait evolution can be made in a more satisfactorily way than when a substantial part of the uncertainty of the results is obscured by the focus on a single set of model parameters and associated ancestral states. The reconstructions of ancestral character states in Brachytheciastrum reveal rampant parallel morphological evolution. Most species previously described based on phenetic grounds are thus resolved of polyphyletic origin. Species polyphylly has been increasingly reported among mosses, raising severe reservations regarding current species definition. [Ancestral character-state reconstruction; Bayesian inference; comparative methods; moss; uncertainty.]
958
VOL. 55
SYSTEMATIC BIOLOGY
parameters on a single, ML tree; (2) a ML optimization of rate parameters applied to a Bayesian sample of trees; and (3) a Bayesian sample of rate parameters used to produce the posterior probability distribution of ancestral character states. METHODS
Taxon Sampling, Molecular and Morphological Data
Brachytheciastrum is one of 41 genera of the highly diverse pleurocarpous moss family Brachytheciaceae (Hypnales), which, with slightly less than 600 species, represent one of the most diverse families of pleurocarpous mosses (Ignatov and Huttunen, 2002). Brachytheciastrum currently includes nine species that form a strongly supported clade sister to Homalothecium (Vanderpoorten et al., 2005). One species of the latter, H. megaptilum, was selected as outgroup. Within the ingroup, multiple specimens belonging to eight of the nine species were sampled depending on the availability of sufficiently recent collections (Table 1). Each species was therefore represented by one (e.g., B. bellicum, currently only known from the type locality [Buck et al., 2001]) to several accessions. A set of 19 variable morphological characters, including the ones that have been used in the original species descriptions and a series of others that have recently been used in species-level taxonomy of the Brachytheciaceae (Ignatov and Huttunen, 2002), was scored for each of these specimens (Appendices 1 and 2). Preliminary investigation (Vanderpoorten et al., 2005) suggested that the atpB-rbcL intergenic spacer (cpDNA) and the ITS region (nrDNA) may exhibit the appropriate level of variation to discriminate species in the genus. These two loci were amplified and sequenced for each accession according to the protocols described in Vanderpoorten et al. (2002). Due to the difficulties encountered with the amplification of the chloroplast locus in several accessions, a specific set of primers was designed within conserved regions at the 5' and 3' ends of the molecule from the available sequences of the genus: atpB: GGGACCAATAATTTGAGTAATACGTCC (Tm = 65.8°C); rbcL : GGTGACATAGGTCCCTCCC (Tm = 63.2°C). Phylogenetic Analyses
Phylogenetic analyses of DNA sequences were conducted by maximizing the likelihood under the assumptions of a model of nucleotide substitution. The hierarchical likelihood-ratio test (hLRT) has been the most popular method to select, among increasingly complex models, the one that best fits the data with a minimum of estimated parameters. hLRTs do, however, not allow for non-nested comparisons or simultaneous comparison of multiple models. Their use for model selection has therefore been recently questioned. In this context, other selection techniques, including the Bayesian information criterion (BIC) and Akaike information criterion, have been proposed (see Huelsenbeck et al. [2004] and Posada and Buckley [2004] for reviews). Here, we selected the model
Downloaded from http://sysbio.oxfordjournals.org/ by guest on June 4, 2013
conventional statistical methods disregarding phylogenetic dependence in the data (Freckleton et al., 2002; Pagel, 2002; Blomberg et al., 2003). Comparative studies have traditionally been performed onto one or a few trees. Phylogenies are, however, rarely known without error. Different estimates of the phylogenetic tree can return different answers to the comparative question (Miller and Venable, 2003; Ober, 2003; Thompson and Oldroyd, 2004), causing a second source of uncertainty known as 'phylogenetic uncertainty' (Pagel and Lutzoni, 2002; Ronquist, 2004; Pagel et al., 2004). In this context, Markov chain Monte Carlo methods offer a formal framework to sample phylogenies according to their posterior probabilities. A straightforward way of taking phylogenetic uncertainty into account when reconstructing ancestral character states is to find the best-fit model on each tree and derive the corresponding ancestral character states as proposed, for example, by the program package Mesquite (Maddison and Maddison, 2005). This procedure enables an assessment of among-tree variation in ancestral character state reconstruction but does not account for the uncertainty associated with the estimation of the rate parameters themselves on each individual tree. Most recently, a Bayesian Markov chain Monte Carlo procedure was proposed to derive the posterior probability distribution of rate coefficients and ancestral character states (Pagel and Lutzoni, 2002; Pagel et al., 2004). At each iteration, the chain proposes a new combination of rate parameters and randomly selects a new tree from the Bayesian sample. The likelihood of the new combination is calculated and this new state of the chain is accepted or rejected following evaluation by the Metropolis-Hastings term. In an attempt to examine trait evolution along a phylogeny, one is thus left with a series of possible, not necessarily complementary approaches. If the limitations of the MP criterion for character state reconstruction have already been emphasized (Cunningham et al., 1998; Cunningham, 1999), the Bayesian approach of phylogenetic uncertainty is fairly recent and has therefore been applied only in a few cases to comparative studies (e.g., Lutzoni et al., 2001; Pagel et al., 2004). In mosses, the second most diverse phylum of land plants after the Angiosperms, fossil evidence is exceedingly rare (Goffinet, 2000) and comparative methods constitute a tool of prime importance to test hypotheses on the phylogenetic component of morphological evolution and the soundness of characters traditionally used in taxonomy. Although molecular phylogenies are becoming increasingly available to test previous taxonomic concepts (see Goffinet and Buck [2004] for a review), morphological evolution has rarely been explicitly revisited by formally reconstructing ancestral shifts in character states (Vanderpoorten et al., 2002). In this paper, we test species concepts in the moss genus Brachytheciastrum by retracing the evolution of traditional taxonomic characters in a phylogenetic context. We seek for an appropriate model of evolution for reconstructing ancestral character states within the genus, contrasting results from (1) a ML optimization of rate
2006
VANDERPOORTEN AND GOFFINET—UNCERTAINTY IN ANCESTRAL CHARACTER STATE RECONSTRUCTION
959
TABLE 1. Taxon sampling, voucher information, and GenBank accession numbers for the ITS region and the atpB-rbcL intergenic spacer. Taxon
bellicum collimim a collimim b collimim c collimim d colliman e dieckei a dieckei b dieckei c dieckei d fendleri leibergii olympicum a olympicum b olympicum c traclnjpodium a trachypodium b trachypodium c velutimim a
veiutinum b
atpB-rbcL
Voucher (herbarium where deposited)
AY663293 AY663296 AY663297 AY736265 AY736264 AY736263 AY663298 AY663319 AY663313 AY663316 AY663302 AY663301 AY736271 AY736270 AY952447 AY736267 AY736268 AY736266 AY663299 AY663300 AY736269 AY663307
Cano & Ros 9510 (MUR) Sotiaux 14574 (LG) Buck 23168 (NY) Ignatov 31/55 (MHA) Euragina 5. V 2002 (MHA) Czernyadievk $53 (MHA) Sergio sn (LISU) Sergio & Seneca 8163 (NY) Canos & Ros 9512 (NY) Cano & Ros 9513 (NY) Weber & Wittmann B112193 (NY) Buck 37564 (NY) Dull exs 268 (LG) Dull exs 359 (LG) Seregin et al. M-255 (MW) Ignatov 31/229 1992 (MHA) Ignatov 00-1055 6.IX. 2000 (MHA) 23. VII1976 H. Roivainen (MHA) Sotiaux 27346 (LG) Vanderpoorten B51 (LG) Ignatov 15.9.1996 (MHA) Vanderpoorten 4691 (LG)
in the decision theory framework developed by Minin et al. (2003), which is based on the BIC but incorporates branch length error as a performance measure. Simulations suggested that models selected with this criterion result in slightly more accurate branch length estimates, an essential feature of the phylogeny in a character-state reconstruction context. Model selection was done using the program DT-ModSel (Minin et al., 2003). The selected model was implemented in heuristic searches with 300 random addition replicates with TBR branch swapping to find the most likely tree in PAUP* (Swofford, 2002). Branches of zero length were collapsed during the search. No taxon was resolved as part of two distinct clades supported each by >70% Bayesian proportions (BP, see below) in analyses of the nuclear and chloroplast data sets and these partitions were therefore combined into a single matrix (TreeBase accession number M2985). The score of the candidate trees that resulted from the heuristic search was reassessed by specifically modeling base composition, substitution rates, and rate heterogeneity for the chloroplast locus and each of the different partitions of the ITS region, namely ITS1, the 5.8S rRNA gene, and ITS2, using the algorithms implemented by PAML (Yang, 1997). Within each partition, rate heterogeneity was modeled using a discrete gamma distribution with eight categories. A phylogram of the final tree selected for its highest likelihood was eventually constructed with TreeView (Page, 1996). Significant departure of alternative topologies involving a morphological taxon concept from the optimal molecular topologies was tested by constraining the accessions of the same morphospecies to monophyly. Optimal constrained topologies were sought under maximum likelihood. Significant departure from the unconstrained optimal topology was tested using the procedure described by Shimodaira and Hasagawa (1999) with 1000 replicates of full optimization.
Locality (country; province, region, or state) Morocco, Rif France, Hautes Alpes USA, OR Russia, Altai Russia, Astrakhan Russia, Kamchatka Portugal, Beira Alta Portugal, Beira Alta Morocco, Rif Morocco, Rif USA, CO USA, OR USA, CA USA, CA Cyprus, Troodos Range Russia, Altai Russia, Yakytia Russia, Caucasus Belgium, Luxembourg Belgium, Liege Russia, Kursk Canada, BC
Support for clades was assessed using a Bayesian procedure employing a mixture model that simultaneously implements several rate matrices without a priori partitioning of the data (Pagel and Meade, 2004). Four chains of 1,000,000 iterations were run and trees were sampled every 10,000 generations to ensure independence of successive trees. The number of generations needed to reach stationarity in the Markov chain Monte Carlo algorithm was estimated by visual inspection of the plot of the ML score at each sampling point. The trees of the 'burn-in' for each run were excluded from the tree set, and the 100 remaining trees from each run were combined to form the full sample of trees assumed to be representative of the posterior probability distribution. The sampling size, comparable to that used in other studies (e.g., Pagel et al., 2004), allowed the chains to visit most of the frequently occurring topologies, as shown by the similarity of the posteriors returned by each of the four runs. We contrasted the performances of increasingly complex models employing one to three rate matrices, and with or without gamma distributions, to model withinmatrix rate heterogeneity, by plotting the log-likelihood values against the standard deviation of the rate matrix parameters, looking for a cut-off point that corresponds to a slowing in the improvement to the overall log-likelihood and a sharp increase in the standard deviation of the model parameters. Morphological Evolution Model Optimization and Test of Hypotheses.—The phy-
logeny was used to study the evolution for each individual morphological character. The probabilities of change in a branch were calculated by estimating the instantaneous rates of transitions among all possible pairs of states by implementing the Markov model of the software Multistate. We used the 'global' approach, wherein
Downloaded from http://sysbio.oxfordjournals.org/ by guest on June 4, 2013
velutimim c Homalothecium megaptilum
ITS
AY737458 AY737478 AY737459 AY736258 AY736257 AY736256 AY737460 AY737475 AY737476 AY737477 AY737461 AY737462 AY737474 AY737472 AY952446 AY736260 AY736261 AY736259 AY737473 AY737464 AY736262 AY737455
960
SYSTEMATIC BIOLOGY
The significance of the phylogenetic signal was tested by comparing the fit of phylogenetic vs nonphylogenetic models to the data (Mooers et a l , 1999). We thus contrasted the likelihood in the context of the phylogeny and of a star-tree, wherein all internal branches were set to 0 and wherein the length of each terminal branch corresponded to the total path from the root to the extant species. The phylogenetic and nonphylogenetic models include the same number of parameters and the likelihood values they return can therefore be directly compared, with a difference of two being considered significant (Mooers et al., 1999; Oakley et al., 2005). Phylogenetic Uncertainty.—Two methods were used for assessing whether phylogenetic uncertainty affects the probabilities of ancestral character states. In a first series of analyses, the phylogenetic robustness of the reconstructions was assessed, for each node of the phylogeny, by reconstructing ancestral character states using the ML optimization described above across the Bayesian sample of trees. For each tree, model selection was performed as described above and results from different models were combined to form the full range of probabilities of ancestral character states at a node across trees. In order to circumvent the issues associated with the fact, that not all of the trees necessarily contain the internal nodes of interest, reconstructions were performed using a 'most recent common ancestor' approach that identifies, for each tree, the most recent common ancestor to a group of species and reconstructs the state at the node, then combines this information across trees (Pagel et al., 2004). In a second series of analyses, we examined the impact of the choice of a range of model parameters within and among trees by using the Markov chain model implemented by Bayes Multistate to estimate the posterior probability distributions of rate coefficients and ancestral states (Pagel et al., 2004). The rate at which parameters get changed ('ratedev') was set at the beginning of each run so that the acceptance rate of the proposed changes globally ranges between 20% and 50%. Priors of the rate parameters were derived from their likelihood surface as proposed by Pagel et al. (2004). For that purpose, the magnitude of a rate coefficient was manually allowed to vary from low to high values, calculating the likelihood on the 50% majority-rule consensus tree, whose branch lengths were averaged over the 400 sampled trees. This operation was repeated for the other parameter. The resulting likelihood curves were treated as a beta distribution, taking the mode as the mean and calculating the standard deviation on the assumption that the mean ± three times the standard deviation includes all of the rates. Rate coefficients and ancestral character states, reconstructed using the most recent common ancestor approach, were sampled every 100 generations to ensure independence from successive samplings. The chain was run for 4,000,000 generations so that each tree was visited approximately 100 times by the chain on average. The within- and among-tree proportion of the variation in model parameters and ancestral character state reconstructions was partitioned by one-way analysis of variance depending on the factor 'tree number.'
Downloaded from http://sysbio.oxfordjournals.org/ by guest on June 4, 2013
model parameters are first fixed and then used to derive the set of most likely ancestral character states (Pagel, 1999b). 'Local' estimators, by contrast, allow for alternative hypotheses of ancestral states to be tested at each individual node, but do not represent the most likely estimates because different rates are fitted after the node under scrutiny has been set to its two possible states (Mooers, 2004). Global reconstructions, which, for reasons that are still unclear, are more accurate than local ones (Mooers, 2004), provide true posterior probabilities of states across nodes, and thus yield the single best description of the past (Pagel, 1999b; Mooers, 2004). The model includes two parameters: the instantaneous transition rate q and a parameter (/c) used to perform branch length transformations in order to improve the fit of the model to the data, K differentially stretches or compresses individual branches, K > 1 stretches long branches more than shorter ones, indicating that longer branches contribute more to trait evolution (as if the rate of evolution accelerates within a long branch), K < 1 compresses longer branches more than shorter ones. At the extreme, K = 0 is consistent with a mode of evolution, in which trait evolution is independent of the length of the branch (Pagel, 1994). We tested whether models directly employing genetic distances (or a transformation thereof) to determine the probability of change, i.e., models allowing for continuous changes along the branches, described the evolution of the traits significantly better than 'speciational' models employing branches of equal lengths. To this end, we contrasted the fit of a model, wherein K was restricted to 0 (all branches of equal length), with the fit of a model, wherein K was free to take its most likely value. The two models differ in one parameter and can thus be compared by a likelihood-ratio test, according to which the more complicated model provides a significantly better representation of the data if twice the difference in log-likelihood returned by the respective models is higher than a chi-square variate with one degree of freedom (Pagel, 1994). Finally, we used a likelihood ratio to test whether applying a model including a forward and backward transition rate significantly improved the likelihood as compared to a single rate model. All the parameters were then fixed to calculate the probabilities of ancestral character states across all nodes. In binary characters, evidence for phylogenetic signal in the data is found anytime the probabilities of ancestral states differ from 0.5 and signal intensity is proportional to departure of ancestral state probabilities from 0.5 (A. Meade and M. Pagel, personal communication). Indeed, the probabilities of change along each branch are weighted by the prior probability of state at the beginning of the branch (Pagel, 1999b). Thus, when all ancestral state probabilities equal 0.5, the state at a node is independent of the state at the previous node, as if there was no history in the tree. In this case, our experience is that transition rates acquire very large values, so that the transitions probabilities pii(t) and pi ; (t) do not depart from the 0.5 stationary frequencies assumed by the model (see Lewis, 2001:915).
VOL. 55
2006
VANDERPOORTEN AND GOFFINET—UNCERTAINTY IN ANCESTRAL CHARACTER STATE RECONSTRUCTION
Comparison Among Methods of Ancestral Character State
RESULTS
Phylogenetic Reconstruction
The ITS region and the atpB-rbcL intergenic spacer respectively included 4.5% and 6.1% of variable sites within Brachytheciastrum. Both partitions yielded congruent topologies and were therefore combined. The substitution model selected for the combined data set was the Hasegawa et al. model (see, e.g., Nei and Kumar, 2000, for reference) with a gamma distribution (a = 0.1149) to model among-site heterogeneity. The model implemented a transition/trans version ratio of 1.7654 and A, C, and G nucleotide proportions of 0.2975, 0.1953, and 0.2136, respectively. Heuristic searches using these settings resulted in a unique ML tree (-lnL = 2526.51). Allowing the fit of different rate parameters, base compositions, and shapes of the gamma distribution for each of the molecular partitions with highly divergent GC contents, transition-transversion ratios, and patterns of rate heterogeneity resulted in a substantial improvement of the likelihood (—lnL = 2349.38). Three morphospecies were resolved as polyphyletic assemblages in the optimal topology. Constraining successively each of those morphospecies to monophyly resulted in a significant decrease in log-likelihood (AlnL = 23.53, P = 0.02 for B. collinum; AlnL = 29.6, P = 0.02 for B. dieckei; and AlnL = 22.72, P = 0.03 for B. trachypodium).
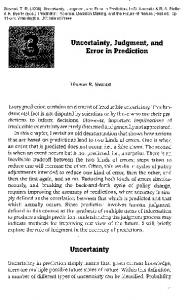
The log-likelihoods returned by increasingly complex models implementing one to three HKY rate matrices during the Bayesian analysis of the combined DNA data set are represented as a function of the standard deviation of the rate parameters in Figure 1. The curve shows a sharp cut-off point at the two-rate matrix model. Beyond that level of complexity, the loglikelihoods returned by models employing more parameters exhibited a very slow increase, whereas standard deviations of rate parameters substantially increased. The two-rate matrix model was therefore selected for
st dev t/ty 6U
3r •3r+r • 2r+r
20-
• 1r+r
10-
• 2r
• 1r
n-
1
(.
1
-2590 -2580 -2570 -2560
1 lnL -2550 -2540
FIGURE 1. Plot of the standard deviation of the transition/trans version ratio of the HKY substitution model over the 400 MCMC sample of trees as a function of the average log-likelihoods returned by increasingly complex substitution models implementing one (lr) to three (3r) rate matrices, with or without V distributions to model within-matrix rate heterogeneity.
producing the Bayesian sample of trees used to compute branch posterior probabilities (Fig. 2) and for assessing phylogenetic uncertainty in ancestral character state reconstruction. The reconstructions were performed O bellicum collinum e O trachypodium c ) dieckei b dieckei d O velutinum a
N4
O velutinum b O velutinum c _ collinum a ^collinum b collinum d collinum c O dieckei c N28 O leibergii trachypodium a trachypodium b Qdieckei a 100,
N39 Qolympicum a
Qolympicumb Oolympicum c Homalothecium megaptilum 0.005 substitutions/site FIGURE 2. Phylogram of the 50% majority-rule consensus of the 400 MCMC sample of trees with branch lengths averaged over the whole sample from the Bayesian analysis of ITS and atpB-rbcL sequences in Brachytheciastrum using a mixture model with two-rate matrices. Number below the branches correspond to the proportions in which they appear in the 400 sampled trees. Pie diagrams indicate the probabilities of ancestral state for stem leaf cell width (character 16: white: >8 /xm; black: