trast, the Mars Pathfinder mission, scheduled to launch in 1996, will carry an 11 kg rover that will move at most a few 100 meters. (m) in a mission lasting 1 to 4 ...
Mars Microrover Navigation: Performance Evaluation and Enhancement Larry Matthies, Erann Gat, Reid Harrison, Brian Wilcox, Richard Volpe, and Todd Litwin Jet Propulsion Laboratory - California Institute of Technology 4800 Oak Grove Drive Pasadena, California 91109
Abstract In 1996, NASA will launch the Mars Pathfinder spacecraft, which will carry an 11 kg rover to explore the immediate vicinity of the lander. To assess the capabilities of the rover, we have constructed a new microrover testbed consisting of the Rocky 3.2 vehicle and an indoor test arena containing Mars analog terrain and overhead cameras for automatic, real-time tracking of the true rover position and heading. In this paper, we present initial performance evaluation results obtained with this testbed. We first decompose rover navigation into four major functions: goal designation, rover localization, hazard detection, and path selection. We then describe the Mars Pathfinder approach to each function, present results to date of evaluating the performance of each function, and outline our approach to enhancing performance for future missions. The results show key limitations in the quality of rover localization, the speed of hazard detection, and the ability of behavior control algorithms for path selection to negotiate the rock frequencies likely to be encountered on Mars.
1
Introduction
In planetary exploration, cost constraints are shrinking the size of spacecraft and reducing the scope of missions that can be undertaken. For Mars rovers, the result has been a shift from the large rovers and long missions envisioned in the 1980’s to the small rovers and short missions planned now. For example, the Mars Rover Sample Return (MRSR) mission scenario envisioned a 1000 kilogram (kg) rover that would navigate autonomously for 100’s of kilometers (km) in a mission lasting much of a year [1]; in contrast, the Mars Pathfinder mission, scheduled to launch in 1996, will carry an 11 kg rover that will move at most a few 100 meters (m) in a mission lasting 1 to 4 weeks. Future Mars missions must broaden the range of exploration within even more stringent mass constraints; hence, rover technology development must put more capability into lighter, smaller packages. To develop such rovers, we need a quantitative understanding of the limitations of current rovers. Unfortunately, quantitative information about rover performance is severely lacking. Although robotic vehicles have been built for a number of applications [2, 3, 4], most published performance data is anecdotal; that is, it reports speeds attained, distances covered, or missions performed over a few test courses, but does not quantify reliability as a function of sensor suite or terrain characteristics. Such information is necessary to establish the reliability of given rover designs, as well as to trade-off design alternatives when size constraints strongly limit the sensing and computing capabilities that can be placed onboard. The work described in this paper was performed at the Jet Propulsion Laboratory, California Institute of Technology, under a contract with the National Aeronautics and Space Administration.
To obtain such information, we are developing methodologies and experimental facilities to enable systematic evaluation of rover navigation performance. An important tool in this work is a new microrover test arena that uses overhead cameras to provide automatic, real-time tracking of the true rover position and heading. We create Mars analog terrains in this arena by distributing rocks according to parameterized models of rock distributions at the Viking lander sites. We are using this facility to quantify rover navigation performance as a function of rock frequency and have recorded detailed logs of over 85 navigation trials to date. This work has taken important steps forward in defining performance evaluation methodologies for rover navigation and in measuring the performance of current rover prototypes. This is a key step in validating rover navigation performance for the 1996 Pathfinder mission and in guiding future rover development. This paper is organized as follows. Section 2 gives an overview NASA’s Mars Exploration Program, including a description of the lander and rover being built for the Mars Pathfinder mission and a discussion of how rover requirements are likely to evolve for future missions. Section 3 describes the facilities built for rover performance evaluation and introduces a decomposition of the rover navigation task into the functions of goal designation, rover localization, hazard detection, and path selection. For each of these functions in turn, sections 4, 5, 6, and 7 describe the approach being taken for that function by the Pathfinder mission, our approach to evaluating performance of that function, and the results of evaluation to date. Section 8 summarizes our principal results and plans for future work.
2
Mars Exploration Program
Current plans call for multiple launches every launch window (roughly every 25 months), beginning in November, 1996. The missions for 1996 are the Mars Global Surveyor orbiter and the Mars Pathfinder lander. Follow-on missions are anticipated in 1998, 2001, and 2003.
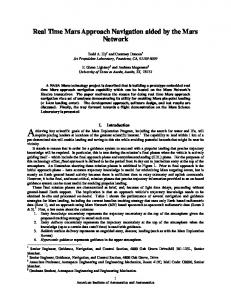
2.1 Mars Pathfinder Mission Mars Pathfinder will launch in December 1996 and land in July 1997. The lander will carry a small rover, known as the Microrover Flight Experiment (MFEX), a stereo camera pair, and other scientific instruments. The total launch mass of the spacecraft, including the rover, is 712 kg. The chosen landing site, known as Ares Vallis, is believed to be a catastrophic flood channel. This site was chosen because it
Electronics box Rocker bogey APXS
Cameras and laser stripers
Solar panel
Between waypoints, the rover will use onboard hazard detection sensors and behavior control algorithms to avoid obstacles (sections 6 and 7). The rover will operate for approximately four hours per day, centered around noon, due to solar power and temperature constraints. Power, temperature, and other factors will limit rover traverses to between 3 and 40 m per day. At the end of each day, the lander will transmit a stereo image pair of the rover to Earth; human operators will use these images to update the position and orientation of the rover prior to the next day’s operation. A principal objective of the rover mission is to use the APXS to determine the composition of rocks near the landing site.
2.2 Follow-on Missions
Figure 1: Pathfinder rover
is expected to contain rocks from several geologic units, which would have been swept along the flood channel and deposited in this area. The rover primary mission lasts one week, with a goal of four weeks; the lander primary mission is one month, with a goal of one year. 2.1.1 Key Lander Characteristics The lander is a tetrahedron approximately 1.5 m wide and 1.0 m high; its mass is 264 kg, including a 23 kg payload of the rover, stereo cameras, and other science instruments. The lander computer is the RAD 6000, a radiation-hardened version of the IBM RS 6000, with 128 MB of mass memory on a VME backplane, running the VxWorks operating system. Imaging uses a multispectral stereo camera pair with a pan/tilt mount on a mast 1.5 m above the ground. In addition to scientific observations, this imaging system will be used for designating rover goal locations and for updating the rover position. The cameras have a stereo baseline of 15 cm, CCD imagers with 256 256 pixels, and an angular resolution of 0.001 radian per pixel. 2.1.2 Key Rover Characteristics The rover is 65 cm long, 48 cm wide, and 30 cm high; its mass is 11.5 kg, including 1.3 kg of science instruments (figure 1). The chassis is a passive rocker bogey mechanism designed to allow the rover to climb rocks about 15 cm high. The rover computer is an Intel 8085 with 0.5 MB of mass memory; its software is a custom executive with a single thread of control. Obstacle detection is done with a light-stripe triangulation system, angle encoders on the bogeys, and other sensors. Science instruments include an alpha/proton/x-ray spectrometer (APXS) and a dust adhesion sensor. The rover communicates with the lander over a UHF radio with a range of 500 m. Primary power for the rover comes from solar cells, which have a peak output of 16 W at noon; non-rechargeable batteries provide power through the night. The power budget is sufficiently tight that only one major function (eg. driving, steering, transmitting, and hazard detection) is performed at a time. The rover mission will be controlled by human operators on Earth, who will use stereo image pairs from the lander to designate waypoints leading to places where experiments are to be performed.
Current plans for U.S. missions in 1998 include a second orbiter and a lander. The payload for the lander has not yet been decided. For cost reasons, plans for the lander call for a smaller launch vehicle than for Pathfinder, which would force the lander itself to be as much as 50% lighter than Pathfinder. Plans beyond 1998 are less well defined, but include the possibility of multiple landers per launch vehicle; this would require each lander to be lighter still. Exploration objectives for these missions include landing at higher latitudes than Pathfinder, exploring the polar ice caps, and carrying a broader suite of instruments for sample acquisition, sample analysis, and seismic and meteorological observation. In this general picture, rovers compete for payload allocation with other instruments and instrument deployment methods; hence, rovers must offer higher pay-off than alternative payloads. This requires designing rovers to be desirable platforms for rover-mounted instruments. It also requires increasing the speed and navigation range of rovers, to enable a greater number of science operations per day and exploration over much greater distances from the lander. To meet these requirements, we need a firm assessment of the limitations of current rovers. The balance of this paper presents our first step in this assessment.
3 Navigation Functions, Evaluation Methodology, and Facilities We decompose the task of rover navigation into the following four functions:
� � � �
Goal designation: where does the rover need to end up? Rover localization: where is the rover now? Hazard detection: where are the obstacles? Path selection: which path should the rover take to the goal?
Inevitably, each of these functions will be performed with some level of uncertainty. Therefore, we assess the performance of each function separately, as well as test the overall navigation system in Mars analog terrain. Our testbed vehicle is Rocky 3.2, a rebuilt version of Rocky 3 [5] that has essentially the same chassis design, size, computer, and sensor suite as MFEX. Testbed facilities also include a mockup lander of approximately the same size as the Pathfinder lander, with color stereo cameras on a pan/tilt mount and the same stereo baseline and angular resolution as the Pathfinder camera system. Indoor testing is conducted in a 4 12 m arena filled with sand and rocks. To create Mars analog terrain, the rocks are selected
4
60 50 40 30 20 10
Goal Designation
The Pathfinder approach to goal designation is for mission operators on Earth to specify 3-D waypoints using stereo imagery from the lander. Waypoints will be specified using a stereographic display to view the scene and a spaceball to input 3-D coordinates. Waypoint coordinates are subject to systematic errors caused by miscalibration of the cameras, mast, and pan/tilt axes and to random errors caused by noisy estimation of the stereo disparity of the waypoint. Experimental evaluation of the likely size of these errors has not yet been undertaken; however, reasonable bounds can be established from prior experience with similar camera systems. For convenience, we express waypoint uncertainty in terms of the crossrange and downrange errors in the estimated coordinates, as a function of the true range to the waypoint. For random errors, we assume conservatively that waypoints are designated in the image with a standard deviation of one pixel and that the stereo disparity of waypoints is estimated with a standard deviation of 0.1 pixel [6]. As noted in section 2.1.1, the angular resolution of the lander cameras is 0.001 radian/pixel. Therefore, these assumptions about image plane designation error imply approximate crossrange and downrange uncertainties of [6]: c d
� �
0:001 R
(1)
0:0001 R 2 =B �
(2)
respectively, where R is the true range and B is the stereo baseline (15 cm). Systematic errors, in the form of translational and rotational errors in the location of the camera in the lander coordinate frame, will compound the designation uncertainty. Of these, rotational errors are likely to be most significant. To first order, rotational errors ( r ) introduce only crossrange error ( c ) in the waypoint coordinates: (1): c
=
R
(3)
If the orientation of the cameras is known only to within one degree 0:017 radian), then the systematic error in camera orien( tation greatly dominates the crossrange uncertainty due to angular resolution of the camera. Figure 2 shows the random and systematic errors predicted by (1) through (3). The meaning of these results depends on the type of goal the rover is trying to reach, the accuracy of rover localization, and the ability of the rover to overcome localization errors by recognizing the goal as it draws near. For the goal of placing a spectrometer against a rock, the size, spacing, and individual recognizability of
=
Designation error (cm)
according to size distributions that have been estimated for rocks in various Martian terrain types (see section 7). During navigation trials, the true rover position and heading can be tracked with a set of cameras mounted in the ceiling. Systematic tracking errors (eg. due to camera calibration) are less than 2 cm in position and 0.4 degrees in heading; random tracking errors (ie. repeatability) are approximately 0.3 mm RMS error in rover position and 0.2 degrees RMS error in rover heading. These facilities are being used to evaluate performance for each of the four navigation functions listed above. In the following sections, for each function we outline the approach being taken for the Pathfinder rover, the evaluation approach and results to date, and the approaches being taken to enhance performance.
0
10
20 30 Radial distance (m)
Figure 2: Designation error vs. distance. Solid: standard deviation of downrange random error; dashed: standard deviation of crossrange random error; dotted: crossrange systematic error assuming one degree miscalibration of pan angle.
rocks become relevant concerns. For now, we simply note that figure 2 predicts that designation error will be less than half the vehicle width (48 cm) within the range of the rover primary mission, or roughly 10 m from the lander; hence, designation performance is likely to be adequate within that range. For distances beyond 20 m, the combined designation error is likely to exceed the dimensions of the vehicle, making it difficult for the rover to find goal rocks at such ranges based on 3-D coordinates alone.
5
Rover Localization
The Pathfinder approach to rover localization uses deadreckoning and a daily location update sent from Earth. Deadreckoning will be performed with wheel encoders and a solid state turn rate sensor. Since these sensors are subject to drift, the rover location will be updated once daily by imaging the rover from the lander, sending the images to Earth, localizing the rover by interactively registering a graphical rover model to the imagery, and uplinking the observed rover position and heading prior to the next day’s operations. Deadreckoning performance is being evaluated by measuring and extrapolating the performance of Rocky 3.2, which uses the same deadreckoning sensors as MFEX. Since deadreckoning performance is a function of terrain characteristics, we established a base case by measuring deadreckoning error with the rover traversing level sand with no rocks or other obstacles. Error in heading (�) and total distance traveled (r) was estimated as the difference between the deadreckoned estimates and those measured by the overhead tracking system. Results obtained from twenty runs of approximately 7 meters each showed a growth in error variance of 0.70 deg 2 /m for � and 0.0039 m2 /m for r. Since error in the turn rate sensor is a function of time, heading error is a function of the vehicle velocity. For Rocky 3.2 the velocity is 15 cm/sec, whereas for MFEX it is 0.67 cm/sec; therefore, directly scaling the heading error 16 to the MFEX velocity produces a variance of 0:70 15=0:67 deg2 /m. We assume that factors contributing to distance error are
�
0.6 0.4
4 3 2 1
0.2
5
Heading error std. dev. (deg)
0.8
5
Position error std. dev. (m)
Heading error std. dev. (deg)
Position error std. dev. (m)
1.0
4 3 2
20
15
10
5
1
0.0 0
10
20 30 Distance traveled (m) (a)
0
10
20 30 Distance traveled (m) (b)
Figure 3: Extrapolations of position and heading error vs. distance traveled: (a) using variances for Rocky 3.2 on sand, (b) using heading variance extrapolated to MFEX velocity. Solid: heading; dashed: forward position; dotted: lateral position.
not a function of the vehicle velocity. To predict deadreckoning error over longer distances, we used the measured results to define noise terms in the following rover state equations:
xi+1 yi+1 �i+1
= = =
xi + ri cos �i yi + ri sin �i �i + �i
That is, we assume that at each time step i the rover moves straight in the current direction for distance ri , then turns in place through angle �i . Since MFEX will stop to look for obstacles every 6.5 cm (one wheel radius), Monte Carlo simulations were run with ri 6:5 cm and � i 0 deg; at each time step, r i and �i were corrupted by Gaussian white noise with variances obtained by scaling the empirical results above to 6.5 cm per step. Figure 3a shows the standard deviation of x, y, and � as a function of the mean distance traveled, using the error variances measured for Rocky 3.2. Error in the lateral direction (y) grows much more quickly than error in the forward direction (x), because over moderate distances heading error affects lateral position to a much greater degree than forward position. Figure 3b shows the results using the heading error variance extrapolated to the MFEX velocity. The significance of these results is what they suggest about the ability of the rover to reach its intended goal. Consider first the results for Rocky 3.2 shown in figure 3a. At 10 m, the standard deviation of lateral error is 27 cm, or about half the vehicle width. The standard deviation of forward error is 20 cm. From figure 2, designation errors at this distance are likely to be less than 17 cm. Hence, for a rock of any reasonable size within a 10 m traverse, Rocky 3.2 should be able to reliably stop near enough the rock to find it with contact sensors or the light stripe sensor. This conclusion was supported by success in a dozen outdoor trials conducted in September, 1994, in which goal rocks were typically about 5 m from the lander. After 20 m of total traverse, figure 3a predicts the standard deviations to be 76 cm for lateral position and 29 cm for
=
=
forward position; designation errors are likely to be in the 20 to 30 cm range. This is enough error that the light stripe sensor and/or local search are likely to be necessary to reliably find the goal. When we consider the results obtained with heading error scaled to the MFEX velocity (figure 3b), at 10 m the standard deviations are 125 cm for lateral error and 24 cm for forward error. This suggests that reaching a goal 10 m from the lander will be difficult without external updates of rover position and heading to cancel deadreckoning error. At 5 m, the corresponding values are 45 cm and 15 cm. At this distance, it is likely that the rover will be able to deadreckon close enough to goal rocks to find them with the hazard detection sensor. After the above base case, we did experiments with the rover turning and/or driving over rocks. For example, figure 4 shows a trace of vehicle position for a run involving three rocks. Rock B was not detected on this run; however, the rover scraped its hubs considerably against rock B and scraped slightly against rock C . Signficant heading errors (> 5 deg) occurred whenever the rover scraped a rock or turned through a large angle. Over the 8.1 meter run, this produced a final heading error of 15.3 degrees and position error of 1.0 m. These results suggest that the turn rate sensor was slightly miscalibrated and that its performance degraded appreciably when terrain interactions induced vibration in the vehicle. This underscores the importance of further evaluation of deadreckoning performance on rocky ground; we return to this issue in section 7. Collectively, all of the deadreckoning results demonstrate the need to periodically update the rover location from other measurments. For Pathfinder, this will be done by interactively matching rover models to imagery sent to Earth. With deadreckoning errors like those observed above, this approach will limit sorties to specific locations to under 10 m/day. To simplify mission operations and to enable longer traverses for future missions, it is highly desirable to update the rover location automatically, using sensors and computers onboard the rover, the lander, or even an orbiter. Approaches being pursued include: (1) putting a sun sensor on the rover to
4
B 3
C 2
A
1.5 2
3
4
5
6
7
8
9
10
Figure 4: Planview plot of vehicle trajectory for a run with three rocks. Axis units are meters. Solid line: true rover trajectory; dashed line: deadreckoned trajectory. The rover scraped its hubs against rocks B and C.
provide absolute heading measurements, (2) automatically locating the rover in lander imagery to provide position and heading measurements when the rover is in view from the lander (see [7]), and (3) developing a radio navigation system to provide lander-relative bearing and range measurements when the rover is beyond visual range from the lander.
6
Hazard Detection
The Pathfinder approach to hazard detection is to detect rocks, pits, and excessive slopes with a light stripe ranging sensor, rocker bogey angle encoders, inclinometers, motor current sensors, and contact sensors on the edges of the solar panel and the leading edge of the undercarriage. Since the Pathfinder philosophy is to count on lookahead sensors (ie. the light striper) as the primary means for hazard detection, we concentrate here on the design and performance of the light stripe sensor. The light striper performs active triangulation using two cameras and five laser diode-based light stripe emitters (figure 5). The rover’s 8085 CPU performs all computing and control functions for the sensor, including clocking and readout of the CCD, exposure control for the image, and all image processing for hazard detection. The system detects images of four points along each stripe to produce an array of 20 measurements of terrain elevation. On level ground, the farthest point on the central stripe projects about 30 cm in front of of the rover; the farthest points on the outermost stripes project about 13 cm beyond each side of the rover. A hazard is declared if any of the following criteria are met:
� � �
either of the nearest two points for any laser are not detected in the images; the elevation difference between any two 8-connected neighbors in the 4 5 measurement array exceeds a threshold; the difference between the highest and lowest elevation of the whole array exceeds another threshold.
Currently, Rocky 3.2 scans for hazards once every wheel radius of forward motion (6.5 cm). As discussed below, the rover has to stop to do each hazard scan.
Figure 5: Geometry of the MFEX light stripe-based lookahead sensor, approximately to scale, showing camera fields of view (solid lines), light stripes (dotted lines), and where the array of 4 5 measured elevation points land on flat ground (filled circles).
Two groups of performance issues are important for hazard sensors: (1) the reliability of hazard detection and (2) the mass, power, volume, and runtime requirements of the sensor. Evaluation of reliability is still in progress; therefore, we will discuss only the resource requirements of the sensor. The mass and volume of the sensor components are relatively insignificant. The MFEX power budget for hazard detection mode is 7.33 W, which consists of 2.01 W for two lasers at a time, 3.77 W for the CPU and I/O functions, 0.75 W for the CCD’s, and 0.8 W to run the attitude sensors. Thus, the lasers are a relatively significant part of the power budget. The time required to perform hazard detection is 20 seconds per scan. Since MFEX will drive about 6.5 cm between scans at a speed of 0.67 cm/sec, the net traversal
rate will be around 0.22 cm/sec; in a word, painstaking. Still, this should be enough to reach rocks a few meters from the lander within an hour. Goals for improving the performance of this system are to increase its speed and reliability while reducing its power consumption, in order to explore much more territory per day. Approaches to doing so include:
� � �
Reducing the power consumption by changing the beam fanout from about 300 scanlines to 3 scanlines, saving of a factor 100 in power requirement per emitter. Replacing the CCD imagers with CMOS imagers [8]. This offers the potential of a factor of 10 power reduction for imaging, plus the potential for much faster processing by incorporating image processing electronics onto the imager chip itself. Switching from active triangulation to passive triangulation with stereo vision. In previous work [6, 9], we have developed and demonstrated reliable stereo vision-based hazard detection systems for automobile-sized vehicles. Recent benchmarks with simplified versions of these algorithms show that a 68040 CPU can do all of the processing to produce 45 45-pixel range imagery in about one second per frame. Therefore, stereo vision is now both practical and attractive for microrovers.
7
Path Selection
The Pathfinder approach to path selection is a behavior control algorithm [5, 10] that uses very simple steering logic based on the instantaneous state of the hazard detection sensors; that is, it uses no internal map or memory of previously encountered hazards. Basically, the logic is as follows: IF there is no hazard, move forward and turn toward the goal, ELSE IF there is a hazard on the left, turn in place to the right until no hazard is detected; ELSE IF there is a hazard on the right, turn in place to the left until no hazard is detected. Hazards in the center are resolved by turning right if that is clear, otherwise turning left. The simplicity of the algorithm makes it practical to implement on the 8085 flight computer. Experience to date shows that the algorithm is quite effective as long as obstacle frequencies are not too high; as discussed below, ongoing performance evaluation is quantifying what is meant by “too high”. To evaluate the performance of a path selection algorithm, we must define the terrain type(s) on which the rover is tested and the metrics against which performance is measured. Knowledge of Mars terrain on the scale of a rover is available from images and other measurements made by the two Viking landers. Lower resolution knowledge, on scales from a few meters to many kilometers per pixel, is available from Viking orbiter imagery and Earth-based radar observations [11]. The lander imagery has been used to derive a model, known as Moore’s model, of the rock size frequency distribution for the Viking Lander 2 (VL-2) site; together with rock abundances estimated from orbiter thermal imagery, this model can be used to predict rock size distributions for other areas of the
Figure 6: View of Mars looking northeast from Viking Lander 2. The rock in the lower right corner is about 0.25 m wide and 2.5 m away; the largest rock in the center of the image is about 1.0 m wide and 6.5 m away. The horizon is about 3 km away; its slope is due to the 8-degree tilt of the lander. planet [12, 13]. Moore’s model gives the cumulative number N of rocks/m2 with diameters of D and larger as
N
= kD; :
2 66
(4)
=
where k 0:013 for the VL-2 site. This model predicts that 19% of the surface around the lander is covered by rocks 0.1 m in diameter and larger, which is in agreement with rock abundance estimates made from global thermal inertia data. These rock abundance estimates give the modal value of surface rock cover over the whole 0:00415 planet as 6%. From this value, one can obtain k for the modal rock abundance; in what follows, we refer to this case as “nominal” terrain. Thermal inertia and other data indicate that the Pathfinder Ares Vallis landing site has a rock abundance approaching 20%, which suggests a rock size frequency distribution comparable to VL-2. Figure 6 shows an image from the VL-2 site for illustration. One approach to creating terrains for rover testing is to generate randomly placed rock fields with sizes randomly chosen from Moore’s model. Another approach is to define obstacles as all rocks with diameters greater than or equal to some fixed value D 0 , to ignore all rocks with D < D0 , to use Moore’s model to predict the number of obstacles/m 2, and to generate randomly placed obstacles with that frequency. We have used both approaches in experiments conducted to date. One class of performance metric is to estimate the probability that the rover will reach its goal, for an ensemble of test runs over a given terrain type, and to catalog the nature of the failures that occur when the rover does not reach the goal. A second class of metric is to estimate the distribution of some parameter of the runs as a function of terrain type, such as the total distance traveled to reach goals a given radial distance from the lander. We have conducted tests with each metric; the first has been used for terrains
=
4
3
2
1
0 2
3
4
5
6
7
8
9
10
Figure 7: Map of one run in nominal terrain. Octagons show positions and sizes of rocks placed in the test arena. The solid line traces the rover’s actual position; the dotted line traces its deadreckoned position. Filled circles on the traces mark rover positions at which obstacles were detected. The starting point was the on the left, the goal point was the on the right. generated in terms of obstacles/m 2, the second for terrains with rocks distributed according to Moore’s model with k defined for nominal terrain. We plan to extend the latter set of tests to terrains with k ranging up to the value for the VL-2 site. Since these tests are very laborious to conduct, we are also developing a computer simulation of rover runs and attempting to validate the simulation by comparing its predictions to the results of real runs. Ultimately, we also intend to evaluate path selection performance as function of the onboard sensor suite, for example by varying the set of hazard detection sensors, to make trade-offs of capability versus mass and power budgets. For terrains defined in terms of obstacles/m 2 (obs/m2 ), one set of twelve runs was performed with 5 obstacles in a 17.6 m 2 area and two sets of six runs each were performed with 10 and 15 obstacles in the same area (0.28, 0.57, and 0.85 obs/m 2 , respectively). All obstacles were rocks of between 25 and 35 cm diameter, which was large enough to be detected unambiguously by the light stripe sensor. In each case, the rover was given a goal 7.6 m away. A run was declared successful when the rover’s deadreckoned position estimate implied that it had reached the goal. At 0.28 and 0.57 obs/m2 , all runs were successful. At 0.85 obs/m 2 , four runs were successful, one run failed when the rover got jammed between two rocks and depleted its batteries, and one run was terminated when it became clear that the rover couldn’t find a way to the goal. Plausible predictions of the obstacle frequency at the Pathfinder landing site on Mars range from 0.65 to 2.0 obs 2/m. By these results, the Pathfinder landing site may be difficult to traverse with the current navigation system. Although the above results provide insight into rover performance, characterizing terrain in terms of obs/m2 effectively models navigation as taking place in a 2-D world and ignores the 3-D geometry of the terrain. Therefore, we are conducting a larger set
Min Mode Max
Distance error (%)
Heading error (deg)
Position error (m)
-3.0 4.8 9.0
0.2 8.0 37.2
0.22 0.69 2.45
Table 1: Deadreckoning error statistics for 40 runs in “Mars nominal” terrain. The mode of the true distance traveled was 8.39 m. Two runs showed a negative distance error (true distance > deadreckoned distance); this is possible because deadreckoning includes a scale factor used to calibrate for wheel slip on level, rock-free sand.
of trials with rock frequencies generated from Moore’s model. To date, we have completed a set of 40 trials for “nominal” terrain (6% rock abundance). Figure 7 shows the rock layout and the true and deadreckoned rover positions for one of the runs. The rover avoided large rocks several times during the run and drove over several small rocks. The run was declared successful, but owing to deadreckoning error the true final position of the rover was 1.4 m from the goal. Out of 40 runs, only one was unsuccessful; in this case, the run was terminated because the rover could not find a path through the rock field to the goal. Table 1 summarizes deadreckoning error statistics for these runs. These errors are consistent with the errors shown in figure 4, but significantly larger than the errors seen for straight line runs with no rocks. Higher rock frequencies will be tested in the future. Approaches to improve the path selection algorithm will include using maps generated from lander imagery, rover sensors, or both. Their value will be evaluated by measuring their impact on the variables used above, including failure rates and mean distance traveled over large numbers of trials.
8
Summary and Conclusions
Autonomous navigation systems for robotic ground vehicles have not been subjected to systematic, quantitative performance evaluation as a function of terrain difficulty. We have begun to fill this gap by developing facilities and methodologies for evaluating the performance of microrovers for Mars exploration. In this paper, we outlined current plans for Mars exploration over the next decade, summarized the design of the lander and rover for the 1996 Mars Pathfinder mission, and described our rover evaluation testbed. We then decomposed the navigation task into four functions: goal designation, rover localization, hazard detection, and path selection. For each function, we outlined the approach being taken for the Pathfinder mission, the results of performance evaluation to date, and the technologies we are developing to improve performance for future missions. For goal designation, simple sensitivity analyses show that designation errors reach one vehicle length (60 cm) at about 20 m from the lander and grow quadratically with distance beyond that. Since the rover uses onboard sensors to recognize prominent rocks from about a vehicle length away, this approach to goal designation should be adequate within 20 m; new methods will be necessary at greater distances. For rover localization, deadreckoning performance has been evaluated with Rocky 3.2. In 40 trials on the nominal rock distribution, with a straight line distance from start to goal of 7.6 m, typical errors in distance traveled were 4.8%. Typical errors in position and heading at the end of a trial were 0.69 m and 8.0 deg, respectively; worst case errors were 2.45 m and 37.2 deg. Overall, the deadreckoning results suggest that localization updates [7] will be needed at least every 10 m if the rover is to successfully reach specific rocks. For hazard detection, speed is a key limitation of the sensor, which takes 20 seconds per hazard scan. This stems from a combination of factors, including the slowness of the 8085 processor, the wide fan-out of the light stripes, and the constrained power budget on the rover. At this rate, the current plan of doing hazard scans once per wheel radius of forward motion leads to a maximum traverse of 30 m in the four hours available per day. For path selection, in terrains characterized by the number of obstacles/m2, Rocky 3.2 succeeded in reaching goals 7.6 m away in 18 out of 18 trials for obstacle frequencies up to 0.57 per square meter. At 0.85 obstacles/m2, only 4 of 6 trials were successful. Plausible estimates of obstacle frequencies for the Pathfinder landing site range from 0.65 to 2.0 obstacles/m2. In terrains characterized by Moore’s model set to the nominal 6% rock abundance, 39 out of 40 trials were successful. The rock abundance predicted for the Pathfinder landing site is close to 20%; it remains to be seen how well the rover will perform in such terrain. In conclusion, the most significant limitations revealed to date are poor heading estimation and slowness of the hazard detection system. In addition, there is uncertainty about how well behavior control algorithms for path selection will work at the rock frequencies likely to be encountered on Mars. Future work will use a sun sensor, visual and radio localization aids, stereo vision-based range imaging, and map-based path selection algorithms to alleviate these problems and to enable exploration over much greater distances with lighter, lower-power vehicles. Quantitative performance evaluation of the kind begun here will be invaluable in this
process. We expect that similar methodologies will carry over to evaluation of robotic vehicle performance in other applications.
References [1] B. H. Wilcox, D. B. Gennery, and A. Mishkin. Mars rover local navigation and hazard avoidance. In Proc. SPIE Conf. 1007, Mobile Robots III, pages 72–76, November 1988. [2] B. Wilcox et al. Robotic vehicles for planetary exploration. In Proc. IEEE Int’l Conf. on Robotics and Automation, pages 175–180, May 1992. [3] E. G. Mettala. The OSD Tactical Unmanned Ground Vehicle Program. In Proc. DARPA Image Understanding Workshop, pages 159–172. Morgan Kaufmanm Publishers, January 1992. [4] D. Wettergreen, C. E. Thorpe, and W. Whittaker. Exploring Mount Erebus by walking robot. In Proc. 3rd Int’l Conf. on Intelligent Autonomous Systems (IAS-3), pages 72–81. IOS Press, February 1993. [5] E. Gat, R. Desai, R. Ivlev, J. Loch, and D. P. Miller. Behavior control for robotic exploration of planetary surfaces. IEEE Journal of Robotics and Automation, 10(4):490–503, August 1994. [6] L. H. Matthies and P. Grandjean. Stochastic performance modeling and evaluation of obstacle detectability with imaging range sensors. IEEE Transactions on Robotics and Automation, 10(6):783–791, December 1994. [7] R. Volpe, T. Litwin, and L. Matthies. Mobile robot localization by remote viewing of a colored cylinder. In Proc. 1995 Int’l Conf. on Intelligent Robots and Systems (IROS’95), August 1995. [8] E. R. Fossum. Active pixel sensors: are CCD’s dinosaurs? In Proc. SPIE Conf. 1900: Charge-coupled devices and solid-state optical sensors III, pages 1–13, 1993. [9] L. H. Matthies. Stereo vision for planetary rovers: stochastic modeling to near real-time implementation. International Journal of Computer Vision, 8(1):71–91, July 1992. [10] R. A. Brooks. A robust layered control system for a mobile robot. IEEE Journal on Robotics and Automation, RA-2(1), March 1986. [11] H. H. Kieffer (ed.). Mars. University of Arizona Press, 1992. [12] H. J. Moore and B. M. Jakosky. Viking landing sites, remote-sensing observations, and physical properties of Martian surface materials. Icarus, 81:164–184, 1989. [13] P. R. Christensen and H. J. Moore. The Martian surface layer. In H. H. Kieffer, editor, Mars, chapter 21, pages 686–729. University of Arizona Press, 1992.