MATHEMATICAL MODELLING AND SIMULATION OF GRID CONNECTED SOLAR PHOTOVOLTAIC SYSTEM K.N.DINESH BABU1, R.RAMAPRABHA2 & V.RAJINI3 1University of Petroleum & Energy Studies, Dehradun, India 2&3SSN College of Engineering, Chennai, India E-mail :
[email protected],
[email protected] &
[email protected]
Abstract - This paper presents the mathematical modeling of three-phase grid connected inverter fed by Solar Photovoltaic (SPV) system with Maximum Power Point Tracking (MPPT). Analysis has been carried out to choose the proper modulation index for maximum output for three-phase inverter. With this modulation index, the variation of the active and reactive power for different loads has been presented along with major parameters like Transfer ratio and Efficiency. Also the Real and Reactive power output of the SPV has been measured with various solar Radiation levels.
1.
and reactive power. The SPV system exhibits nonlinear characteristics due to the following reasons. Insolation and temperature of SPV cell Movement of clouds and other natural factors mask the Sun’s ray from the SPV Cells The output of the SPV Cells needs to be converted to three phase power and synchronized with the grid The load in the grid is also a variable that depends on time, location and season A trip command issued by a relay to a major load would often result in power swing and the output of the SPV cells to the grid needs to be stable during this period Loss of a generator in the grid would result in power swing and the output of the SPV Cells to the grid needs to be stable during this period In this paper the mathematical model of Solar Cell, Inverter, load and power measurement is discussed. The active and reactive power measurement with simulation results under different conditions is shown. It helps the user to understand the fundamental parameters of grid connected SPV system. The basic block diagram of the system is shown in Fig.1. In the following sections, the detailed modeling of each block in Fig.1 is discussed. The required analyses have been carried out with the help of the developed mathematical models.
INDEX TERMS
Solar Photovoltaic cell, Mathematical model, Three Phase Inverter, Grid Modelling, Transfer ratio, Efficiency. 2.
NOMENCLATURE
I.
INTRODUCTION The problem of power injection into the grid must be investigated by modelling the SPV system as well as the grid. The design should be a controlled inverter output suitably interfaced with SPV system and grid, which can be capable of controlling real
A well-known five-parameter model of a SPV
International Journal of Electrical and Electronics Engineering (IJEEE) ISSN (PRINT): 2231 – 5284, Vol-2, Iss-1, 2012 73
Mathematical Modelling and Simulation of Grid Connected Solar Photovoltaic System
cell is considered for this work [2]-[3]. The mathematical equations used to simulate the realistic model of SPV cell are given in equations (1) and (2) There should always be a balance in generation and demand for power system stability. Considering the factors mentioned above, it is evident that solar generation and load variations are dynamic in nature. To manage the two dynamic variables for effective usage of power generated by SPV, a detailed analysis of the system is required. II. ONE DIODE MODEL OF SOLAR PHOTOVOLTAIC CELL Fig. 2. V-I and V-P Characteristics of 12x2 SPV Array
A well-known five-parameter model of a SPV cell is considered for this work [2]-[3]. The
I Ipv Id Ish
I.
(1) In this work, Perturb and Observe (P&O) algorithm [4] is used for MPP tracking. It has a simple feedback structure and fewer measured parameters. It operates by periodically perturbing (i.e. incrementing or decreasing) the array terminal voltage and comparing the SPV output power with that of the previous perturbation cycle. In rapidly changing atmospheric conditions, the MPPT takes considerable time to track the MPP. The illumination for 12 hours during a sunny day is obtained (Fig 3). The program runs for the recorded illumination for 12 hours in a sunny day. The simulation of algorithm is also given in Fig.3. From Fig.3, it is inferred that the P and O algorithm tracks MPP for various illumination levels.
I I m I sh where I m I pv I d ;
Im I pv Npp Io N pp [expA 1] ; A
V I(R ss N ss / N pp ) N ss Vta
I pv [ I pvn K i dt]
IMPLEMENTATION OF MAXIMUM POWER POINT TRACKING ALGORITHM
;
[R Rp ] G and Ipvn s ISCn (2) Gn Rp
For this work SOLKAR model having the following specifications have been used. The specifications at STC are: ISC=2.55A, Voc=21.24V, Imp=2.25A, Vmp=16.56V, Pmp=37.08W. The mathematical model of SPV system has been developed using MATLAB/SIMULINK with equations (1) and (2). To get the requisite voltage and current for the grid connected system considered for this work (5A and 230V), number of cells in series and parallel have been properly increased in the model. SPV array consists of 12 panels in series to obtain 230V and 2 panels in parallel to obtain 5A. The simulated characteristic of 12x2 array is shown in Fig. 2.
Fig.3 Simulation of illumination for 12 hours and tracking using Perturb and Observe Algorithm
International Journal of Electrical and Electronics Engineering (IJEEE) ISSN (PRINT): 2231 – 5284, Vol-2, Iss-1, 2012 74
Mathematical Modelling and Simulation of Grid Connected Solar Photovoltaic System
Maximum Power Point Tracker (MPPT) can be realized using different converter topologies. In this paper boost converter is used due to its high efficiency. The boost converter interface is used between SPV array and rest of the system. It acts as MPP tracker. The design equations for boost converter are given from (8) to (10). Vo 1 Vs 1 D
TCV
1 D2 DR
2f D C min 2fR f = frequency 10 kHz. The inductance and capacitance are calculated as L=100uH, C=220uF. The value of resistance used is 100 Ω.
A Three Phase inverter is used to convert the DC output from the Solar Module to a constant AC three phase 50Hz output. Analytical model is an important tool for prediction of dynamic performance and stability limits using different control laws and system parameters. Mathematical model of the inverter must be established before the design stage. The typical configuration of a threephase full-bridge inverter is considered [6]. Semiconductor switching devices (Q1–Q6) of the inverter are controlled by PWM signals to obtain three-phase near sinusoidal ac voltages of the desired magnitude and frequency at the inverter output [5]. The switching functions can be mathematically represented as follows
A kSink(t
2 ); 3
A kSink(t
4 ) 3
k 1,3,..
Sc (t )
k 1,3,..
200
300
400
500
600
700
800
900
1000
2000
P in W and Q in VAR
G
P
Q
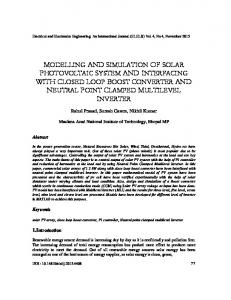
Fig. 4. Active and Reactive Power variation
The transfer ratio of the SPV module is defined as the ration of the AC Power output of the Inverter to the DC Power input. The Transfer ratio for various levels of insolation is depicted in Fig 5. It is observed that, at low radiation levels below 300 W/m2 the inverter operates nonlinearly.
A kSink(t 0) ;
180 160 140 120 100 80 60 40 20 0 100
k 1,3,..
(10)
P and Q Vs G
Sb (t )
(9)
The Solar radiation levels are modified to study the effect on inverter output. The Real and Reactive power output of the inverter for various solar insolation levels are shown in Fig 4. The maximum insolation for tropical countries like India is around 1000 W/m2
II. MATHEMATICAL MODEL OF THREE PHASE INVERTER
Sa (t)
(8)
Line Voltage Equations VAB TAV TDC ; VBC TBV TDC ; VCA TCV (3) TDC Phase Voltage Equations 1 VAN [ (TAV TCV )] VDC ; 3 1 VBN [ ( TBV TAV )] VDC ; 3 1 (4) TBV )] VDC ; VCN [ ( TCV 3 V. VARIATION OF INVERTER (5) PARAMETER WITH SOLAR INSOLATION CHANGES
Where Vo = Output voltage, Vs = Source voltage, D = Duty cycle. The critical values of the inductance and capacitance can be calculated using the following equations,
Lb
1 Sa Sb ; TBV 1 Sb Sc ; 2 2 1 Sc Sa 2
TAV
(6)
TAV 1 1 0 Sa T 1 0 1 1 S (7) BV 2 b TCV 1 0 1 Sc The matrix expansion gives the TAV, TBV and TCV values, which can be used to obtain the Line and Phase voltages as shown. Fig. 5. Transfer ratio variation International Journal of Electrical and Electronics Engineering (IJEEE) ISSN (PRINT): 2231 – 5284, Vol-2, Iss-1, 2012 75
Mathematical Modelling and Simulation of Grid Connected Solar Photovoltaic System
The modulation index ‘m’ and phase angle ‘Ø’ play a major role in the generation of the PWM pulses for the inverter and hence its voltage. Hence the effect of m and Ø upon Real and Reactive power of the inverter is analysed. The results are given in Fig 6.
Fig. 7. Transfer Ratio, Active Power and Reactive Power for m=0.7
III. SPV AND GRID INTEGRATED SYSTEM
Fig. 6. Voltage, Active Power and Reactive Power for various m values
From the above result the following points can be summarised. When the Ø value varies there is no significant change in Active and Reactive power. The above measurement was noted for Ø =0 and Ø =180. The Active and Reactive power are at their maximum when m=0.7 Hence for further investigation the m value is taken as 0.7 and real, reactive power and transfer ratio is shown in Fig 7 Fig. 8. SPV Grid Connected System
International Journal of Electrical and Electronics Engineering (IJEEE) ISSN (PRINT): 2231 – 5284, Vol-2, Iss-1, 2012 76
Mathematical Modelling and Simulation of Grid Connected Solar Photovoltaic System
[Fig 8 shows the SPV system connected to the grid. The real and reactive power at the inverter output terminal and at the grid terminal are given in Fig 9.
IV. CONCLUSION The mathematical model developed for the Grid connected SPV system has provided a constant Voltage and Power output after 10 cycles. This model can be used as the fundamental building block for further study on Grid connected SPV system REFERENCES [1]
John Twidell and Tony Weir, “Renewable Energy Resource”, Second Edition.
[2]
Solar Engineering of Thermal Process, John A Duffie, Emeritus Professor of Chemical Engineering and William A Beckman, Solar Energy Laboratory, University of Wisconsin-Madison, Second Edition.
[3]
Marcelo Gradella Villalva, Jonas Rafael Gazoli, and Ernesto Ruppert Filho (2009), “Comprehensive Approach to Modeling and Simulation of Photovoltaic Arrays”, IEEE Transactions on Power Electronics, Vol. 24, no. 5, pp 1198-1208.
[4]
Jawad Faiz and Ghazanfar Shahgholian (2009), “Modeling and Simulation of a three-phase inverter with rectifier-type non-linear loads”, Najafabad, Isfahan, Iran.
[5]
“Power Electronics”, Third Edition Rashid
[6]
R.Ramaprabha and B.L.Mathur (2010), “Comparative Study of Series and Parallel configurations of Solar PV Array under Partial Shaded Conditions”, International Review on Modeling and Simulations (I.RE.MO.S.), Col. Xx, n.x
[7]
Jawad Faiz and Ghazanfar Shahgholian, “INVERTER WITH RECTIFIER-TYPE NONLINEAR LOADS”, Armenian Journal of Physics, 2009, Vol.2 issue 4, pp.307-316
[8]
Nicola Famia, Giovanni Petrone, Giovanni Spagnuolo, and Massimo Vitelli (2005), “Optimization of Perturb and Ob33serve Maximum Power Point Tracking Method,” IEEE Trans., Power Electron. vol...20, No
Time in Sec
Time in Sec
by Mohamed H
International Journal of Electrical and Electronics Engineering (IJEEE) ISSN (PRINT): 2231 – 5284, Vol-2, Iss-1, 2012 77