relationships was only revealed after all scripts had been examined and analysed using the mapping technique. Contributing factors to an unsuccessful solution.
Mathematics Education Research Journal
1996, Vol. 8, No.2, 174-197
Mathematical Processing and Cognitive Demand in Problem Solving Gloria Stillman James Cook University This study investigated the relationship between senior secondary students' written responses and the mathematical and cognitive processing used when solving a complex problem. At the macro-level, response maps were used to categorise scripts by global strategy. These categories were stratified into clusters displaying common elements of mathematical structure. At the micro-level, the maps revealed difficulties faced by students in applying known facts and formulae to complex word problems: The majority of students were able to identify the essential elements of the problem and to recall necessary formulae and procedural skills but they had difficulty establishing crucial links between the data in their representation. This did not necessarily reduce the cognitive demand of the task the student attempted to solve. Cognitive demand appeared to be more related to the global strategy chosen.
Introduction The ability to solve mathematical problems of an unfamiliar and non-standard kind particularly in an applied context is a highly desirable outcome of ,mathematical instruction in high school classrooms. Ostensibly, pen and paper problem-solving tasks are set as assessment items to gauge a student's level of performance in higher-order cognitive processes such as interpreting and analysing information, formulating and evaluating a mathematical model in a novel situation and validating results within a simulated context. This report describes that part of a larger study (StiUman, 1993) which focused on the mathematical processing which resulted in a particular solution to a problemsolving test item. The underlying. cognitive processing which leads to that mathematical processing will also be described.
Theoretical Background for the Study Much traditional research in problem·solving (see for example, Allen, 1974; Meyer, 1980) concentrated on analysing the product of a problem-solving session. As pointed out by Davis (1984), the construction of a representation of the problem "need not be a one,..chance-only process" (p. 85). Indeed a successful problem solver must have the ability to: 1. construct and decompose different representations of problems; 2. move flexibly among different representations as new insights into the problem become apparent; and 3. recognise when one representation is more useful than another. Processing involves two main emphases. Search processing involves looking for a path from the problem statement to the goal by passing successively through a series of intermediate legal states. Various strategies have been described, including "working forward" (Bourne, Dominowski, Loftus & Healey, 1986) and "backward chaining" (Reiter, .1980) but possibly the most useful in examining
Mathematical Processing and Cognitive Demand in Problem Solving
175
mathematical problem solving is an "event-driven" strategy such as the Hayes.. Roth "opportunistic" planning model(Hayes-Roth & Hayes-Roth, 1979). Luria (1966, 1973) has postulated two different forms of information processing. With successive processing individual stimuli are analysed andcoded in a serial fashion. Successive processing results in automatised operational routines which are not necessarily available for conscious reflection. This is the appropriate mode of processing when order of information is important, and according to Luria is of little use in problem solving. However, Crawford (1986) has pointed out that "subjects that are low in successive processing ability will have difficulty in maintaining the problem conditions in mind and in the use of speech to regulate operational activities" (p. 167). Simultaneous processing, on the other hand, is of major importance in all phases of problem solving (Luria, 1973). Simultaneous processing integrates individual stimuli arriving consecutively in the brain into groups which can be surveyed as a whole. This information is then incorporated into a system of conceptual connections which form the framework for complex cognitive activity as occurs during problem solving. Information validation at both the local and global levels is desirable but often is absent or perfunctory (even in successful solutions) (Schoenfeld, 1987; Stillman, 1990). Working memory is the contemporary term given to the· cognitive resources used to execute mental operations and to remember the results of those operations for short periods of time (Baddeley, 1992). Thus, tasks which involve working memory combine remembering information with doing some processing on that information. Working memory has a limited capacity and this is the limiting factor in our ability to process information (Bruer, 1994). The cognitive demand (Evans, 1991) imposed by a problem solving task is taken to mean the demand on attentional resources and working memory imposed by the task. However, these are not considered to be independent but interrelated and constrained by some maximum capacity (Sweller, 1988). Carlson, Khoo and Yaure (1990) pointed out that in addition to the demands of temporary storage and concurrent processing of information in working memory, there is often a further demand for the integration of information. This may involve the integration of various chunks of the given data or the integration of cued concepts and processes and/or interim results during processing. To date there are no direct measures of cognitive demand but it is proposed that the following could be used as an indicator of the relative cognitive demand of problem-solving tasks or student responses to those tasks: (a) the number of data required in the solution and their complexity and (b) the extent of the demand on working memory as determined by the number of interim results required, and by the number of times that two or more processes or two or more interim results have to be combined to produce a further interim result orthe final solution.
The Mapping Procedure The development of a mapping procedure by Chick, Watson and Collis (1988) to analyse mathematical responses to reveal their underlying structure has proved a useful addition to the toolkit of researchers in problem solving. The response maps were originally devised to illustrate the SOLO levels (Biggs & Collis, 1982) of responses to typical mathematical questions posed in high school classrooms. The
176
Stillman
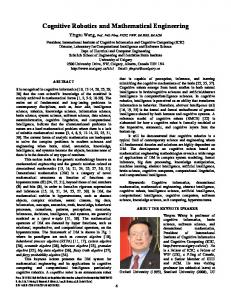
maps provided a visual metaphor for the taxonomy which linked a cue to a response by the subject's increasingly complex use of working mem'Jry and logical operations. The five stages of the metaphor are (a) prestructural c,hich uses no relevant information in producing a response; (b) unistructural whic 1". uses a single relevant .cue and one concept or process to produce the response; (c) multistructural which involves several isolated pieces of relevant data used repetitively with a number of concepts or' processes; (d) relational which interrelates several aspects of the data into an integrated whole; and (e) extended abstract which requires higher order principles and additional abstract concepts and processes external to the question. Collis and Watson (1991) provide a fuller explanation with mathematical examples. The usefulness of the maps in examining students' responses and classifying errors using a scheme developed by Chick et al. (1988) has been demonstrated with area problems (Watson, Chick & Collis, 1988), a polynomial problem (Chick, 1988) and early multiplication word problems (Watson & Mulligan, 1990). Taplin (1992, 1994) has also used them to observe perserverance patterns during problem solving, while Watson (1994) has used the maps to examine strategies for solving The Three Hungry Men Problem. Chick (1988) suggested a further use for the mapping technique would be task analysis maps because of the power of the technique "to visually represent and highlight the structural and procedural steps in a solution" (p.108). Before using a problem as an assessment item, the task analysis map can be used on the model 'solution to identify the data and the processes which are required for a successful solution. The map highlights the mathematical structure of what the examiner perceives as a well-reasoned solution and gives a visual indication of the cognitive demand of the task. In a similar way, when the resulting student responses to the set task are analysed, response maps illuminate the mathematical structure (or lack of it) in the student's recorde~ solution. The maps readily identify those components of the data that were employed or ignored, the mathematical processes applied to these data and the apparent ordering of that processing. The maps can then be used to categorise responses according to perceived commonalities. To obtain a task analysis map, information from the question statement (including any implicit formulae which are essential if a correct solution is to be obtained) is identified and represented by a black dot ("e"). Information which is external to the question but which could be useful is identified and represented by an open dot ("0"). The student's expected combining of this information to reach various subgoals in the solution process is shown by joining arcs from the various data and processes to nodes representing the subgoals. The solution progresses from left to right across the map with the final conclusion at the far right. Just how the given information in a problem statement is perceived as mathematical entities, contextual and visual cues can be quite subjective as "incoming material is 'chunked' by recognising a sequence of several items as forming a familiar unit" (Broadbent, 1987, p. 182). It will therefore be dependent on the mathematical sophistication of the problem solvers and their~)!ior experience. Consequently, it was decided in this study to represent in the tc.): analysis map only the information which was specifically identified and n· .:orded by the examiner in the model solution. A typical task analysis map is shown in Figure 1.
Mathematical Processing and Cognitive Demand in Problem Solving
177
An information-processing approach shifts attention away from the product to the processes involved in producing that product. From this viewpoint four major component areas of information-based activity are involved during problemsolving: information gathering, information representation, search and information processing and information validation. However, these processes are not sequential stages in problem solving as some processes occur concurrently and the problem solver can cycle back and forth through the various processes as often as necessary (Davis, 1985).
Figure 1. A typical task analysis map.
Initially, information is gathered from the problem statement which may be verbal, visual or written or a combination of all three. For successful information gathering, however, there needs to be an interface between the problem statement and the cultural and mathematical experience of the problem solver. Kennedy (1984) proposed that the reader's perspective can be regarded as a "set of propositions" (p. 97). Understanding what is written then involves a matching between what is being read and this set of propositions. With respect to mathematical material, Krutetskii (1969, 1976) found that the nature of the information acquired from a problem statement differed for students of different mathematical ability, with the more capable students being able to "extract from the given terms of a problem the information maximally useful for solution" (1976, p. 233). It is this capacity to select and interpret information that is maximally useful to the task which reduces the attentional demand of the task and the demand on the working memory as attentional capacity is not wasted in focusing on extraneous data. Concurrently with the information-gathermg process, the problem statement is translated into an internal mental representation. This requires language and factual knowledge as well as knowledge of problem schemata (Davis, 1984; Mayer, 1981, 1982). Response maps are similar to task analysis maps except that two additional symbols are used. Inappropriate or incorrect information either in the question or external to it that the student has identified and/or used is indicated by an "x." Solution pathways which are abandoned or which lead to no conclusion are indicated by a square bracket (/T/). Figure 2 shows a typical response map displaying the characteristics mentioned above. Chick (1988) included all the given data elements in the response map and did not distinguish between the case where not all the data were selected and the case where all the data were selected but not applied. In the study being described, only those elements of the data whi~h had been specifically identified and recorded by the student were included in the map as this distinction was useful in analysing and explaining the erroneous model used in those scripts which employed the most common flawed global strategy.
Stillman
178
Final Solution
Figure 2. A typical response map.
Chick (1988) included all the given data elements in the response map and did not distinguish between the case where not all the data were selected and the case where all the data were selected but not applied. In the study being described, only those elements of the data which had been specifically identified and recorded by the student were included in the map. This distinction was useful in analysing and explaining the erroneous model used in those scripts which employed the most common flawed global strategy. Collis and Watson (1991) have updated this version of the mapping procedure. However, the more recent version appears to produce diagrams of considerable complexity even with simple word problems so it waS decided not to attempt to use these with complex word problems at the senior secondary level as it was thought that their complexity could promote teacher resistance to their use. Collis (1994) has, however, recently shown that the updated version can be successfully applied to a typical senior secondary polynomial problem.
Purpose of the Study The specific research question investigated in this paper was: Is it possible to identify characteristic response types in written scripts from mathematical problem-solving sessions and to classify these in terms of mathematical and cognitive attributes?
Method Two problems (see Appendix) 'were posed in the study but only the Famine problem will be examined here. The sample consisted of the scripts from 121 students at a Catholic Girls' School. The ages of the students ranged from 15 years 7 months to 17 years 10 months. The students were in their penultimate year of high school and were studying a mathematics subject, Mathematics I, within the academic stream of senior mathematics which is normally taken by students intending to undertake courses at university which involve mathematics. To minimize any possible Hawthorne effect (Gay, 1987) and to enhance the ecological validity (Neisser, 1976) of the study, efforts were made to collect data under conditions corresponding as closely as possible to the school's regular assessment programme. The students were therefore asked to solve the Famine Problem under formal examination conditions and were allowed 25 minutes to
Mathematical Processing and Cognitive Demand in Problem Solving
179
complete the task. It was felt that this was the maximum feasible time available in one lesson period, and in a pilot study had proved sufficient for all students to complete the task, including those who employed the longest method. It is acknowledged that the conditions under which the problem solving was carried out did have an effect on the types of global strategies employed as was shown in the main study (Stillman, 1993). This was considered to be a result of the fact that students felt constrained to use algebraic methods in a formal examination whereas all methods were considered equally valid in other situations.
The Task
The Famine Problem Every day during the month of July, Relief Aid Abroad trucked supplies of food into the famine stricken areas of Nacirema. On the first day, 1000 tonnes were shifted; on the second day, 1100 tonnes were shifted; on the third day, 1200 tonnes were shifted and so on until a maximum amount was reached. The supply of food then declined by 100 tonnes per day until the end of the month. If the total food supplied for the month was 59300 tonnes, on which day of the month was the maximum amount trucked out?
Analysis ofTask This problem can be solved by a variety of methods. Figure 3 shows the solution provided by the Mathematics Co-ordinator and a task analysis map of that solution. To obtain this map, firstly, the given data components from the problem statement (e.g., 59300 tonnes) identified by the Maths Coordinator and the concepts, formulae, processes or strategies (e.g., First A.P., Tn formula or algebraic manipulation) directly related to the mathematical context which were used in her solution were recorded and indicated on the map by a black dot, •. Data of a less direct association (e.g., 31 days in July) were indicated by an open dot, o. The expected progress through the solution was then mapped by showing how data and processes were combined at each stage. For instance, the information from the second sentence of the problem statement led to the Mathematics Co-ordinator recording that there was a first sequence with a = 1000 and d = 100 so it was inferred that this first sequence was an A.P. as shown in the map. This data was then combined with the formula for the nth term of an A.P. to give the interim result that Tn = 900 + lOOn. Subsequently, this interim result was combined with another to produce the following equation for the first term of the second A.P., T1 = 800 + lOOn. The mapping continued in this manner until the final result, n = 18, was produced at the far right. The problem w'as presented in a purely written format and, as can be seen from the task analysis map, entailed a large complex data set for initial perception, representation and analysis. The problem was expected to tax the problem solver's working memory capacity through the size of the data set and the number of variables and relationships stated explicitly and implied. There were 12 chunks of data identified in the map, one of which was external to the context of the question
180
Stillman T3].n = a +(n -l)d
Let no. of day be n.
(1/2)
= (800 + lOOn) + [31 - n -1] x -100 = 800 + lOOn + (30 - n) x -100
1st sequence a = 1000
(1/2)
d= 100
(1/2)
= 200n - 2200
(1/2)
53].n = (31-n)/2[(800 + lOOn) + (200n - 2200)]
Tn = a + (n - l)d
(1/2)
= 1000 + (n - 1)100 =900 + lOOn
(1/2)
= 4650n - 21700 - 150n2 + 700n = -150n 2 + 5350n - 21700
(1)
(1/2)
= n/2[1900 + lOOn] = 950n + 50n2
= (31-n)/2(300n -1400) = (31 - n)(150n - 700)
(1/2)
5n = n/2 (a + 1) = n/2[1000 + (900 + lOOn)]
(1/2)
Therefore, (1/2)
59300 = 950n + 50n2 - 150n2 + 5350n 21700
(1)
59300 = -100n2 + 6300n - 21700 593 = -n2 + 63n - 217
2nd sequence d = -100
(1/2)
T] = Tn (for 1st sequence) -100 = 900 + lOOn - 100 = 800 + lOOn
(1/2)
T2 = 700 + lOOn
Therefore, n 2 - 63n + 810 = 0 (n - 18)(n -45) = 0
(1/2)
n = 18 or 45
(1/2)
Since n::;; 31 (1/2), max amt was trucked on 18th day.
(1/2)
First A.P.
a = 1000 d= 100 n
Tn = 900 + lOOn
= no. of days
Tn Formula Tl = 800 + lOOn
Sn Formula Second A.P. d
= -100
31 days in July 59300 tonnes
_-------~:::::::-c:::::::::::::==~_=
Algebraic ManiP:. Quadratic Factorisation Schema
n
= 18
Figure 3. Mathematics co-ordinator's solution, marking scheme and task analysis map for the famine problem.
M11thematical Processing and Cognitive Demand in Problem Solving
181
The problem was presented in a purely written format and, as can be seen from the task analysis map, entailed a large complex data set for initial perception, representation and analysis. The problem was expected to tax the problem solver's working memory capacity through the size of the data set and the number of variables and relationships stated explicitly and implied. There wer~ 12 chunks of data identified in the map, one of which was external to the context of the question. Five of these needed to be interrelated before use and this is shown by joining with curved arcs. In seven instances data had to be used in conjunction with other pieces of data to produce an interim result. Nine interim results were used. On four occasions, two or more interim results were combined to produce another interim result. As this would place a considerable demand on the student's working memory it was expected that students would. augment working memory with an external representation such as pen and paper. It was envisaged that successful solutions would require sustained abstract reasoning supported by efficient memory and resource management. There was going to have to be maximal use of working memory as would be expected of an extended abstract task (Collis & Watson, 1991). This would be necessary throughout the solution process: (a) during information gathering in selecting relevant data from the large complex data set; (b) during information representation in identifying the interrelationships between the various pieces of data; (c) during the execution stage as mathematical processing proceeded; and (d) during validation as many pieces of information needed to be interrelated to verify the solution. Solution of the problem using the strategy employed by the Mathematics Co-ordinator would thus result in a task high in cognitive demand.
Analysis of Student Scripts The response maps were used at two levels to examine the student scripts. At the macro level, the maps were used to classify scripts by global strategy and to identify the major flaws in solutions in each category. At the micro level, they were used to identify the confounding factors contributing to failure.
Strategies Used in Solving the Problem Analysis of the student scripts revealed that students produced four potentially successful global solution strategies which will be referred to as Strategies A, B, C, and D. Strategy A modelled the total food supplied during the month by the addition of the terms of two A.P.s, one for the period of the month when the daily food supply was increasing and one for when it was decreasing. Strategy B relied on finding a model for the difference between the amount of food that would have been delivered if there had been no increase and the amount that was actually delivered. The only potentially successful model that was used was the sum of an A.P. for the daily differences. Strategy C was a numerical approach which probably involved trial and error using a calculator. A typical script using this method showed a list of figures with the whole month's daily tonnage. The method for selecting the correct day can only be surmised as none of the students interviewed in the main study used this method. Strategy D was a trial and improvement
,182
Stillman
approach which combined an overall algebraic strategy using A.P.s with guided numerical checks, i.e., finding the size of the supply by using the formulae taking various times during the month for the start of the decrease and then choosing another day'to trial depending on whether the supply was too high or too low. The remaining scripts were all irretrievably flawed by the global strategy employed and these have been identified as strategies E, F and G. Almost fifty percent of students used a version of Strategy E which involved only a single A.P. Of these students some showed no evidence in their scripts of having noticed that food shipments had begun to decrease, some recorded the decrease but chose to ignore it, while others forced its use within the single A.P. strategy. Strategy F arose from four students falling into the trap of attempting to find a solution to the problem by constructing an erroneous association with a· familiar problem type which resulted in the introduction of an irrelevant G.P model which they subsequently did not abandon. Strategy G was used by .only a few students although it appeared as a rejected alternative in others. rThe method involved a symmetrical averaging on the basis that d = 100 changed to d = -100 in the second part of the sequence. The resulting generalisation led to the erroneous conclusion that the maximum amount of food was trucked on the middle day of the month (16th). The response clusters produced by using these particular strategies were categorised accordingly, and then stratified within each category into clusters displaying particular common elements. Table 1 below shows the initial categorization and the frequency of the various strategies. Those scripts employing strategy A will be examined further as an illustration of the technique used to stratify each cluster and its utility. Table 1
Categorisation of Examination Scripts for the Famine Problem by Global Strategy Strategy A B C D E F G
Description Addition of two Arithmetic Progressions Difference method Numeric method Formalised trial and improvement One Arithmetic Progression Geometric Progression / Arithmetic and a GP Symmetric Averaging
TOTAL
Frequency
36 18 4
5
52 4 2 121
Difficulties with Problem Representation Using Strategy A At the macro level, there were three links between data which were vital to a student's successful representation of the problem. Of the 36 scripts using Strategy A, three (8.3%) had no missing links in the student's representation of the problem. Seven (19.4%) had one missing link, 18 (50%) had two, while 8 (22.2%) had three. The nature of these missing links appeared to contribute to the diffieulty of the problem. By far the most difficult link to make was the relationship between the last term of the first Arithmetic Progression (A.P.) and the first term of the second A.P. The first term of the second A.P. was 100 less than the last term of the first A.P.,
Mathematical Processing and Cognitive Demand in Problem Solving
183
i.e., T1 = Tn(lst seq.) -10~. ~is l~k ~as missing in ~O (83.3%) of the scripts using strategy A and was the mlssmg lmk m 6 of the 7 scnpts that had just one tnissiI1.g link. The second most difficult link to establish was the relationship between the number of tei-US in the two A.P.s. As there were n terms in the first A.P. and 31 terms altogether in the two A.P.s, there must have been 31 - n terms in the second. Twenty-six (72.3%) of the scripts did not show this link correctly. The third most difficult link to establish was the link between the sums of the two A.P.s, that is to say, 59300 = 5n + 531- n. Ten (27.8%) of the scripts had this error but this particular link was not omitted in isolation. These links have been highlighted and numbered in order of difficulty in Figure 4. First A.P. a= 1000 d= 100 n = no. of days
Tn = 900 + lOOn
Tn Formula Sn Formula
T1
=800 + lOOn
Second A.P. d
=-100
= 200n - 2200 (2)
S31-n = -150n2 +5350n-21700
31 days in July
59300 tonnes - __ Algebraic Manip.. Quadratic Factorisation Schema
------~:::::::~Sum of terms
D3 1200
l->n = n/ 2(2000 + (n-1)100)
API n =no. of days Sn Formula Tn Formula 31 days in July O-------;~~i:;:t.~~~ Decrease of 100 AP2 59300 t .Erroneous Algebraic Manip
:::;;~? d = -100 ~
--:---Jl__- - ]
Figure 6. Map ofa student's solution showing that the nature of the missing link (between the number of terms of the A.P.'s) has not reduced the cognitive demand of the task.
186
Stillman
1000t
I
Sn 1 = 950n + 50n 2 ~-]
...
1100t
Sn 1 = 950x(31-n2) + 50(31-n2)2
1200t First AP
Sn1 = 950n1 + 50n1 2
n1 = no. of terms
~~'~~:------7~--""
59300=950n1+50n 12 -(31-n 1(1900+100
Sn Formula
-50(31-n1)+100)
~~a
]
Decrease of 100..,~~.....~'IO"~" Second AP
31 =26650 5 18_>31=28700
Figure 10. Map of a student's solution using Strategy D (trial and improvement).
17th July
Mathematical Processing and Cognitive Demand in Problem Solving
a = 1000 a+d=l100
~~r....-~~.
a + 2d = 1200
189
]
1000,1100, 1200 ..., 900, 800, 700
AP Decrease by 100 per day Sn = n/2[2000 + (n-l)I00]
Sn Formula
)f----~---_=:::_I.... 59300 = n/2 (1900 + lOOn)
59300t
n2+19n-1189 = 0
Algebraic Manip Quadratic FormulaeDays must be positive
....::... n = -45.22 or 26.22
Max amt trucked out on 26th July
Figure 11. Map of a student's solution using Strategy E (one A.P. model).
Increase of 100 Dayl 1000 Day 21100 Day 31200 1st sequence AP Max=x n = no. of days
0
59300 = n/ 2[2x100 +100(n-l)]
Tn Formula Sn Formula 59300t Algebraic Manip 100 trucked out per day
59300 = 396+g(-495)395 ~--+------+-------~t__-]
~=::::f=:=======~~:~~~s:u:m~of~,what
was trucked out = q(_495)395
2nd sequence GP a=q r=n-100 Sn Formula forGP
:t~===:::::::::~;::::~S~n =q(1-(396-100)396 1-396-100
Figure 12. Map of a student's solution using Strategy F (A.P./GP model).
" r::
190
Stillman
Increase of 100
On first & last day same amount transported
Decrease of 100 a= 1000 31 days in July
u--------------------.. On the 16th day maximum amt trucked out
Figure 13. Map of a student's solution using Strategy G (averaging).
Micro Level Error Classification Other factors contributing to flawed solutions were easily identified using the mapping technique and an error classification scheme developed by Chick, Watson and Collis (1987, 1988). Unsatisfactory responses can be due to responses made at inappropriate levels, incorrectly structured responses at the appropriate level and difficulties of a hierarchical nature such as not being able to carry out a procedure because of difficulty with a subordinate skilL
Structural Difficulties Structural difficulties have several causes. Students may choose inappropriate data or use data in an inappropriate way even when attempting to respond at the appropriate level for the problem. For example, in the map shown in Figure 14, the -student has used 30 days for the number of days in July. She also uses the information that lin should be positive" in an inappropriate manner. Instead of using this informationto reject a derived negative value for n she merely changes n from positive to negative. Similarly, students may use an inappropriate procedure including use of the wrong algebraic formula. This is evident in Figure 15 where the student has used an inappropriate algebraic model for the sum in the second sequence. . Omitted data is another source of error. Data essential to the development of a correct solution can be omitted in two ways. There may be no indication at all from the student's written response that they even noticed the particular piece of data or they may show that this piece of data was relevant by recording it in some way but still fail to incorporate it into their solution. Of the 52 students who used strategy E, 17 gave no evidence at all that they had noticed the decrease of 100 in the problem statement whilst a further 29 recorded this piece of data but did not use it in their final solution attempt (see Figure 11). Those students who showed no evidence of the decrease may not have noticed this piece of information. If students did notice the decrease there are two other possible explanations of why they did not record it and/or use it. Firstly, they may not have known how to incorporate it into their modeL Secondly, they may have misinterpreted the problem in a manner that did
Mnthematical Processing and Cognitive Demand in Problem Solving
191
not require the use of this piece ·of data in the model. For instance, one student thought that the entire 59300 tonnes was trucked in and then the food was eaten to account for the decrease. d = 100
T 1 = 1000 T2 =1100 T3 = 1200 First AP n is day of max amt Tn Formula Erroneous Algebraic Manip
T9=1800 day that max amt was reached
n should be positive Sn =n/2(2a+nd-d) Decrease of 100 SecondAP
30 in July Sndays =n/2(a+l) 59300 tonnes gut feeling
~~~~~~~~~~~~~;~~~~~~~~~; S30=59300
•
x
day 9 (should) be the day that max amt was reached - 1800 tonnes Figure14. Map showing use of inappropriate data (30 days) inappropriate use of data (n
should be positive) and response level conflict ("gut feeling"). ,
As well as omitting data, students can exhibit reasoning at the appropriate level but fail to draw any conclusion. In Figure IS, as well as the use of an inappropriate procedure there are further problems with algebraic skills as the student has difficulty with the quadratic formula and this leads to an omitted conclusion indicated by the square bracket. The response mapped in Figure 14 also illustrates another source of structural difficulty that Chick et al. (1988) refer to as "response level conflict" (p. 42). In this solution the student began by attempting to operate at the appropriate level but when her two attempts at verification did not confirm her result she ignored the logic of her mathematical reasoning and based her final conclusion on an intuitive feeling that her earlier result was correct.
192
Stillman
Tn Formula Increase of 100
"'~:-_-2...=2~_===3.,....,Tn= 1000+(n-l)l00
1000 1100
] x = 900+100n
1200 API max amt supplied = x Sn Formula
e-+",~-----::===",
Sn=n/2(2000+1OO(n-l))
n = max day
Sn=n/2(1900+ lOOn)
Decrease of 100 k " - - - - -......
n/2(1900 +100 n)=59300 -x+n.l00
AP2 Incorrect Algebraic Model for Sum Jr---"~--~
100n2+1900n-200n Algebraic Manip. F - - - - - - - - , A r . . - - - - - - - - - - 4 ( -118600-2x = 0 59300 tonnes 31 days in July
S31=59300
Quadratic Formula Jr-----------------------.-;...-..t n= -1900.:l:-'/19002+a.1 00.118600.2x 200
Figure 15. Map shOWing omission of a conclusion (indicated by ]) and use of inappropriate procedures (inappropriate algebraic model for the sum and incorrect quadratic formula).
Figure 16 typifies those responses which could best be described as grasping at straws. As was rev~aled in the interviews in the main study (Stillman, 1993), when students are unable to devise an overall strategy to attack a problem they often try everything they feel may be remotely appropriate in the apparent belief that if they are lucky they might just close on a potentially successful strategy or, at worst, they have done something and should receive some credit for this. They usually do use all the data at their disposal (Watson, Chick & Collis, 1988), as happened in this instance, but they have little idea how to structure this information logically or with any apparent purpose. The data are simply manipulated using what formulae or procedures have been cued by the problem context. These students often recall and record all the formulae that are appropriate for the problem as shown in Figure 16 but the connections between these formulae are tenuous at best and do not enable them to apply the formulae appropriately in problem solving situations. Chick et al. (1988) refer to this type of response as "undirected manipulation" (p.44).
193
Mathematical Processing and Cognitive Demand in Problem Solving
59300t Tn Formula Increase of 100
] n = 23.72
1000
7~/~~::::....... ]
1100
Tn = 100(9+n)
1200 S31 = 77500t moved if didn't decrease First AP 31 days in July
Sn Formula Decrease of 100
..
] Part A + Part B = 62000t
:====~~~===::::~~ S31 = 15500t moved as it decreases
Second AP a=1000
Figure 16. Map of a student's solution showing undirected manipulation.
Hierarchical Difficulties A successful solution requires the ability to apply formulae associated with , Arithmetic Progressions, however, implicit in their use are algebraic and numerical manipulation skills. There is, therefore, a hierarchy of skills headed by the overt skills of applying A.P. formulae with the subordinate but essential covert algebraic skills. In Figure 14, this student has used the overt skills effectively but had difficulty with the covert skill of solving a simple linear equation. This response would therefore be classified as demonstrating a "skills hierarchy problem" (Chick et al., 1988, p.4S).
Discussion ofResults and Implications It was possible using the response map technique to identify characteristic
response types in the written scripts and to classify them in terms of their mathematical and cognitive attributes. However, the lack of recorded detail in some of the numeric solutions prevented the use of the maps in these instances. The maps themselves provided a visual summary of the analysis of the scripts allowing comparisons such as the cognitive demand of particular strategies. However, the complexity of the maps when used with problems of this level of difficulty renders problematic their pra~tical use by classroom teachers other than as a research tool as occurred in this study. At the curriculum design level, the maps could be useful even with complex problems. For example, in Queensland the present senior syllabuses require applications tasks at various levels of complexity and the maps would provide a means of illustrating how tasks are at various levels.
194
Stillnum
With less complicated problems, it is suggested that using a task analysis map before setting a problem helps teachers determine the cognitive demand of a problem and clarifies what it is that they are expecting the students to accomplish in the task. If response maps of student solutions are drawn, remediation can also be facilitated as the maps reveal and record the precise nature of students' difficulties. The author has successfully used the maps in the classroom with Year 10 students when discussing difficulties the students faced in establishing a satisfactory representation of a less complicated problem. Watson (1994) not only illustrated the utility of the more recent version of the maps in examining classroom solutions of one of these less complicated problems but also argued for their use by classroom teachers and students and suggested ways of reducing the time required to produce them. In the specific problem used in this stud)!, the maps also revealed a large number of the difficulties students face in applying known facts and formulae in word problems of this complexity. By being made aware of the possibility for such difficulties, teachers can be more alert to them should they arise in the classroom. They can also draw students' attention to these possible sources of error and the structural and hierarchical nature of their origins. Even though some students based their solution on a small subset of the data, the majority of students in the study were able to select and record the relevant information from the problem statement (80%) and to recall and record both A.P. formulae (66%) from LTM but this was no guarantee of success. The less successful students were content to look at the surface characteristics of the problem. In contrast, the more successful problem solvers focused on the underlying structure of the relationships between the data in order to attempt to develop a meaningful representation of the problem. This observation is consistent with the findings of Lester, Garofalo and Kroll (1989) and the expert-novice studies of Chi, Glaser and Rees (1982) and of Schoenfeld and Hermann (1982). The overwhelming reason for failure on the problem was the inability of students to construct a satisfactory model of the problem situation no matter which particular global strategy was· chosen. This finding confirms much previous research (e.g., Chi, Glaser & Rees, 1982). As has been illustrated, the majority of students had great difficulty establishing crucial relationships between the data in their problem representations. The order of difficulty for establishing these relationships was only revealed after all scripts had been examined and analysed using the mapping technique. Contributing factors to an unsuccessful solution were unsatisfactory comprehension skills, inability to inhibit impulsive responses to the problem, and a lack of understanding of the mathematical concepts involved despite being able to recall formulae correctly. Solutions were further hampered by poor algebraic manipulative skills particularly those associated with the solution of quadratic equations. Again, the maps proved useful in highlighting these difficulties. Clearly, the findings of this present study have implications for both classroom practice and future research. Much greater attention must be paid to the critical need to construct a satisfactory model of the problem situation. Future research questions could include: (a) In what ways do teachers pay attention to the construction of problem representations in their everyday classroom practice? and
Mathematical Processing and Cognitive Demand in Problem Solving
(b) To what extent do teachers' place value on the satisfactory COl1Stt1.tC:ij()l'\ ~l