Journal of the Chinese Institute of Industrial Engineers, Vol. 23, No. 5, pp. 403-414 (2006)
403
AN ANT COLONY APPROACH TO THE ORIENTEERING PROBLEM Yun-Chia Liang∗ Department of Industrial Engineering and Management Yuan Ze University No 135 Yuan-Tung Road,Chung-Li Tao Yuan, 320 Taiwan, R.O.C. Alice E. Smith Department of Industrial and Systems Engineering Auburn University
ABSTRACT This paper develops an ant colony optimization approach to the orienteering problem, a general version of the well-known traveling salesman problem with many relevant applications in industry. Based on mainstream ant colony ideas, an unusual sequenced local search and a distance based penalty function are added which result in a method that is convincingly shown to be the best heuristic published for this problem class. Results on 67 test problems show that the ant colony method performs as well or better than all other methods from the literature in all cases and does so at very modest computational cost. Furthermore, the ant colony method is insensitive to seed, problem instance, problem size and degree of constraint. Keywords: ant colony, orienteering problem, traveling salesman problem, routing, optimization
1. INTRODUCTION The orienteering problem (OP) can be formulated as follows: given n nodes, each node i has a score S i ≥ 0 and the scores of the starting node denoted by 1 and the ending node denoted by n are set to 0; i.e., S1 = S n = 0 . A score can be considered as sales, customer satisfaction or any other measure of profitability. Each node can be visited at most once. A path between nodes i and j has a cost c ij associated with it. This cost can be interpreted as time, money spent or distance traveled. Usually n nodes are considered in the Euclidean plane. Since the distance and travel time between nodes are determined by the geographical measure, they are assumed as to be known quantities and the distance is used as the representative of cost in the following sections. Therefore, the objective of the OP is to maximize the score of a route (as indicated in Equation 1) that consists of a subset of nodes starting from node 1 and finishing at node n without violating the cost (time/distance) constraint Tmax (as shown in Equa-
∗
Corresponding author:
[email protected]
tion 4). The graph representation consists of a set of control nodes denoted by N and a set of arcs denoted by E representing transitions between nodes in N. Therefore, G = {N , E} is a complete graph. Generally, the mathematical model of the OP is formulated as follows: n
Max
n
∑∑ S x
(1)
i ij
i =1 j =1
Subject to n −1
n
∑
x1 j =
j =2
i =2
in
= 1,
(2)
≤ 1, k = 2,..., n − 1,
(3)
i =1
n −1
∑
∑x n −1
x ik =
∑x j =2
kj
404
Journal of the Chinese Institute of Industrial Engineers, Vol. 23, No. 5 (2006)
n
n
∑∑ c
ij x ij
≤ Tmax ,
(4)
i =1 j =1
∑x
ij
≤ S − 1, ∀S ⊂ N , S ≥ 3,
(5)
i∈S j∈S
x ij ∈ {0,1} , i,j=1,…,n
(6)
where xij is a binary decision variable that will be equal to one if the tour visits node j immediately after visiting node i; otherwise, it will be equal to zero. S denotes the set of nodes visited in a tour, and therefore is a subset of N. Equation 2 represents that each tour has to start from the starting node (node 1) and terminate at the ending node (node n). Equation 3 defines that each node except the starting and ending ones can be visited at most once. Lastly, the number of arcs in a tour should be equal to the number of nodes in S minus one. Also, any valid tour should consist of three nodes at least including the starting and ending ones. The OP is NP-hard. While it was originally modeled for the sport of orienteering, it has practical applications in vehicle routing and production scheduling, as discussed in Golden et al. [13] and Keller [16]. It should also be noted that the OP is equivalent to the Traveling Salesman Problem (TSP) when the time is relaxed just enough to cover all nodes and where start and end nodes are not specified.
2. PREVIOUS APPROACHES TO THE ORIENTEERING PROBLEM There has been work on exact methods for the OP. In Laporte and Martello [17], a linear programming (LP) relaxation of a 0-1 integer programming model within a branch-and-bound scheme is presented. The algorithm starts by relaxing the constraints, and the resulting problem is then solved through LP and the violated conditions are gradually solved through a branch-and-bound process. Upper and lower bounds are derived to fathom nodes of the search tree. Leifer and Rosenwein [19] relax the 0-1 constraints and drop the connectivity constraints. Thereafter, certain valid inequalities are added to the model. After solving the LP relaxation, a cutting plane algorithm is added and the LP is solved again. Fischetti, et al. [10] propose a branch-and-cut algorithm by adding inequalities such as the matching inequality, the cover inequality, and the path inequal-
ity. Then, the overall branch-and-cut algorithm is used to find the optimal solution. Hayes and Norman [15] are the first to use dynamic programming to solve the OP. There are no scores associated with nodes in this paper, thus, the authors define the objective as minimizing the total travel time given the constraint that the competitors must visit some prespecified control nodes. The travel time between nodes depends on distance and geographical factors, such as uphill takes more time than downhill. Ramesh, et al. [31] use Lagrange relaxation along with improvement procedures within a branch-andbound method. The solution procedure consists of two phases. In the first phase, starting with an initial set of Lagrange multipliers, the relaxed problem is solved by improving the multipliers at each iteration. If the optimal solution is found, the algorithm is terminated; otherwise, a second phase, branch-andbound search, is conducted. Although these approaches have yielded solutions to smaller sized problems, as in other NP-hard problems, the computational limitations of exact algorithms encourage the exploration of heuristic procedures. The first heuristics, the S-algorithm and the Dalgorithm, were proposed by Tsiligirides in 1984 [35]. The S-algorithm uses the Monte Carlo method to construct routes using probabilities correlated to the ratio of node score to node distance from the current node. The D-algorithm is built based upon the vehicle scheduling method proposed by Wren and Holiday [39]. This approach operates by dividing the search area into sectors that are determined by two concentric circles and an arc of known length. Sectors are varied by changing the two radii of the circles and by rotating the arcs. A route is built when all nodes in a particular sector have been visited, or it is impossible to visit any other node of the same circle without violating the Tmax constraint. In these papers, Tsiligirides also devises the most well known test problems for the OP, which have 21, 32 and 33 nodes. Golden, Levy and Vohra [13] propose an iterative heuristic for the OP which consists of three steps: route construction using a greedy method, route improvement using a 2-opt swap, and center-of-gravity which guides the next search step. Golden, Wang and Liu [14] combine Tsiligirides’s S-algorithm concept (randomness), the center of gravity, and learning capabilities into another approach to solve the OP. To provide probabilities for node selection, the score of neighboring nodes are also considered. Keller [16] uses his algorithm for the multi-objective vending problem (MVP) to solve the OP. A path construction phase uses a measure identical to that of the Salgorithm. This is followed by a three step improvement phase that uses node insertion and identification of node clusters. Wang, et al. [37] propose an artificial neural network approach to solve the OP. A
Liang and Smith: An Ant Colony Approach to the Orienteering Problem Hopfield-like neural network is formulated and a fourth order convex energy function is devised. Ramesh and Brown [30] propose a four-phase heuristic for the generalized orienteering problem, i.e., the cost function is not limited to a Euclidean function. The four phases consist of node insertion, cost improvement, node deletion and maximal insertions. The route is improved by a 2-opt procedure followed by a 3-opt procedure in the second phase. In the third phase, one node is removed from the current route and one node is then inserted in an attempt to decrease the length of the route. Finally, as many unassigned nodes as possible are inserted onto the current route in order to increase the total score. Chao, et al. [3] introduce a two-step heuristic to solve the OP. In the first step, initialization, by using the starting and ending nodes as the two foci of an ellipse and the Tmax constraint as the length of the major axis, several routes are generated and the one with the highest score is the initial solution. The initial route is then improved by a 2-node exchange in the cheapest-cost way, and then improved by a 1node improvement that tries to increase the total score. They apply this algorithm to Tsiligirides’s [35] problems and 40 new test problems. The authors also point out a mistake in Tsiligirides’s data set and suggest the correction. Tasgetiren and Smith [34] propose a genetic algorithm (GA) to solve the orienteering problem. A permutation representation is used and a penalty function is employed to help search the infeasible region. Four test sets, the three originally from Tsiligirides [35] and the one corrected by Chao, et al. [3], are used. Tasgetiren’s results are competitive to the best known heuristics, though the computational time is relatively high.
3. AN ANT COLONY APPROACH 3.1 Background of the Ant Colony method Because of the route structure and the lack of dominant heuristic for the OP, this problem class appears to be a good candidate for ant colony optimization (ACO) methods. The Ant System (AS) was first introduced by Marco Dorigo [8]. Since then, ACO algorithms have been applied to different problems such as the traveling salesman problem (TSP) [9, 27], the quadratic assignment problem (QAP) [22, 33], the generalized assignment problem [29], the vehicle routing problem [12, 20], telecommunication networks [7], graph coloring [5], scheduling [1, 4, 24], the shortest supersequence problem [25, 26], the
405
Hamiltonian graph problem [36], the multiple knapsack problem [18], the sequential ordering problem [11], the redundancy allocation problem [21], water distribution network design [23], the constraint satisfaction problem [32], and continuous function problems [2, 38]. In an ACO algorithm, after setting parameter values and initializing pheromone trails, the ant colony constructs solutions by applying a state transition rule. Local search, if applicable, and a pheromone update rule are employed during each iteration, and the process continues until a stopping criterion is reached. The ACO procedure can be summarized as follows: Set all parameters and initialize pheromone trails Loop Sub-Loop Construct routes based on the state transition rule Apply the online pheromone update rule (optional) Continue until all ants have been generated Apply local search (optional) Evaluate all solutions and record the best solution so far Apply the offline pheromone update rule Continue until the stopping criterion is reached A local heuristic, η ij , is a key component of the state transition rule. It is problem-dependent, 1 1 such as η ij = in TSP, or η ij = in a sind ij EDDij gle-machine scheduling problem. d ij Represents the distance between cities i and j, and EDDij denotes the earliest due date heuristic to schedule job j as the ith job in the sequence. Local search plays an important role in improving the solution quality of ACO algorithms. Problem-dependent local search methods are used in different applications, such as the 2-opt for the symmetric TSP and the 3-opt for the asymmetric TSP [9], the 2-opt and tabu search for the QAP [33], descent local search and tabu search for the generalized assignment problem [29], and adjacent pairwise interchange for the single machine total tardiness problem [1].
3.2 An ACO for the OP 3.2.1 Representation The orienteering problem can be translated to a Generalized Traveling Salesman Problem (GTSP) [35] in which the cities take the role of the control nodes and the number of sales in each city takes the place of the scores. Therefore, the graphic representation of the OP can easily correspond to the underlying topographical graph in the TSP. The main differ-
406
Journal of the Chinese Institute of Industrial Engineers, Vol. 23, No. 5 (2006)
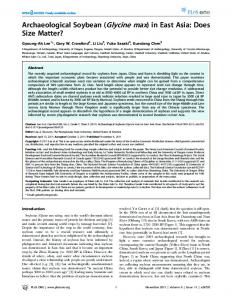
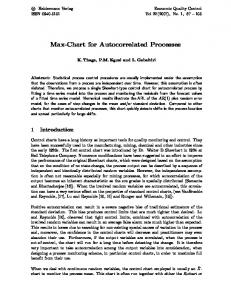
ence of the graphic representations between these two problems is that the OP does not necessarily visit all control nodes except the starting and ending ones while the TSP is required to visit all. The graph representation consists of a set of nodes denoted by N representing different control nodes, and a set of arcs denoted by E representing transitions between nodes in N. Then G = {N , E} is a graph. While constructing routes, ants move from one node to another using the connecting arcs and laying down their pheromone trails on these arcs. Thus, arcs represent adding a specific node to the tour in the OP and each arc has an associated score with it. Therefore the OP may be represented by a weighted acyclic, directed graph with exactly one starting node and one ending node. The starting node is denoted by 1 and a tour always starts from here; the ending node is denoted by n and a tour is required to end here. Given the total number of n nodes, including the starting and ending nodes, the starting node has n − 1 outgoing arcs and each arc represents a choice of an unvisited node. The ending node has n − 1 incoming arcs and no outgoing arcs. Before the tour construction starts, all nodes except the starting and ending nodes have n − 2 outgoing arcs and n − 2 incoming arcs. In each transition exactly one node is added to the tour. After a node is chosen, the rest of the incoming arcs to this specific node will be prohibited in order to satisfy the constraint that each node can be only visited at most once. During the construction process, the total distance of current tour is updated with time. Any path from the starting node to the ending node represents an initial solution for the ACO-OP algorithm. Figure 1 shows an example of the OP graphic representation with five nodes, i.e., n = 5 . Node 1 represents the starting node and the node 5 denotes the ending one. Nodes 2, 3 and 4 are the remaining control nodes. Therefore, node 1 has four outgoing arcs and no incoming arcs while node 5 has four incoming arcs and no outgoing arcs. Nodes 2, 3 and 4 each have three outgoing arcs and three incoming arcs. Figure 2 shows an example of the route construction process. This process starts from the starting node, i.e., node 1, and node 2 is selected as the next node to visit. Thereafter, all other outgoing arcs from node 1, which are represented by dashed lines, are prohibited. In next transition, node 3 is chosen, so the rest of node 2’s outgoing and incoming arcs are forbidden as shown in Figure 2(b). The final transition assumes that the ending node has to be selected, and the route construction is completed, with the path 1-2-3-5 formed.
2 4 1
3
5
Figure 1. A 5-node example of an initial OP graphic representation.
2 4 1
3
5
(a) 2 4 1
3
5
(b) 2 4 1
3
5
(c) Figure 2. Route construction process. (a) node 2 is chosen as the next node to visit, (b) node 3 is selected as the next node to visit, (c) the ending node is chosen to complete the route.
3.2.2 The state transition rule The Ant Colony System (ACS) algorithm proposed by Dorigo and Gambardella [9] is used as the main structure of the ACO-OP algorithm here. To construct a solution the ants successively choose nodes to be appended to the current tour. If the sum of current total distance at a node and the distance from this node to the ending node has reached or exceeded the constraint Tmax , the tour will be termi-
Liang and Smith: An Ant Colony Approach to the Orienteering Problem nated after connecting the path from the current node to the ending node. For node selection, the ants use problem specific (local) heuristic information, denoted by η ij , as well as pheromone trails, denoted by
τ ij , specific to an arc connecting nodes i and j. The former is an indicator of how good the choice of that node seems to be in general, and the latter indicates how good the choice of the node was during this specific search so far. In order to balance the exploitation of good solutions and the exploration of the search space, the solution construction process employs a state transition rule as follows. Node v is selected to be next node visited with the current position at node i. ⎧arg max[(τ il ) α (η il ) β ] l∈US ⎪⎪ v=⎨ ⎪ V ⎩⎪
q ≤ q0
(6) q > q0
and V is selected according to the transition probability given by ⎧ (τ iv ) α (η iv ) β ⎪ (τ il ) α (η il ) β ⎪ ⎪⎪ l∈US Piv = ⎨ ⎪ 0 ⎪ ⎪ ⎩⎪
∑
v ∈ US
(7) Otherwise
where α and β are parameters that control the relative weight of pheromone (τ) and local heuristic (η), respectively, US is the set of unvisited nodes, q is a random number uniformly generated between 0 and 1, and q 0 is a parameter which determines the relative importance of exploitation versus exploration. When q ≤ q 0 an exploitation of the knowledge available about the problem (the local heuristic knowledge about the choice of nodes) and the learned knowledge memorized in the form of pheromone trails are used, whereas q > q 0 favors more (random) exploration. The problem specific heuristic used is η ij =
3.2.3 The pheromone trail update rule The pheromone update rule consists of two phases – online (step-by-step) updating and offline (delayed) updating. The purpose of online updating is to decay the pheromone intensity of the selected move to encourage exploration. Online updating occurs after an ant makes a move by
τ ijnew = ρ ⋅τ ijold + (1 − ρ ) ⋅τ o
(8)
where ρ ∈ [0,1] is a parameter that controls the pheromone persistence, i.e., 1 − ρ represents the proportion of the pheromone evaporated. Initial trail 1 where n is the intensities ( τ 0 ) are set to n ⋅ Tmax total number of nodes and Tmax is the distance constraint. After all ants have followed the selection process described above and constructed a tour, local search (as described in the next section) is used to improve the solutions. The objective function (1) for each ant, k, is calculated, as is the degree of infeasibility, Tk - Tmax. Most ACO algorithms avoid infeasible solutions during the process of solution construction by means of, for example, a tabu list in the TSP application. However, Ramalhinho and Serra [29] suggest that a penalty function can be used in the objective function evaluation. For a solution violating a constraint, a penalty is added to the objective, and during pheromone updating, infeasible ants contribute less. Since the OP is a constrained problem and search can benefit from considering mildly infeasible solutions, a penalty function for infeasible solutions is used: S kp = S k ⋅
Tmax Tk
(9)
where Tk and Sk are the total distance and the total score of ant k, respectively. If a solution is feasible, S kp = S k ; if a solution falls in the infeasible region,
Sj
the penalized total score, S kp , is calculated by multi-
c ij
plying the unpenalized objective, S k , with a penalty T factor max that correlates with the magnitude of Tk infeasibility. This penalty function will encourage the ACO-OP algorithm to explore the feasible region and infeasible region near the border of the feasible area, and discourage, but permit, search further into the infeasible region, since the global optimum solu-
where S j represents the associated score of node j and c ij denotes the distance associated with the path between nodes i and j.
407
408
Journal of the Chinese Institute of Industrial Engineers, Vol. 23, No. 5 (2006)
tion is close to or at Tmax . Then, the best feasible solution is updated and is used to contribute pheromone in offline updating. At the same time evaporation reduces pheromone trails. The offline trail update can formally be expressed as follows:
τ ijnew = ρ ⋅τ ijold + (1 − ρ ) ⋅ Δτ ij
(10)
where Δτ ij is the amount of pheromone trail added to τ ij by the ants. This paper uses the elitist approach [9] where only the best ant contributes, i.e., Δτ ij = S B for all combinations (i,j) belonging to the best feasible solution found so far, where S B is the total score of that solution.
3.2.4 The local search Since the solutions generated in each generation before local search are either on or close to the border of the feasible region, local search is very effective in this problem class. The Variable Neighborhood Descent (VND) metaheuristic [28] provides an appropriate idea for local search. VND does not follow a specified trajectory, but explores increasingly distant neighborhoods of the current solution, and jumps to a new one if, and only if, an improvement is made. A VND algorithm starts by determining a set of neighborhood structures, i.e., a set of local search methods. Beginning with a neighborhood of the set, i.e., using one of the local search methods, local search is applied and if the solution obtained is better than the incumbent, it replaces the old one and the search continues from there. The VND algorithm continues until all neighborhoods defined have been searched, that is, all local search methods used. den Besten, et al. used a similar idea with an ACO approach to a class of scheduling problems [6]. In the ACO-OP method, the concatenation of several iterative descent local search methods are used as the VND: • •
• •
Eliminate method (ELM): Eliminates a node from the tour except the starting and the ending nodes. Interchange method (INT): Interchanges a node on a tour (except the starting and the ending nodes) with an unvisited node if there is any existing. Swap method (SWAP): Swaps a pair of nodes existing on a tour, except the starting and the ending nodes. Forward Insert method (FI): Takes a node from its current position and inserts it into a position
• •
after its current one but before the ending node. Backward Insert method (BI): Takes a node from its current position and inserts it into a position before its current one but after the starting node. Add method (ADD): Adds an unvisited node, if it exists, to a position between the starting node and the ending node of the current tour.
During the local search, if the penalized total score improves or the total distance decreases, the new tour replaces the current solution. This sequence of local search mechanisms can be segregated into three parts: INT-ELM, FI-BI-SWAP and ADD. The first part aims at reducing the magnitude of infeasibility and increasing the total score, the second part tries to decrease the total distance, and the last part of sequence is mainly responsible for increasing the total score of a tour. The iteration-best feasible ant is updated during the local search process above and if it is better than the globally best feasible ant, the globally best feasible ant is updated and another concatenated local search is applied to the new globally best feasible solution by the sequence of INT-ADD-FI-BISWAP. ELM is not used since this ant is, by definition, feasible.
4. COMPUTATIONAL EXPERIENCE The ACO-OP algorithm is coded in Borland C++ and all experiments are run using an Intel Celeron 433 MHz PC with 128 MB RAM. All computations use real float point precision without rounding or truncating values. The length of the final path and the CPU time (in seconds) are rounded to three digits behind the decimal point. From preliminary exploration, these parameter values are established: colony size (i.e., number of ants) = 30, α = 1 , β = 3 , q 0 = 0.2 and ρ = 0.9. There is some sensitivity of ACO-OP to changes in these parameters, particularly values of qo greater than 0.7. With β > α and a lower qo there is more emphasis on the local heuristic as opposed to the pheromone and more emphasis on exploration rather than exploitation. The stopping criteria are when the total number of iterations reaches 200, the best ant has not changed for 100 consecutive iterations or the best feasible ant has reached the upper bound provided by [19]. The test problems are those most studied in the literature [3, 35]. These are three sets of size 32, 21, and 33 nodes with 18, 11, and 20 instances, varying by Tmax value, respectively. Chao et al. [3] found a mistake in the original data set of the size 32 problem, corrected the mistake and created a new data set, named data set 4, which is different from the old set at node 30. The search spaces
Liang and Smith: An Ant Colony Approach to the Orienteering Problem are 1.2 × 10¹⁷ for the 21 node, 2.7 x 1032 for the 32 node and 8.2 x 1033 for the 33 node problems. The best results of the ACO-OP algorithm over 10 runs on each instance are compared with the best results of the other heuristics and the upper bound [19] as follows: • • • • • • • • •
UB: upper bound on score from Leifer and Rosenwein [19] (for data sets 1, 2 and 3 only). T: Tsiligirides’ S-algorithm [35] (for data sets 2, 3 and 4 only). TC: Tsiligirides’ S-algorithm coded by Chao et al. [3] (for data sets 1 and 4 only). MVP: Keller heuristic [16] (for data sets 1, 2 and 3 only). GLV: Golden, Levy, and Vohra heuristic [13] (for data sets 1, 2 and 3 only). GWL: Golden, Wang, and Liu heuristic [14] (for data sets 1, 2 and 3 only). ANN: Wang, Sun, Golden and Jia’s neural network [37]. CGW: Chao, Golden, and Wasil heuristic [3]. GA: Tasgetiren and Smith’s genetic algorithm [34].
In Tables 1 through 4, the “+” symbol means that ACO-OP produces a better score, the “–” symbol means that ACO-OP produces a worse score, and an empty cell means ACO-OP generates the same score as the comparing heuristic. For the 49 instances listed in Tables 1 through 3, ACO-OP produces better scores in 10 instances compared to the ones produced by MVP, in 26 instances by GLV, and in 1 instance by GWL. In Tables 2, 3 and 4, ACO-OP performs better in 34 instances compared to the ones produced by T. ACOOP also outperforms TC in 19 of 49 instances in Tables 1 and 4. Over all 67 instances, ACO-OP is superior in 7 instances compared to ANN, in 1 instance for CGW, and in 1 instance for GA. The most competitive heuristics are CGW and GA, which are improved upon by ACO-OP in only one instance each. Note that in no case does ACO-OP fail to find the best known solution. It is difficult to make a solid computational comparison. CPU seconds will vary according to hardware, software and coding. The CGW heuristic [3] and the GA [34] are used here for CPU runtime
409
comparison purposes since they are the primary competitors when considering performance. CGW is coded in FORTRAN and executed on a SUN 4/370 workstation and GA is coded in Borland C++ and run on a Dell 450 PC. In Tables 5 through 8, CPU time in seconds for CGW, GA and ACO-OP are given, with the quickest method highlighted in gray. The CPU time of ACO-OP is the mean time over thoseruns reaching the best solution and ranges from 0.011 seconds to 25.274 seconds. The mean CPU time of ACO-OP is lower than one second in over half of the 67 instances, is lower than CGW in all but 3 of the 67 instances and is considerably faster than GA in all instances. Tables 5 through 8 also show the best tour generated by ACO-OP, the T value of the tour, and the maximum, mean and standard deviation over the ten runs. In most instances, the ACO-OP found the optimum in each of the ten runs and in no case was the worst performance very bad.
5. CONCLUSIONS This paper presented the first known application of an ant colony optimization method to the orienteering problem. The OP problem has many important parallels in problems found in industry, along with its original inspiration of the sport of orienteering. An ACO that uses both on line and off line pheromone updating and employs local search each iteration is effective and efficient. The local search is atypical in that it involves a sequence of simple heuristics rather than either a single heuristic or a rotating choice of heuristics. This variable neighborhood concept may be of value in other ACO implementations. Computational experience shows that the ACO approach is dominant to all published heuristics in quality of solution obtained and is modest indeed in its computational requirements. Furthermore, sensitivity to seed is small and robustness to problem instance, size and degree of constraint is great. In summary, as in other path based problems such as network routing and TSP, ACO clearly shows its merit in the orienteering problem.
410
Journal of the Chinese Institute of Industrial Engineers, Vol. 23, No. 5 (2006) Table 1. Comparison of results on test problem set 1 (32 nodes and 18 instances). ACO-OP vs. Previous Heuristic Methods Heuristic Methods from Literature T MAX UB TC MVP GLV GWL ANN CGW GA ACO-OP TC MVP GLV GWL ANN CGW GA 10 10 10 10 10 10 10 10 10 5 20 15 15 15 15 15 15 15 15 10 45 45 45 45 45 45 45 45 45 15 70 65 65 65 65 65 65 65 65 20 95 90 90 90 90 90 90 90 90 25 110 110 110 110 110 110 110 30 120 110 130 125 135 135 135 135 135 + + 35 140 135 155 140 155 155 155 155 155 + + 40 160 150 175 165 175 175 175 175 175 + + 46 180 170 185 180 190 190 190 190 190 + + + 50 195 185 200 200 205 205 205 205 205 + + + 55 210 195 225 205 225 225 225 225 225 + + 60 230 220 240 220 240 240 240 240 240 + + 65 245 235 260 240 260 260 260 260 260 + + 70 260 255 265 255 265 265 265 265 265 + + 73 270 260 270 260 270 270 270 270 270 + + 75 270 265 280 275 280 280 280 280 280 + + 80 285 270 285 285 285 285 285 285 285 + 85 285 280 + 11 3 11 0 0 0 0 Summary of ACO-OP vs. Previous Heuristic Methods - 0 0 0 0 0 0 0
Table 2. Comparison of results on test problem set 2 (21 nodes and 11 instances). T M AX UB 15 145 20 200 23 215 25 240 27 265 30 275 32 305 35 350 38 375 40 400 45 450 Summary of
ACO-OP vs. Previous Heuristic M ethods Heuristic M ethods from Literature T M VP GLV GW L ANN CGW GA ACO-OP T M VP GLV GW L ANN CGW GA 120 120 120 120 120 120 120 120 190 200 200 200 200 200 200 200 + 205 210 210 205 205 210 210 210 + + + 230 230 230 230 230 230 230 230 230 230 230 230 230 230 230 230 250 260 260 265 265 265 265 265 + + + 275 300 260 300 300 300 300 300 + + 315 320 300 320 320 320 320 320 + + 355 360 355 360 360 360 360 360 + + 395 380 380 395 395 395 395 395 + + 430 450 450 450 450 450 450 450 + ACO-OP vs. Previous Heuristic M ethods + 7 2 5 1 1 0 0 - 0 0 0 0 0 0 0
Table 3. Comparison of results on test problem set 3 (33 nodes and 20 instances). T MAX UB 15 175 20 210 25 290 30 340 35 395 40 445 45 490 50 535 55 575 60 605 65 635 70 665 75 695 80 725 85 750 90 785 95 800 100 800 105 800 110 800 Summary of
ACO-OP vs. Previous Heuristic Methods Heuristic Methods from Literature T MVP GLV GWL ANN CGW GA ACO-OP T MVP GLV GWL ANN CGW GA 100 170 170 170 170 170 170 170 + 140 200 200 200 200 200 200 200 + 190 260 250 260 250 260 260 260 + + + 240 320 320 320 320 320 320 320 + 290 370 380 390 390 390 390 390 + + + 330 430 420 430 420 430 430 430 + + + 370 460 450 470 470 470 470 470 + + + 410 520 500 520 520 520 520 520 + + 450 550 520 550 550 550 550 550 + + 500 570 580 580 580 580 580 580 + + 530 610 600 610 610 610 610 610 + + 560 640 640 640 640 640 640 640 + 590 670 650 670 670 670 670 670 + + 640 700 690 710 700 710 710 710 + + + + 670 740 720 740 740 740 740 740 + + 690 760 770 770 770 770 770 770 + + 720 790 790 790 790 790 790 790 + 760 800 800 800 800 800 800 800 + 770 800 800 800 800 800 800 800 + 790 800 800 800 800 800 800 800 + + 20 5 10 0 3 0 0 ACO-OP vs. Previous Heuristic Methods - 0 0 0 0 0 0 0
Liang and Smith: An Ant Colony Approach to the Orienteering Problem
411
Table 4. Comparison of results on test problem set 4 (32 nodes and 18 instances, corrected). Heuristic Methods from Literature TMAX T TC ANN CGW 10 10 10 10 5 15 15 15 15 10 45 45 45 45 15 65 65 65 65 20 90 85 90 90 25 110 110 110 110 30 135 135 130 135 35 150 150 155 155 40 175 175 175 175 46 190 185 190 190 50 205 200 205 205 55 220 220 220 220 60 240 240 240 240 65 255 250 260 260 70 260 265 265 265 73 270 265 270 275 75 275 270 280 280 80 280 285 285 285 85 Summary of ACO-OP vs. Previous Heuristic Methods
GA 10 15 45 65 90 110 135 155 175 190 205 225 240 260 265 270 280 285
ACO-OP 10 15 45 65 90 110 135 155 175 190 205 225 240 260 265 275 280 285 + -
ACO-OP vs. Previous Heuristic Methods T TC ANN CGW GA
+ + +
+
+
+ + +
+ + + + + 7 0
+
+
+ + +
+
8 0
3 0
+
1 0
1 0
Table 5. CPU time comparison and sequence found by the ACO-OP for problem set 1. TMAX 5 10 15 20 25 30 35 40 46 50 55 60 65 70 73 75 80 85
CPU Time Score CGW GA ACO-OP Max Min Avg 0.67 5.36 0.013 10 10 10 0.80 10.28 0.011 15 15 15 2.28 14.98 0.207 45 35 43 17.49 20.47 0.064 65 65 65 9.07 25.89 0.733 90 85 89.5 31.92 31.36 0.080 110 110 110 25.25 38.48 0.808 135 135 135 16.76 42.06 6.227 155 155 155 21.58 48.68 0.677 175 175 175 24.91 58.94 0.795 190 190 190 24.67 60.39 15.732 205 200 203.5 24.28 65.55 11.464 225 220 223.5 23.26 69.56 0.495 240 240 240 25.09 73.56 11.781 260 260 260 25.24 75.29 1.352 265 265 265 28.53 77.72 4.075 270 270 270 26.84 80.58 3.738 280 280 280 21.71 88.12 2.739 285 285 285
SD 0.0000 0.0000 4.2164 0.0000 1.5811 0.0000 0.0000 0.0000 0.0000 0.0000 2.4152 2.4152 0.0000 0.0000 0.0000 0.0000 0.0000 0.0000
Td 4.143 6.867 14.264 19.595 24.816 29.711 34.081 38.974 44.512 49.534 54.797 59.888 63.822 69.127 70.731 73.507 78.720 81.784
ACO-OP Tour 1 28 32 1 28 18 32 1 27 31 26 20 19 32 1 27 31 26 22 21 20 19 32 1 27 31 26 22 21 12 11 10 9 32 1 27 31 26 25 24 23 22 21 12 19 32 1 28 27 31 26 25 23 22 21 12 11 10 8 9 13 32 1 28 27 31 26 25 23 22 21 12 11 10 8 2 3 7 6 32 1 28 27 31 26 25 24 23 22 21 12 11 10 9 8 2 3 7 6 32 1 28 27 31 26 25 24 23 22 21 12 11 10 9 8 2 3 7 5 6 13 32 1 28 27 31 26 25 23 22 21 12 11 10 8 2 3 7 6 5 4 14 15 18 32 1 27 31 26 25 23 22 21 12 11 10 8 2 3 7 6 5 4 14 15 16 17 28 32 1 27 31 26 25 24 23 22 21 12 11 10 8 2 3 7 6 5 4 14 15 16 17 28 32 1 28 29 17 16 15 14 4 5 6 7 3 2 8 10 11 12 21 22 23 24 25 26 31 27 20 19 32 1 28 29 17 16 15 14 4 5 6 7 3 2 8 9 10 11 12 21 22 23 24 25 26 31 27 20 19 32 1 28 29 17 16 15 14 4 5 6 7 3 2 8 10 11 12 21 22 23 24 25 30 31 26 27 20 19 32 1 28 29 17 16 15 14 4 5 6 13 7 3 2 8 9 10 11 12 21 22 23 24 25 30 31 26 27 20 19 32 1 19 20 27 26 31 30 25 24 23 22 21 12 11 10 9 8 2 3 7 13 6 5 4 14 15 16 17 29 28 18 32
Table 6. CPU time comparison and sequence found by the ACO-OP for problem set 2. TMAX CGW 15 1.29 20 2.24 23 4.45 25 5.65 27 6.37 30 6.18 32 7.21 35 7.81 38 6.84 40 7.14 45 0.61
CPU Time Score GA ACO-OP Max Min Avg 11.53 0.023 120 120 120 15.35 0.402 200 200 200 19.04 0.685 210 200 206.5 20.53 0.111 230 230 230 22.63 0.152 230 230 230 23.9 0.172 265 250 259.5 26 0.561 300 300 300 27.74 1.344 320 310 312 28.74 2.797 360 355 356.5 28.71 3.818 395 385 394 29.01 0.731 450 450 450
SD 0.0000 0.0000 4.7434 0.0000 0.0000 3.6893 0.0000 4.2164 2.4152 3.1623 0.0000
Td 14.543 19.88 22.648 24.128 24.895 29.849 31.625 34.989 37.842 39.778 44.438
ACO-OP Tour 1 7 12 11 8 9 10 14 21 1 12 7 6 5 3 2 8 9 10 11 13 14 21 1 7 6 5 4 3 2 8 9 10 11 14 21 1 12 7 6 5 4 3 2 8 9 10 11 13 14 21 1 11 10 9 8 2 3 4 5 6 7 12 13 14 21 1 7 6 2 8 17 16 15 9 10 11 13 14 21 1 7 6 5 3 2 8 17 16 15 9 10 11 13 14 21 1 7 6 5 4 20 19 18 17 8 9 10 11 13 14 21 1 7 6 5 2 3 4 20 19 18 17 8 9 10 11 13 14 21 1 7 6 5 3 4 20 19 18 16 15 17 8 9 10 11 13 21 1 12 7 6 5 2 3 4 20 19 18 16 15 17 8 9 10 11 13 14 21
412
Journal of the Chinese Institute of Industrial Engineers, Vol. 23, No. 5 (2006) Table 7. CPU time comparison and sequence found by the ACO-OP for problem set 3. CPU Time GA ACO-OP 25.30 0.036 31.87 2.194 39.38 0.209 44.05 0.465 47.68 0.164 52.36 0.711 66.89 2.223 72.78 1.528 75.40 5.377 79.01 0.402 79.20 18.369 84.69 12.888 90.24 0.934 100.42 9.406 103.64 14.800 103.91 12.106 106.47 1.491 105.55 2.105 103.01 0.550 102.27 0.403
Max 170 200 260 320 390 430 470 520 550 580 610 640 670 710 740 770 790 800 800 800
Score Min Avg 170 170 190 199 260 260 310 319 390 390 430 430 470 470 520 520 550 550 580 580 600 603 640 640 670 670 710 710 740 740 760 769 790 790 800 800 800 800 800 800
TMAX 15 20 25 30 35 40 45 50 55 60 65 70 75 80 85 90 95 100 105 110
CGW 4.37 5.16 9.40 9.96 15.38 18.65 26.84 28.74 30.27 27.68 25.02 29.82 29.25 30.14 28.30 24.43 22.33 0.67 0.60 0.72
SD 0.0000 3.1623 0.0000 3.1623 0.0000 0.0000 0.0000 0.0000 0.0000 0.0000 4.8304 0.0000 0.0000 0.0000 0.0000 3.1623 0.0000 0.0000 0.0000 0.0000
TMAX 5 10 15 20 25 30 35 40 46 50 55 60 65 70 73 75 80 85
CPU Time Score CGW GA ACO-OP Max Min Avg 0.22 6 0.014 10 10 10 0.27 10.87 0.013 15 15 15 0.72 16.98 0.752 45 45 45 4.76 23.42 0.056 65 65 65 2.47 29.42 0.119 90 90 90 10.86 35.64 0.081 110 110 110 14.11 44.57 1.239 135 135 135 21.81 50.51 6.443 155 150 154.5 21.62 55.58 0.323 175 175 175 22.76 71.78 0.414 190 190 190 24.81 90.31 5.902 205 200 203.5 20.39 90.74 11.229 225 220 224 26.78 96.45 0.811 240 240 240 25.51 85.44 8.163 260 260 260 27.04 85.16 2.158 265 265 265 27.47 89.59 25.274 275 270 272 28.17 90.12 5.067 280 280 280 21.64 87.77 8.005 285 285 285
Td ACO-OP Tour 14.573 1 24 22 7 5 28 14 4 23 33 19.792 1 24 22 7 5 28 14 4 3 27 23 33 24.458 1 24 22 7 5 14 4 20 13 3 23 33 28.770 1 24 22 7 5 28 20 17 13 3 4 14 27 23 33 34.791 1 24 22 7 5 28 14 4 20 17 16 15 13 3 23 33 38.881 1 24 22 7 5 28 14 4 20 17 16 15 13 3 6 2 32 33 44.259 1 24 22 7 5 28 14 4 20 17 16 15 13 3 6 2 8 29 26 33 48.936 1 24 22 7 5 28 14 4 20 17 16 15 13 3 6 2 8 31 12 29 26 33 53.546 1 24 22 7 5 28 14 4 20 17 16 15 13 3 6 2 8 31 12 29 30 26 32 33 59.341 1 24 22 7 5 28 14 4 20 17 21 16 15 13 3 6 2 8 31 12 29 30 33 63.236 1 24 22 7 5 28 14 4 20 17 21 16 15 13 3 6 2 8 31 12 29 30 26 32 23 33 69.139 1 24 22 7 5 28 14 4 20 17 16 15 13 3 6 2 8 31 12 11 10 9 30 29 26 32 33 74.227 1 24 22 7 5 28 14 4 20 17 16 15 13 3 6 2 8 31 12 11 19 18 10 9 25 33 79.710 1 24 22 7 5 28 14 4 20 17 16 15 13 3 6 2 8 31 12 29 30 11 19 18 10 9 25 33 84.862 1 24 22 7 5 28 14 4 20 17 16 15 13 3 6 2 8 31 12 11 19 18 10 9 30 29 26 32 23 27 33 89.313 1 24 22 7 5 28 14 4 20 17 21 16 15 13 3 6 2 8 31 12 11 19 18 10 9 30 29 26 32 33 92.791 1 24 23 27 22 7 5 28 14 4 20 17 21 16 15 13 3 6 2 8 31 12 11 19 18 10 9 30 29 26 32 33 97.078 1 24 23 27 22 7 5 28 14 4 20 17 21 16 15 13 3 6 2 8 31 12 11 19 18 10 9 25 30 29 26 32 33 97.240 1 24 22 7 5 28 14 4 20 17 21 16 15 13 3 6 2 8 31 12 11 19 18 10 9 25 30 29 26 32 23 27 33 97.078 1 24 23 27 22 7 5 28 14 4 20 17 21 16 15 13 3 6 2 8 31 12 11 19 18 10 9 25 30 29 26 32 33
Table 8. CPU time comparison and sequence found by the ACO-OP for problem set 4. SD 0.0000 0.0000 0.0000 0.0000 0.0000 0.0000 0.0000 1.5811 0.0000 0.0000 2.4152 2.1081 0.0000 0.0000 0.0000 2.5821 0.0000 0.0000
Td 4.143 6.867 14.264 19.686 24.816 28.797 34.081 38.974 44.512 49.776 54.797 59.888 64.311 69.127 71.867 74.661 77.725 81.482
ACO-OP Tour 1 28 32 1 28 18 32 1 27 31 26 20 19 32 1 27 31 26 20 21 12 19 32 1 27 31 26 22 21 12 11 10 9 32 1 28 27 31 26 22 21 12 11 10 8 9 13 32 1 28 27 31 26 25 23 22 21 12 11 10 8 9 13 32 1 28 27 31 26 25 23 22 21 12 11 10 8 2 3 7 6 32 1 28 27 31 26 25 24 23 22 21 12 11 10 9 8 2 3 7 6 32 1 28 27 31 26 25 24 23 22 21 12 11 10 9 8 2 3 4 5 6 32 1 28 27 31 26 25 23 22 21 12 11 10 8 2 3 7 6 5 4 14 15 18 32 1 27 31 26 25 23 22 21 12 11 10 8 2 3 7 6 5 4 14 15 16 17 28 32 1 28 17 16 15 14 4 5 7 3 2 8 10 11 12 21 22 23 24 25 26 31 27 19 32 1 28 29 17 16 15 14 4 5 6 7 3 2 8 10 11 12 21 22 23 24 25 26 31 27 20 19 32 1 28 30 29 17 16 15 14 4 5 7 3 2 8 10 11 12 21 22 23 24 25 26 31 27 20 19 32 1 28 30 29 17 16 15 14 4 5 6 7 3 2 8 9 10 11 12 21 22 23 24 25 26 31 27 20 19 32 1 19 20 27 31 26 25 24 23 22 21 12 11 10 9 8 2 3 7 6 5 4 14 15 16 17 29 30 28 18 32 1 19 20 27 31 26 25 24 23 22 21 12 11 10 8 9 13 2 3 7 6 5 4 14 15 16 17 29 30 28 18 32
Colony Optimization for the Total Weighted Tardiness Problem,” Proceedings of the 6th International Conference on Parallel Problem Solving from Nature (PPSN VI), LNCS 1917, Berlin, 611-620 (2000).
REFERENCES 1.
Bauer, A., B. Bullnheimer, R. F. Hartl, and C. Strauss, “Minimizing Total Tardiness on a Single Machine Using Ant Colony Optimization,” Central European Journal of Operations Research, 8(2), 125-141 (2000).
7.
Di Caro, G. and M. Dorigo, “Ant Colonies for Adaptive Routing in Packet-Switched Communication Networks,” Proceedings of the 5th International Conference on Parallel Problem Solving from Nature (PPSN V), Amsterdam, The Netherlands, 673-682 (1998).
8.
Chao, I. M., B. L. Golden, and E. A. Wasil, “A Fast and Effective Heuristic for the Orienteering,” European Journal of Operational Research, 88, 475-489 (1996).
Dorigo, M., Optimization, Learning and Natural Algorithms, Ph.D. Thesis, Politecnico di Milano, Italy (1992).
9.
Colorni, A., M. Dorigo, V. Maniezzo, and M. Trubian, “Ant System for Job-Shop Scheduling,” Belgian Journal of Operations Research, Statistics and Computer Science (JORBEL), 34(1), 39-53 (1994).
Dorigo, M. and L. M. Gambardella, “Ant Colony System: A Cooperative Learning Approach to the Travelling Salesman Problem,” IEEE Transactions on Evolutionary Computation, 1(1), 53-66 (1997).
10.
5.
Costa, D. and A. Hertz, “Ants Can Colour Graphs,” Journal of the Operational Research Society, 48, 295-305 (1997).
Fischetti, M., J. J. S. Gonzalez, and P. Toth, “Solving the Orienteering Problem through Branch-and-Cut,” INFORMS Journal on Computing, 10(2), 133-148 (1998).
11.
6.
Den Besten, M., T. Stützle, and M. Dorigo, “Ant
Gambardella, L. M. and M. Dorigo, “An Ant Colony System Hybridized with a New Local Search for the Sequential Ordering Problem,” INFORMS Journal on Computing, 12(3), 237-255 (2000).
2.
3.
4.
Bilchev, G. and I. C. Parmee, “The Ant Colony Meta phor for Searching Continuous Design Spaces,” in T. Fogarty (ed.), Lecture Notes in Computer Science, 993, Springer Verlag, 25-39 (1995).
Liang and Smith: An Ant Colony Approach to the Orienteering Problem 12.
Gambardella, L. M., E. Taillard, and G. Agazzi, “MACS-VRPTW A Multiple Ant Colony System for Vehicle Routing Problems with Time Windows,” in D. Corne, M. Dorigo and F. Glover (eds.), New Ideas in Optimization, McGraw-Hill, 63-76 (1999).
413
692-701 (1998). 26.
Michels, R. and M. Middendorf, “An Ant System for the Shortest Common Supersequence Problem,” in D. Corne, M. Dorigo and F. Glover (eds.), New Ideas in Optimization, McGraw-Hill, 51-61 (1999).
13.
Golden, B. L., L. Levy, and R. Vohra, “The Orienteering Problem,” Naval Research Logistics, 34, 307318 (1987).
27.
Middendorf, M., F. Reischle, and H. Schmeck, “Multi Colony Ant Algorithms,” Journal of Heuristics, 8(3), 305-320 (2002).
14.
Golden, B. L., Q. Wang, and L. Liu, “A Multifaceted Heuristic for The Orienteering Problem,” Naval Research Logistics, 35, 359-366 (1988).
28.
Mladenovic, N. and P. Hansen, “Variable Neighborhood Search,” Computers and Operations Research, 24(11), 1097-1100 (1997).
15.
Hayes, M. and J. M. Norman, “Dynamic Programming in Orienteering: Route Choice and the Siting of Controls,” Journal of the Operational Research Society, 35(9), 791-796 (1984).
29.
Ramalhinho, H. and D. Serra, “Adaptive Approach Heuristics for the Generalized Assignment Problem,” Economic Working Paper 288, Universitat Pompeu Fabra, Spain (1998).
16.
Keller, P. C., “Algorithms to Solve the Orienteering Problem: A Comparison,” European Journal of Operational Research, 41, 224-231 (1989).
30.
17.
Laporte, G. and S. Martello, “The Selective Traveling Salesman Problem,” Discrete Applied Mathematics, 26, 193-207 (1990).
Ramesh, R. and K. M. Brown, “An Efficient FourPhase Heuristic for the Generalized Orienteering Problem,” Computers and Operations Research, 18(2), 151-165 (1991).
31.
Ramesh, R., Y. S. Yoon, and M. H. Karwan, “An Optimal Algorithm for the Orienteering Tour Problem,” ORSA Journal on Computing, 4(2), 155-165 (1992).
32.
Schoofs, L. and B. Naudts, “Ant Colonies are Good at Solving Constraint Satisfaction Problems,” Proceedings of the 2000 Congress on Evolutionary Computation, San Diego, CA, 1190-1195 (2000).
33.
Stützle, T. and M. Dorigo, “ACO Algorithms for the Quadratic Assignment Problem,” in D. Corne, M. Dorigo and F. Glover (eds.), New Ideas in Optimization, McGraw-Hill, 33-50 (1999).
34.
Tasgetiren, M. F. and A. E. Smith, “A Genetic Algorithm for the Orienteering Problem,” Proceedings of the 2000 Congress on Evolutionary Computation, San Diego, CA, 1190-1195 (2000).
35.
Tsiligirides, T., “Heuristic Methods Applied to Orienteering,” Journal of Operational Research Society, 35(9), 797-809 (1984).
36.
Wagner, I. A. and A. M. Bruckstein, “Hamiltonian(t)An Ant Inspired Heuristic for Recognizing Hamiltonian Graphs,” Proceedings of the 1999 Congress on Evolutionary Computation, Washington, D.C., 14651469 (1999).
37.
Wang, Q., X. Sun, B. L. Golden, and J. Jia, “Using Artificial Neural Networks to Solve the Orienteering Problem,” Annals of Operations Research, 61, 111120 (1995).
38.
Wodrich, M. and G. Bilchev, “Cooperative Distributed Search: The Ants’ Way,” Journal of Control and Cybernetics, 26(3), 413-446 (1997).
39.
Wren, A. and A. Holiday, “Computer Scheduling of Vehicles from One or More Depots to a Number of Delivery Points,” Operations Research Quarterly, 23, 333-344 (1972).
18.
19.
20.
21.
Leguizamon, G. and Z. Michalewicz, “A New Version of Ant System for Subset Problems,” Proceedings of the 1999 Congress on Evolutionary Computation, Washington, D.C., 1459-1464 (1999). Leifer, A. C. and M. B. Rosenwein, “Strong Linear Programming Relaxations for the Orienteering Problem,” European Journal of Operational Research, 73, 517-523 (1993). Liang, Y.-C., M.-H. Lo, and A. H. L. Chen, “An Ant Colony Approach for the Vehicle Routing Problem under Distance and Capacity Constraints,” Proceedings of the 8th Annual International Conference on Industrial Engineering – Theory, Applications and Practice (IJIE2003), Las Vegas, Nevada, 600-605 (2003). Liang, Y.-C. and A. E. Smith, “An Ant Colony Optimization Algorithm for the Redundancy Allocation Problem (RAP),” IEEE Transactions on Reliability, 53(3), 417-423 (2004).
22.
Maniezzo, V. and A. Colorni, “The Ant System Applied to the Quadratic Assignment Problem,” IEEE Transactions on Knowledge and Data Engineering, 11(5), 769-778 (1999).
23.
Mariano, C. E. and E. Morales, “MOAQ an Ant-Q Algorithm for Multiple Objective Optimization Problems,” Proceedings of the Genetic and Evolutionary Computation Conference, Orlando, Florida, 1, 894901 (1999).
24.
25.
Merkle, D. and M. Middendorf, “On Solving Permutation Scheduling Problems with Ant Colony Optimization,” International Journal of Systems Science, 36(5), 255-266 (2005). Michels, R. and M. Middendorf, “An Island Model Based Ant System with Lookahead for the Shortest Supersequence Problem,” Proceedings of the 5th International Conference on Parallel Problem Solving from Nature (PPSN V), Amsterdam, The Netherlands,
414
Journal of the Chinese Institute of Industrial Engineers, Vol. 23, No. 5 (2006)
ABOUT THE AUTHORS Yun-Chia Liang is currently an Associate Professor in the Department of Industrial Engineering and Management at Yuan Ze University, Taiwan, R.O.C. Dr. Liang received his first M.S. (Mechanical Engineering, 1996) from Carnegie Mellon University, a second M.S. (Industrial Engineering, 1999) from University of Pittsburgh, and the Ph.D. in Industrial and Systems Engineering from Auburn University (2001). His research interest includes meta-heuristics, production scheduling, reliability engineering, and global logistics. Alice E. Smith is Professor and Chair of the Industrial and Systems Engineering Department at Auburn University. Dr. Smith has degrees in engineering and business from Rice University, Saint Louis University and University of Missouri - Rolla. Her research in analysis, modeling and optimization of manufacturing processes and engineering design has been funded by NASA, the National Institute of Standards
(NIST), Lockheed Martin, Adtranz (now Bombardier Transportation), the Ben Franklin Technology Center of Western Pennsylvania and the National Science Foundation (NSF), from which she was awarded a CAREER grant in 1995 and an ADVANCE Leadership grant in 2001. Dr. Smith holds one U.S. patent and several international patents and has authored over 50 publications in journals including articles in IIE Transactions, IEEE Transactions on Reliability, INFORMS Journal on Computing, International Journal of Production Research, IEEE Transactions on Systems, Man, and Cybernetics, Journal of Manufacturing Systems, The Engineering Economist, and IEEE Transactions on Evolutionary Computation. Dr. Smith holds editorial positions on INFORMS Journal on Computing, Computers & Operations Research, International Journal of General Systems, IEEE Transactions on Evolutionary Computation and IIE Transactions. (Received June 2005; revised October 2005; accepted December 2005)
利用蟻群演算法求解越野賽跑問題 梁韵嘉* 元智大學工業工程與管理學系 320 桃園縣中壢市遠東路號 135 號 Alice E. Smith 美國奧本大學工業與系統工程學系
摘要 本研究發展一蟻群最佳化演算法求解越野賽跑問題,此問題可被視為一廣義之旅行 推銷員問題,其應用範圍極為廣泛。本演算法依據蟻群最佳化之精神建構,並加入 一順序性局部搜尋程序及以距離為考量之懲罰函數為輔助機制。在六十七個測試例 題的結果顯示本蟻群演算法僅需極短的運算時間即能與文獻中其他方法表現相同或 是略勝一籌。除此之外,本方法之表現不受亂數種子、測試例題大小及限制程度改 變而有所影響,因此本研究所提出之蟻群最佳化演算法可被視為求解此類問題之最 佳方法。 關鍵詞:蟻群,越野賽跑問題,旅行推銷員問題,途程,最佳化 (*聯絡人:
[email protected])