domly generated signals and captured ATSC DTV signals are ... crete signal at receiver i is denoted by xi(n) (i = 1, 2, ··· ,M). ... where H is a ML à (N + PL) (N def.
The 18th Annual IEEE International Symposium on Personal, Indoor and Mobile Radio Communications (PIMRC’07)
MAXIMUM-MINIMUM EIGENVALUE DETECTION FOR COGNITIVE RADIO Yonghong Zeng and Ying-Chang Liang Institute for Infocomm Research, A*STAR 21 Heng Mui Keng Terrace, Singapore 119613 A BSTRACT Sensing (signal detection) is a fundamental problem in cognitive radio. In this paper, a new method is proposed based on the eigenvalues of the covariance matrix of the received signal. It is shown that the ratio of the maximum eigenvalue to the minimum eigenvalue can be used to detect the signal existence. Based on some latest random matrix theories (RMT), we can quantize the ratio and find the threshold. The probability of false alarm is also found by using the RMT. The proposed method overcomes the noise uncertainty difficulty while keeps the advantages of the energy detection. The method can be used for various sensing applications without knowledge of the signal, the channel and noise power. Simulations based on randomly generated signals and captured ATSC DTV signals are presented to verify the methods. I.
I NTRODUCTION
Careful studies by FCC reveal that most of the allocated spectrum experiences low utilization. This motivates the concept of opportunistic spectrum access that allows secondary networks to borrow unused radio spectrum from primary licensed networks. The core technology behind opportunistic spectrum access is “cognitive radio” [1]. Unique to cognitive radio is its ability to sense the environment over huge swath of spectrum and adapt to it. That is, it is necessary to dynamically detect the existence of signals of primary users. In December 2003, the FCC issued a Notice of Proposed Rule Making that identifies cognitive radio as the candidate for implementing negotiated/opportunistic spectrum sharing [2]. In response to this, from 2004, the IEEE has formed the 802.22 Working Group to develop a standard for wireless regional area networks (WRAN) based on cognitive radio technology. As discussed above, sensing is a fundamental component of cognitive radio. There are several factors which make the sensing difficult. First, the signal-noise-ratio (SNR) may be very low (lower than -20dB). Secondly, fading and multipath in wireless signal complicate the problem. Fading will cause the signal power fluctuates dramatically (can be 10dB or even higher), while unknown multipath will cause coherent detection methods unreliable. Thirdly, noise/interference level changes with time (noise power uncertainty) and the noise can be non-Gaussian. There are two types of noise uncertainty: receiver device noise uncertainty and environment noise uncertainty, which are caused by receiving devices or environment, respectively [3, 4, 5]. Due to noise uncertainty, in practice, it is very difficult (virtually impossible) to obtain the accurate noise power. There have been some sensing algorithms including the energy detection [6, 7, 3], the matched filtering (MF) [3] and cyc 1-4244-1144-0/07/$25.00°2007 IEEE
clostationary detection [8, 9]. These algorithms have different requirements and advantages/disadvantages. Energy detection is a major and basic method. Unlike other methods, energy detection does not need any information of the signal to be detected and is robust to unknown dispersive channel. However, energy detection is vulnerable to the noise power uncertainty [7, 3, 4], because the method relies on the knowledge of accurate noise power. In practice, it is very difficult (virtually impossible) to obtain the accurate noise power. To overcome this shortage, we propose a new method based on the eigenvalues of the covariance matrix of the received signal. It is shown that the ratio of the maximum eigenvalue to the minimum eigenvalue can be used to detect the signal existence. Based on some latest random matrix theories (RMT), we can quantize the ratio and find the threshold. The probability of false alarm is also found by using the RMT. The proposed method overcomes the noise uncertainty difficulty while keeps the advantages of the energy detection. The method can be used for various signal detection applications without knowledge of the signal, the channel and noise power. Simulations based on randomly generated signals and captured ATSC DTV signals are presented to verify the methods. Some notations are used in the following: superscripts T and † stand for transpose and Hermitian (transconjugate), respectively. Iq is the identity matrix of order q. II.
S ENSING MODEL
Assume that we are interested in the frequency band with central frequency fc and bandwidth W . We sample the received signal at a sampling rate higher than the Nyquist rate. Assume that there are M ≥ 1 receivers (antennas). The received discrete signal at receiver i is denoted by xi (n) (i = 1, 2, · · · , M ). There are two hypothesises: (1) hypothesis H0 : there exists only noise (no signal); (2) hypothesis H1 : there exist both noise and signal. At hypothesis H0 , the received signal at receiver i is xi (n) = ηi (n), n = 0, 1, · · · , (1) while at hypothesis H1 , the received signal at receiver i is xi (n) =
Nij P X X
hij (k)sj (n − k) + ηi (n),
(2)
j=1 k=0
where sj (n) (j = 1, 2, · · · , P ) are P ≥ 1 source signals, hij (k) is the channel response from source signal j to receiver i, Nij is the order of channel hij (k), and ηi (n) is the noise samples. Based on the received signals with little or no information on the source signals, channel responses and noise power, a sensing algorithm should make a decision on the existence of signals. Let Pd be the probability of detection, that is,
The 18th Annual IEEE International Symposium on Personal, Indoor and Mobile Radio Communications (PIMRC’07)
at hypothesis H1 , the probability of the algorithm having detected the signal. Let Pf a be the probability of false alarm, that is, at H0 , the probability of the algorithm having detected the signal. Obviously, for a good detection algorithm, Pd should be high and Pf a should be low. The requirements of the Pd and Pf a depend on the applications. III.
M AXIMUM - MINIMUM EIGENVALUE DETECTION def
Letting Nj = max(Nij ), zero-padding hij (k) if necessary, i
and defining
def
x(n) = [x1 (n), x2 (n), · · · , xM (n)]T , def
(3) T
hj (n) = [h1j (n), h2j (n), · · · , hM j (n)] ,
(4)
def
η(n) = [η1 (n), η2 (n), · · · , ηM (n)]T ,
(5)
we can express (2) into vector form as x(n) =
Nj P X X
where Rs is the statistical covariance matrix of the input signal, Rs = E(ˆ s(n)ˆ s† (n)), ση2 is the variance of the noise, and IM L is the identity matrix of order M L. ˆ max and λ ˆ min be the maximum and minimum eigenLet λ value of R, and ρˆmax and ρˆmin be the maximum and miniˆ max = ρˆmax + σ 2 and mum eigenvalue of HRs H† . Then λ η 2 ˆ min = ρˆmin + σ . Obviously, ρˆmax = ρˆmin if and only if λ η HRs H† = δIM L , where is δ is a positive number. In practice, when signal presents, it is very unlikely that HRs H† = δIM L (due to dispersive channel and/or oversampling and/or correlation among the signal samples). Hence, if there is no sigˆ max /λ ˆ min = 1; otherwise, λ ˆ max /λ ˆ min > 1. The ratio nal, λ ˆ ˆ λmax /λmin can be used to detect the presence of signal. The detection algorithm is summarized as follows. Algorithm 1 Maximum-minimum eigenvalue (MME) detection Step 1. Compute
hj (k)sj (n − k) + η(n), n = 0, 1, · · · . (6)
R(Ns ) =
j=1 k=0
def
=
[xT (n), xT (n − 1), · · · , xT (n − L + 1)]T ,
η ˆ(n)
def
=
[η T (n), η T (n − 1), · · · , η T (n − L + 1)]T ,
ˆ s(n)
def
[s1 (n), · · · , s1 (n − N1 − L + 1), · · · , sP (n), · · · , sP (n − NP − L + 1)]T ,
=
(7)
we get x ˆ(n) = Hˆ s(n) + η ˆ(n), def
where H is a M L × (N + P L) (N =
P P j=1
as
def Hj =
hj (0) · · · .. . 0 ···
H = [H1 , H2 , · · · , HP ], hj (Nj ) · · · 0 .. . . hj (0)
···
(8)
Nj ) matrix defined
def
(9) (10)
def
=
1 Ns
L−1+N X s
x ˆ(n)ˆ x† (n),
(11)
n=L
where Ns is the number of collected samples. If Ns is large, based on the assumptions (A1-2), we can verify that def
IV.
R(Ns ) ≈ R = E(ˆ x(n)ˆ x† (n)) = HRs H† + ση2 IM L ,
x ˆ(n)ˆ x† (n).
n=L
T HEORETIC ANALYSIS AND THE THRESHOLD
In practice, we only have finite number of samples available. Hence, the sample covariance matrix R(Ns ) may be well away from the statistical covariance matrices R. The eigenvalue distribution of R(Ns ) becomes very complicated [10, 11, 12, 13]. This makes the choice of the thresholds very difficult. At low SNR, the performance of a sensing algorithm is very sensitive to the threshold. Since we have no information on the signal (actually we even do not know if there is signal or not), it is difficult to set the threshold based on the Pd . Hence, usually we choose the threshold based on the Pf a . When there is no signal, R(Ns ) turns to Rη (Ns ), the sample covariance matrix of the noise defined as,
hj (Nj )
The following assumptions for the statistical properties of transmitted symbols and channel noise are assumed. (A1) Noise is white. (A2) Noise and transmitted signal are uncorrelated. Let R(Ns ) be the sample covariance matrix of the received signal, that is, R(Ns )
L−1+N X s
Step 2. Obtain the maximum and minimum eigenvalue of the matrix R(Ns ), that is, λmax and λmin . Step 3. Decision: if λmax > γλmin , signal exists (“yes” decision); otherwise, signal does not exist (“no” decision), where γ > 1 is a threshold (to be given in the next section).
Considering L consecutive outputs and defining x ˆ(n)
1 Ns
(12)
Rη (Ns ) =
1 Ns
L−1+N X s
η ˆ(n)ˆ η † (n).
(13)
n=L
Rη (Ns ) is a special Wishart random matrix [10]. The study of the spectral (eigenvalue distributions) of a random matrix is a very hot topic in recent years in mathematics as well as communication and physics. The joint probability density function (PDF) of ordered eigenvalues of the random matrix Rη (Ns ) has been known for many years [10]. However, since the expression of the PDF is very complicated, no closed form expression has been found for the marginal PDF of ordered eigenvalues. Recently, I. M. Johnstone and K. Johansson have found the distribution of the largest eigenvalue [11, 12] for real and complex matrix, respectively, as described in the following theorems.
The 18th Annual IEEE International Symposium on Personal, Indoor and Mobile Radio Communications (PIMRC’07)
t F1 (t)
-3.90 0.01
-3.18 0.05
-2.78 0.10
-1.91 0.30
-1.27 0.50
-0.59 0.70
0.45 0.90
0.98 0.95
2.02 0.99
Table 1: Numerical table for the Tracy-Widom distribution of order 1 Theorem 1. Assume that the √ noise2 is real. Let√A(Ns ) = √ Ns M L) and ν = ( Ns − 1 + ση2 Rη (Ns ), µ = ( Ns − 1 + √ 1 1 L 1/3 √ √ = y M L)( N −1 + M L ) . Assume that lim M s Ns →∞ Ns λmax (A(Ns ))−µ (0 < y < 1). Then converges (with probability ν one) to the Tracy-Widom distribution of order 1 (W1 ) [14]. Theorem 2. Assume that the Let √ noise√is complex. 0 2 0 s A(Ns ) = N R (N ), µ = ( N + M L) and ν = 2 η s s √ ση √ 1 1 M L 1/3 ( Ns + M L)( √N + √M L ) . Assume that lim Ns = s
0
Ns →∞
s ))−µ converges (with proby (0 < y < 1). Then λmax (A(N ν0 ability one) to the Tracy-Widom distribution of order 2 (W2 ) [14].
Note that for large Ns , µ and µ0 , ν and ν 0 are almost the same, that is, the mean and variance for the largest eigenvalue of real and complex matrix are almost the same. However, their limit distributions are different. Bai and Yin found the limit of the smallest eigenvalue [13] as described in the following theorem. L Theorem 3. Assume that lim M = y (0 < y < 1). Ns →∞ Ns √ 2 2 Then lim λmin = ση (1 − y) . Ns →∞
Based on the theorems, we have the following results:
λmax
≈
λmin
≈
√ ση2 p ( Ns + M L)2 Ns √ ση2 p ( Ns − M L)2 . Ns
(14) (15)
The Tracy-Widom distributions were found by Tracy and Widom (1996) as the limiting law of the largest eigenvalue of certain random matrices [14]. Let F1 and F2 be the cumulative distribution function (CDF) (sometimes simply called distribution function) of the Tracy-Widom distribution of order 1 and order 2, respectively. There is no closed form expression for the distribution functions. It is generally difficult to evaluate them. Fortunately, based on numerical computation, there have been tables for the functions [11]. Table 1 gives the values of F1 at some points. It can be used to compute the F1−1 (y) at certain points. For example, F1−1 (0.9) = 0.45, F1−1 (0.95) = 0.98. Using the theories, we are ready to analyze the algorithms. For real signal, the probability of false alarm of the MME de-
tection is à =P
ση2
Pf a = P (λmax > γλmin ) !
Ns
λmax (A(Ns )) > γλmin
³ ´ p √ ≈ P λmax (A(Ns )) > γ( Ns − M L)2 à ! √ √ λmax (A(Ns )) − µ γ( Ns − M L)2 − µ =P > ν ν à √ ! √ γ( Ns − M L)2 − µ = 1 − F1 . (16) ν Hence we should choose the threshold such that à √ ! √ γ( Ns − M L)2 − µ 1 − F1 = Pf a . ν This leads to ! à √ √ γ( Ns − M L)2 − µ F1 = 1 − Pf a , ν or, equivalently, √ √ γ( Ns − M L)2 − µ = F1−1 (1 − Pf a ). ν
(17)
(18)
(19)
From the definitions of µ and ν, we finally obtain the threshold √ √ ( Ns + M L)2 √ γ= √ ( Ns − M L)2 Ã ! √ √ ( Ns + M L)−2/3 −1 · 1+ F1 (1 − Pf a ) . (20) (Ns M L)1/6 For complex signal, the only difference is that the function F1 should be replaced by F2 , the CDF of the Tracy-Widom distribution of order 2. V.
S IMULATIONS
We require the probability of false alarm Pf a 6 0.1. Then the threshold is found based on the formulae in Section IV. For comparison, we also simulate the energy detection for the same system. Energy detection needs the noise power as a priori. Unfortunately, in practice, the noise power uncertainty always presents [7, 3]. Due to the noise uncertainty, the estimated (or assumed) noise power may be different from the real noise power. Let the estimated noise power be σ ˆη2 = αση2 . We define the noise uncertainty factor (in dB) as B = max{10 log10 α}. It is assumed that α (in dB) is evenly distributed in an interval
The 18th Annual IEEE International Symposium on Personal, Indoor and Mobile Radio Communications (PIMRC’07)
method Pf a
EG-2 dB 0.497
EG-1.5 dB 0.496
EG-1 dB 0.490
EG-0.5 dB 0.470
EG-0dB 0.103
MME 0.077
Table 2: Probabilities of false alarm (M = 4, P = 2) 1
0.9
Probability of detection
0.9
0.8
Probability of detection
EG−2dB EG−1.5dB EG−1dB EG−0.5dB EG−0dB MME
1
EG−2dB EG−1.5dB EG−1dB EG−0.5dB EG−0dB MME
0.7
0.6
0.5
0.8 0.7 0.6 0.5 0.4 0.3 0.2
0.4
0.8 −20
−15
−10
−5
0
1
1.2
1.4
1.6
Number of samples
5
SNR (dB)
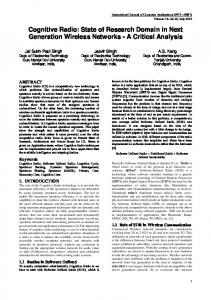
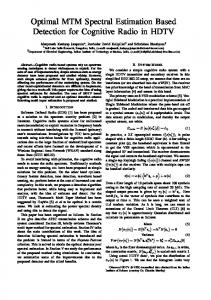
Figure 1: Probability of detection (M = 4, P = 2) [−B, B] [3, 5]. In practice, the noise uncertainty factor of receiving device is normally 1 to 2 dB [3, 5]. The threshold for the energy detection is given in [3]. In the following, all the results are averaged over 2000 Monte Carlo realizations. First, randomly generated signals are used. We consider a system with 4 receivers/antennas (M = 4) and 2 signals (P = 2). The channel orders are N1 = N2 = 4 (5 taps). Assume that all the channel taps are independent with equal power. The smoothing factor is chosen as L = 6. 50000 samples are used for computing the sample covariance matrix. The probabilities of detection (Pd ) for the MME method and energy detection (with or without noise uncertainty) are shown in Figure 1, where and in the following “EG-x dB” means the energy detection with x-dB noise uncertainty. If the noise variance is exactly known (B = 0), the energy detection is pretty good. However, if there is noise uncertainty, the detection probability of the energy detection is much worse than that of the proposed method. The Pf a results are shown in Table 2 (note that the Pf a is not related to the SNR because there is no signal). The Pf a for the proposed method and the energy detection without noise uncertainty meet the requirement (Pf a 6 0.1), but the Pf a for the energy detection with noise uncertainty far exceeds the limit. This means that the energy detection is very unreliable in practical situations with noise uncertainty. To test the impact of the number of samples, we fix the SNR at -15dB and vary the number of samples from 7000 to 22000. Figure 2 and Figure 3 show the Pd and Pf a , respectively. It is seen that the Pd of the proposed algorithm and the energy detection without noise uncertainty increases with the number of samples, while that of the energy detection with noise uncertainty almost has no change. This means that the noise uncer-
1.8
2
2.2 4
x 10
Figure 2: Probability of detection (M = 4, P = 2, SNR=-15 dB)
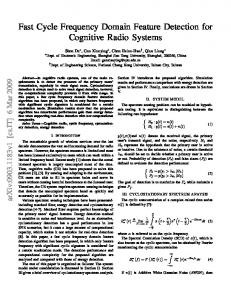
tainty problem cannot be solved by increasing the number of samples. For the Pf a , all the algorithms do not change much with the varying number of samples (note that the threshold is set based on Pf a , Ns and L). Secondly, we test the algorithms based on the captured ATSC DTV signals [15]. The real DTV signals (field measurements) are collected at Washington D.C., USA. The data rate of the vestigial sideband (VSB) DTV signal is 10.762 samples/s. The sampling rate at the receiver is two times that rate. The multipath channel and the SNR of the received signal are unknown. In order to use the signals for simulating the algorithms at very low SNR, we need to add white noises to obtain the various SNR levels [5]. In the simulations, the smoothing factor is chosen as L = 16. The number of samples used for each test is Ns = 100000 (corresponding to 4.65 mili seconds sampling time). The results are averaged over 1000 tests (for different tests, different data samples and noise samples are used). Figure 4 gives the Pd results based on the DTV signal file WAS-003/27/01 (the receiver is outside and 48.41 miles from the DTV station) [15]. The Pf a results are shown in Table 3. The Pf a of MME is well below 0.1. But the Pf a for the energy detection with noise uncertainty far exceeds 0.1. In summary, all the simulations show that the proposed method works well without using information of the signal, the channel and noise power. The energy detection is not reliable (low probability of detection and high probability of false alarm) when there is noise uncertainty. VI.
C ONCLUSIONS
Method based on the maximum and minimum eigenvalues of the sample covariance matrix of the received signal has been
The 18th Annual IEEE International Symposium on Personal, Indoor and Mobile Radio Communications (PIMRC’07)
method Pf a
EG-2 dB 0.495
EG-1.5 dB 0.494
EG-1 dB 0.490
EG-0.5 dB 0.479
EG-0dB 0.107
MME 0.081
Table 3: Probabilities of false alarm (for real DTV signal detection, M = P = 1) proposed. Latest random matrix theories have been used to set the thresholds and obtain the probability of false alarm. The method can be used for various signal detection applications without knowledge of the signal, the channel and noise power. 0.55 EG−2dB EG−1.5dB EG−1dB EG−0.5dB EG−0dB MME
0.5
Probability of false alarm
0.45 0.4
R EFERENCES [1] J. Mitola and G. Q. Maguire, “Cognitive radios: making software radios more personal,” IEEE Personal Communications, vol. 6, no. 4, pp. 13– 18, 1999.
0.35
[2] FCC, “Facilitating opportunities for flexible, efficient, and reliable spectrum use employing cognitive radio technologies, notice of proposed rule making and order,” in FCC 03-322, Dec. 2003.
0.3 0.25
[3] A. Sahai and D. Cabric, “Spectrum sensing: fundamental limits and practical challenges,” in Proc. IEEE International Symposium on New Frontiers in Dynamic Spectrum Access Networks (DySPAN), (Baltimore, MD), Nov. 2005.
0.2 0.15 0.1 0.05 0.8
1
1.2
1.4
1.6
1.8
2
Number of samples
2.2
[4] R. Tandra and A. Sahai, “Fundamental limits on detection in low SNR under noise uncertainty,” in WirelessCom 2005, (Maui, HI), June 2005.
4
x 10
Figure 3: Probability of false alarm (M = 4, P = 2)
[5] S. Shellhammer, G. Chouinard, M. Muterspaugh, and M. Ghosh, Spectrum sensing simulation model. http://grouper.ieee.org/groups/802/22 /Meeting documents/2006 July/22-06-0028-07-0000-SpectrumSensing-Simulation-Model.doc, July 2006. [6] H. Urkowitz, “Energy detection of unkown deterministic signals,” Proceedings of the IEEE, vol. 55, no. 4, pp. 523–531, 1967. [7] A. Sonnenschein and P. M. Fishman, “Radiometric detection of spreadspectrum signals in noise of uncertainty power,” IEEE Trans. on Aerospace and Electronic Systems, vol. 28, no. 3, pp. 654–660, 1992. [8] W. A. Gardner, “Spectral correlation of modulated signals: part i-analog modulation,” IEEE Trans. Communications, vol. 35, no. 6, pp. 584–595, 1987.
1 EG−2dB EG−1.5dB EG−1dB EG−0.5dB EG−0dB MME
0.9
Probability of detection
0.8
[9] W. A. Gardner, W. A. Brown, III, and C.-K. Chen, “Spectral correlation of modulated signals: part ii-digital modulation,” IEEE Trans. Communications, vol. 35, no. 6, pp. 595–601, 1987.
0.7
[10] A. M. Tulino and S. Verd´u, Random Matrix Theory and Wireless Communications. Hanover, USA: now Publishers Inc., 2004.
0.6
[11] I. M. Johnstone, “On the distribution of the largest eigenvalue in principle components analysis,” The Annals of Statistics, vol. 29, no. 2, pp. 295–327, 2001.
0.5 0.4
[12] K. Johansson, “Shape fluctuations and random matrices,” Comm. Math. Phys., vol. 209, pp. 437–476, 2000.
0.3 0.2 −20
−15
−10
−5
0
5
SNR (dB)
Figure 4: Probability of detection (based on DTV signal WAS003/27/01, M = P = 1)
[13] Z. D. Bai, “Methodologies in spectral analysis of large dimensional random matrices, a review,” Statistica Sinica, vol. 9, pp. 611–677, 1999. [14] C. A. Tracy and H. Widom, “On orthogonal and symplectic matrix ensembles,” Comm. Math. Phys., vol. 177, pp. 727–754, 1996. [15] V. Tawil, 51 captured DTV signal. http://grouper.ieee.org/groups/802/22 /Meeting documents/2006 May/Informal Documents, May 2006.