Maximum Power Point Tracking of a Wind. Turbine Driven by Synchronous Generator. Connected to an Isolated Load Using Genetic. Algorithm. M. A. Lasheen ...
Journal of Electrical Engineering www.jee.ro 1
Maximum Power Point Tracking of a Wind Turbine Driven by Synchronous Generator Connected to an Isolated Load Using Genetic Algorithm M. A. Lasheen, F.M. Bendary, Faculty of Engineering at shoubra, Benha University, Egypt, Soliman. M. Sharaf, and Helmy. M. El-Zoghby, Faculty of Engineering, Helwan University, Egypt Abstract--Wind turbine generation is rapidly becoming the preferred renewable source of electric energy. The amount of energy captured from a wind energy conversion system (WECS) depends not only on the prevailing wind at the site, but also on the control strategy used for the WECS. Modeling, control and simulation of a wind turbine conversion system connected to an isolated load are proposed. The wind turbine being considered a variable speed turbine connected to a gear box to move a three phase wound rotor synchronous generator. The variable frequency energy produced by the generator is converted to the 50 Hz power system energy by a full power AC/DC/AC electronic converter. The maximum output power at every wind speed is achieved by selecting a certain inverter modulation index using proportional-integral controller which uses DC link power as feedback signal. The controller gains (Kp and Ki) are optimized using the Genetic Algorithm. Index Terms--Wind Turbine Modeling, Synchronous Generator, MPPT Techniques, PI, Genetic Algorithm.
I. INTRODUCTION
T
HE The demand for electricity power is growing rapidly and is expected to keep growing. The growth in net electricity generation outpaced the growth in total energy consumption. Due to escalating oil prices and CO2 emission reduction demand, renewable energy, especially wind energy, becomes more and more attractive and competitive [2]. A number of renewable power generation sources exist, such as wind energy, solar energy, wave energy, hydro power and more sophisticated systems based on hydrogen. In renewable power generation, wind energy has been noted as the fastestgrowing energy technology in the world. This is due to the fact that world has enormous resources of wind energy. It has been estimated that tapping barely 10% of the wind energy available could supply all the electricity needs of the world. Moreover, recent technological advances in variable-speed wind turbines, power electronics, drives, and controls have made wind energy competitive with conventional coal and natural gas power [3]. Increasing of wind farms penetration on power systems justifies the need for development of accurate wind turbine model, evaluating their influence and thus improving the planning and operation of electrical network
[4]. Wind energy conversion systems (WECS) or wind turbine generators (WTG) use a wind turbine to transform the kinetic energy of wind into mechanical energy to turn an electric generator, which transforms mechanical energy into electrical energy. An electronic power converter can be used to level the electric energy to feed the power system. Most used generators in WECS include doubly fed induction generators, direct–drive permanent magnet synchronous generators and squirrel-cage induction generators. Even though wound-rotor synchronous generators are not so common, they are becoming a viable alternative because of grid-code requirements, such as voltage support during fault conditions; control of reactive power in a given range, limiting maximum power generation and start-up current transients [1]. In addition, the wound-rotor synchronous generators are more efficient, less complicated, and easier to construct from an electrical engineering perspective [10]. Due to wind energy and turbine features, optimum wind energy extraction can be achieved by operating the wind turbine in a variable speed mode. Basically, there are three types of a Maximum Power Point Tracking (MPPT) algorithms, namely, Tip Speed Ratio (TSR) control, Perturb and Observe (P&O) control (which is also known as hill-climbing searching control), and Power Signal Feedback (PSF) control (which is also known as Optimum Relationship-Based (ORB) control) [2]. TSR is defined as the ratio between the rotor speed of the tip of a blade and the actual wind velocity. There is an optimum TSR at which the maximum energy conversion efficiency is achieved. TSR control directly regulates the turbine speed to keep the TSR at an optimal value by measuring wind speed and turbine speed. A typical power coefficient versus TSR curve is shown in Fig. 1. Tip speed ratio control takes advantage of the fact that the Cp-λ curve is quite flat close to its optimum value, so small errors in the estimated tip speed ratio should not influence the results too much [12]. No detailed mathematical model or linearization about an operating point is needed and it is insensitive to system parameter variation [2]. P&O control adjusts the turbine speed toward the MPP, according to the result of comparison between successive wind turbine generator output power measurements. The P&O
1
Journal of Electrical Engineering www.jee.ro 2
algorithms are widely used in control of MPPT thanks to their simple structure and reduced number of necessary measured parameters [14]. It is especially suitable for small-scale WECSs, as an anemometer is not required and the system knowledge is not needed [2]-[8].
Fig. 1. Typical power coefficient curve.
PSF control is based on power comparison. This topology requires the knowledge of the wind turbine’s maximum power curve, and tracks this curve through its control mechanisms. The maximum power curves need to be obtained via simulations. In this method, optimal power is generated using the mechanical power equation of the wind turbine where wind speed is used as the input. The wind speed is measured, and then the optimal output power is calculated and compared to the actual output power, and the error is used to control a modulation index which is proposed in this work as this control strategy is straightforward, simple and more accurate. But TSR method requires both the wind speed and the turbine speed to be measured or estimated in addition to requiring the knowledge of optimum TSR of the turbine for the system to be able extract maximum possible power. And P&O control suffers from some common drawbacks; the response to wind speed change is extremely slow, especially for large inertia wind turbines [5]-[8]. The control system of a WECS based on synchronous generator embraces control of nacelle orientation, wind turbine, generator excitation, power rectifier and power inverter. Development of such a control system can be carried out gradually and iteratively. This paper is organized as follows; Section 1 introduces the conventional MPPT methods. In Section 2, the system configuration for investigation is presented. Section 3 describes the characteristic of the proposed model of the WECS (models of the wind turbine, synchronous generator, and electronic power converter) that produce the dynamic behavior of a 16 kW WECS. In Section 4, the proposed MPPT technique is presented in detail. The simulation results demonstrate and verify the validity of the proposed technique using the MATLAB/Simulink in Section 5. Section 6 concludes this paper.
1500 rpm generator rotor, c) Three-phase synchronous generator and excitation system, d) A full power AC/DC/AC converter, with 50 Hz output, and e) A static load. The wind turbine is intended to operate at variable speed over a wide range for the WECS to generate maximum power at each wind speed. The synchronous generator can be connected to a diode to produce DC electric energy. The voltage source inverter rated at 16 kW feeds AC electric energy at 50 Hz to the static load. The inverter uses Pulse Width Modulation (PWM) technique with a switching frequency about 2 kHz to reduce harmonics. This type of inverter allows for power flow control to connect the WECS to a static load. The inverter is built with Insulated Gate Bipolar Transistors (IGBTs) capable to handle 400 A at 690 V [1]-[2]. The dc link filter elements in a three-phase voltage source inverter-fed static load can affect the performance of the system if not properly chosen. The selection of filter component values is based on minimization of voltage and current ripple currents in the dc link, damping effects and on resonant frequency [6]. To feed the power to the static load, there are three problems, voltage spikes on the load terminals caused by the dv/dt during switching transition, the additional losses in the loads caused by the high frequency current ripple and the electromagnetic emission caused by the high dv/dt in the cable. All three problems can be overcome with suitable sizing of LC filter between inverter output terminals and the static load cables. The filter performance with respect to load voltage is determined by its resonance frequency. In order to achieve an almost sinusoidal load voltage and avoid additional resonance suppressing control, the filter resonance frequency, the fundamental frequency of the inverter voltage and the switching frequency of the inverter have to have at least a factor of six among of them. Resonance frequency is determined by the product of L and C.
1
1 2 L C f f The choice of the individual values of Lf and Cf is a remaining degree of freedom [7]. The scheme in Fig. 2 is used in this paper to demonstrate the validity of the new MPPT technique because of its simplicity and clarity. Fr
II. SYSTEM CONFIGURATION The scheme of the WECS, where the proposed algorithm is implemented, is shown in Fig. 2. The WTG discussed in this paper consists of a) A wind turbine with horizontal axis, 3.15 m three blade rotor that can produce 16 kW nominal power, b) A gear-box to multiply velocity from 320 rpm turbine rotor to
Fig. 2. WECS with wound-rotor synchronous generator and full power converter.
2
Journal of Electrical Engineering www.jee.ro 3
Fig. 3. The General Structure of the WTG Model.
A. Wind Turbine Model The wind turbine converts the motion energy of wind flow into mechanical energy. The turbine shaft drives the generator rotor through multiplying gear box. The power Pw of a wind flow with speed νw and density ρ across a surface with area A 1 3 2 Pw Av is given by [15]: w 2 The mechanical power Pm that can be obtained from the wind power depends on the turbine aerodynamic efficiency Cp [1]: 1 3 3 Pm PwC p Av C P , w 2 Where the area is that swept by the turbine blades with radius L. The turbine power coefficient Cp describes the power extraction efficiency of the wind turbine. It is a nonlinear function of both the tip speed ratio λ and the blade pitch angle β. While its maximum theoretical value is approximately 0.59, in practicality it lies between 0.4 and 0.45 [9]. The power coefficient Cp characterizes every turbine and depends on the point of operation as specified by the angular position of the turbine blades β and the turbine tip speed ratio λ that is given by [13]: λ=wt L/vw where wt is the angular speed of the turbine shaft. Many different versions of fitted equations for Cp have been used in previous studies. This paper defined it based on the following [1]: c
c 5 C p , c1 2 c3 c4 e i c6 i 1
1
0.035
Fig. 5 shows Cp-λ curves for several values of β. The maximum value of Cp (Cp max = 0.48) is obtained for β = 0 at the optimal λ (λopt = 8.1). Assuming that the coupling between the wind turbine, gear box and electrical generator are rigid, the mechanical part of the wind turbine generator can be modeled as a single mass system with equivalent inertia constant and equivalent torque for the generator: T Tge T nTg d 6 wt t t dt J t J ge Jt n2 J g Where Tt, Tg and Tge are the torques, and Jt, Jg and Jge are the inertia constants for turbine, generator and equivalent of generator, respectively. Coefficient n is the gear box ratio Where: n = wg/wt [1]. 0.5 0
=0
0.4
cpmax 0
=5
0.3 0
= 10 Cp
III. WECS CHARACTERISTICS The WTG model is intended to reproduce the dynamic behavior of 16 kW power plant. The model was programmed in Matlab/Simulink. The main components of the WTG model include the wind turbine, the synchronous generator and the AC/DC/AC power converter. The general structure of the WTG model is shown in Fig. 3;
0.2 0
0.1 0 -0.1 0
= 15
0
= 20
5
opt
10
15
Fig. 5. curves for WECS model.
B. Synchronous Generator Model The electric generator model main equations are obtained from the rotor and stator circuits as shown in Fig. 6. The rotor circuits comprehend the field winding and two damping winding (Kd, Kq). The coefficients of these equations are made constant with the park’s transformation. Then the equations are normalized [1].
4 5
i 0.08 3 1 Where C1=0.5176, C2=116, C3=0.4, C4=5, C5=21 and C6=0.0068. The MATLAB/Simulink simulation of the proposed Wind Turbine (WT) model is shown in Fig. 4:
Fig. 6. Rotor and stator circuits of a 3-phase synchronous generator
Stator equations in dq0 coordinates [1]:
ed p d q wr Raid
eq p q d wr Raiq
7 8
Fig. 4. MATLAB/Simulink simulation of the proposed WT model.
3
Journal of Electrical Engineering www.jee.ro 4
d Ld id Lafdi fd Lakdikd
q Lqiq Lakqikq
0 L0i0 Rotor equations in dq0 coordinates [1]:
e fd p fd R fd i fd
0 p kd Rkd ikd 0 p kq Rkq ikq
9 10 11 12 13 14 15
3 2 3 L fkd i fd Lkkd ikd Lakd id 2 3 kd Lkkq ikq Lakqiq 2
2 ed id eqiq 3
x 10
3 Vw = 15 m/s
2.5
17
18
Since the connection of the synchronous generator to the AC/DC/AC power converter is balanced, the electric power output Pe is [1]:
Pe
Max Power-Speed Characteristics
4
3.5
16
fd L ffd i fd L fkd ikd Lafd id kd
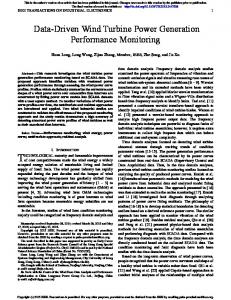
divide into two parts, one to electrical energy and another lost to acceleration in the generator speed. The second part must be transferred to useful electrical energy, and this is by the generator current. Where, with the same generator input mechanical energy, once the generator current increases the generator speed decreases and vice versa. The modulation index controls the level of voltage and current of the generated power from the generator. The proposed MPPT technique is based on power signal feedback control. As shown in Fig. 7, there is a certain maximum power point at every wind speed.
19
Finally, the excitation system is a DC excitation system.
Power ( Watt )
e0 p 0 Rai0
2
MPP
Vw = 13 m/s
1.5
Vw = 11 m/s
1 0.5 Vw = 7m/s
0 -0.5 0
500
1000
Vw = 9 m/s
1500 2000 Speed ( RPM )
2500
3000
Fig. 7. Maximum power-speed characteristic versus wind speed
C. AC/DC/AC power converter model The three phase AC/DC/AC power converter has two components: Power Converter on the Generator (PCG) side and Power Converter on the Static Load (PCSL) side. PCG is built with diodes and PCSL is built with IGBTs that use pulse width modulation (PWM). PCSL always works at the fundamental frequency (50 Hz), while the PCG works at variable frequency. PCG and PCSL (voltage source converter) coupled back to back by a DC bus link. The relationship between the voltages VG at the AC terminal and VDC at the DC terminals of PCG is [16]:
VDC
3VmLL
20
Also, the relationship between the voltages VSL at the AC terminals and VDC at the DC terminals of PCSL, with modulation factor m is given by [16]:
VSL m
3 VDC 2 2
The objective of this work is tracking of this maximum power point using the proposed algorithm as shown in Fig. 8, which based on three steps: 1) An anemometer is used to measure the wind speed at the tip of a blade. 2) By knowing the characteristic of the wind turbine {maximum power coefficient and optimal tip speed ratio}, the maximum power at this wind speed is calculated. 3) Measuring the DC voltage and the DC current to determine the actual power and comparing it with the calculated maximum power, the error is used to control a modulation index of the power inverter. The used controller is PI controller that controls the modulation index. The controller gains (Kp and Ki) are optimized using the genetic algorithm.
21
The modulation factor is the control variable in the PWM scheme. The previous voltage equation is only valid for 0 < m < 1. For larger values of m, the converter gets saturated and harmonics increase at low frequencies [1]. IV. PROPOSED MPPT TECHNIQUE The variation of wind speed changes the mechanical energy transferred from the wind turbine to the synchronous generator so, when the wind speed increase, the synchronous generator input energy must increase. But the increasing part of energy
Fig. 8. The proposed control system scheme.
The proposed Maximum Power Point Tracking methodology is demonstrated in a simple form by the following flow chart in Fig. 9;
4
Journal of Electrical Engineering www.jee.ro 5
Initialization, Read data (pop. size (N), no of variables…) Randomly generate the binary strings to generate the population of chromosomes of size (N)
Decode the binary strings to their decimal values
Measure ( Vdc & I dc ), Calculate Calculate error =
Fig. 9. Proposed MPPT technique control flow chart.
It is important to notice that the purpose of the proposed control system is to demonstrate the feasibility of the wind turbine generator model and to be a reference for further advance. Genetic Algorithm (GA) is one of the advanced optimization method to find optimized values of PI gains. GA is very different from most of the traditional optimization method. A most important difference between genetic algorithms and most of the traditional optimization methods is that GA uses a population of points at one time in contrast to the single point approach by a traditional optimization methods, transition rules are used they are deterministic in nature but GA uses randomized operators. Random operators improve the search space in an adaptive manner [11]-[17]. The proposed GA based MPPT for WECS is demonstrated in a simple form by the following flow chart in Fig. 10;
Pdc Vdc I dc
Pref Pdc
Calculate the fitness value of each chromosome from Y = 0.01*(sum (error (1, :)'. ^2)/length (error));
Is the number of generation = 43?
Yes
No Encoding into binary string
Select a pair of chromosomes for mating
Perform the crossover for the selected parent strings then perform the mutation
Place the resulting chromosomes in the new population
V. SIMULATION RESULTS MATLAB/Simulink simulations using the model in Fig. 11 can verify the performance of the proposed MPPT technique. The WECS scheme is similar to that shown in Fig. 2. The parameters of Synchronous Generator (SG) and Wind Turbine (WT) are summarized in Table I, while the controller gains are summarized in Table II.
No
Is the size of new population = N? Yes
Replace the current chromosome population with the new population
Print out the variables values Fig. 10. The Genetic Algorithm flow chart.
Fig. 11. The simulation of overall maximum power extraction closed loop proposed system.
Genetic Algorithm is used to search the controller optimized gains and genetic operators are used to find better solution. The string length is taken 16 bit and the size of the population is 20. After producing several generations by GA the best solution is found in 43th iteration. The genetic algorithm parameters are default as in a tool box of GA in MATLAB but some selected as in Table III to optimize the
5
Journal of Electrical Engineering www.jee.ro 6
fitness value which reached 0.003.
Rated voltage Pole Pairs Turbine type Gear box ratio Maximum Cp Optimal TSR (λ) Maximum rotor speed
Gains
Kp Ki
400 V 2 3-blade horizontal axis turbine 33/157 0.48 8.1 1500 RPM
Table II Controller Gains Values 0.5377
Modulation index
16 Kw
0.8
0.75
0.7
0.65
0.6 0.55 1
1.5
2
2.5
3
3.5
4
4.5
5
5.5
6
4
4.5
5
5.5
6
4
4.5
5
5.5
6
4
4.5
5
5.5
6
4
4.5
5
5.5
6
Time (s) 180 175
Rotor speed (rad/s)
Items Power rating
Table I SG and WT Parameters Specification
0.85
170 165 160 155 150 145
1.8338
140 1
1.5
2
2.5
3
3.5
Time (s)
Selection function Mutation function
Roulette Gaussian Scale: 0.01
From Fig. 12 to Fig. 15, the system has static resistive load but Fig. 16 is with static inductive load.
2000
DC link voltage (v)
Table III Genetic Algorithm Parameters Parameters Values Scaling function Rank
1800
1600
1400
1200
1000 1
1.5
2
2.5
3
3.5
Time (s)
Fig. 12 depicts the dynamic response of the system for increasing step change in modulation index followed by decreasing step in modulation index. The wind speed does not change. The figures show the modulation index, rotor speed, DC link voltage, current and power. At t=2 sec, the modulation index increases from 0.6 to 0.8 then at t=4 sec, it decreases to 0.6 again.
DC link current (A)
20
15
10
5 1
1.5
2
2.5
3
3.5
Time (s) 4
x 10
Fig. 13 shows the dynamic response of the system for step change in the wind speed. The figures show the wind speed step change, rotor speed, power coefficient, modulation index, DC link voltage, current and power for open loop control system with modulation index 0.5 and for closed loop control system with controlled modulation index.
2.2
DC link power (w)
Increasing the modulation index allows the load to draw more power so that the rotor speed decreases according to the wind turbine characteristic; this variation in modulation index has direct effect on the generated level of voltage, current and power as shown in Fig. 12, and proves the feasibility of the proposed technique to control the output power so, the MPPT can be achieved with controlling of the power inverter modulation index.
2 1.8 1.6 1.4 1.2 1 0.8 1
1.5
2
2.5
3
3.5
Time (s)
Fig. 12. Changing in modulation index
At t=10 sec, the wind speed increases from 11 m/s to 12 m/s and at t=15 sec, it increases to 13 m/s, so, the controlled modulation index varied to track MPP at the new wind speed by changing the level of generated voltage and current as shown in the figures while the power coefficient is kept at its maximum value (48%).
6
Journal of Electrical Engineering www.jee.ro 7
Fig. 14 depicts the dynamic response of the system for the changes of stochastic wind profiles. The figures show the wind speed profile change, rotor speed, power coefficient, modulation index, DC link voltage, current and power for closed loop control system with controlled modulation index.
Fig. 13. Changing in the wind speed.
Fig. 14. Changing of stochastic wind profiles.
7
Journal of Electrical Engineering www.jee.ro 8
As shown, the wind changes randomly while power coefficient is kept at its maximum value (48%) as the modulation is updating to track MPP at each wind speed. So, this is a robust controller which actively adapts to the changes of stochastic wind profiles. Fig. 15 describes the dynamic response of the system for step change in the static load. The figures show the static load step change, rotor speed, power coefficient, Modulation index, DC link voltage, current and power for closed loop control system with controlled modulation index. The wind speed is kept at 12 m/s so, the generated power must be conserved at its maximum value even the load changed. At t=10 sec, the load decreases to 80 % of its value (from 25 ohm to 20 ohm) so, the modulation index varied to conserve MPP at the new load by changing the level of generated voltage and current to conserve the generated power at its maximum value as shown in the figures, so power coefficient is kept at its maximum value (48%). So, this is a global controller for all operating conditions of wind turbine which smoothly switch between partial load and full load conditions.
Fig. 15. Changing in the static resistive load.
Fig. 15. (Cont’d) Changing in the static resistive load.
Fig. 16 shows the dynamic response of the system with static inductive load for step change in the wind speed. The figures show the wind speed step change, rotor speed, power coefficient, modulation index, DC link voltage, current and power for closed loop control system with controlled modulation index.
Fig. 16. Changing in the wind speed with static inductive load.
8
Journal of Electrical Engineering www.jee.ro 9
At t=10 sec, the wind speed increases from 11 m/s to 12 m/s so, the controlled modulation index varied to track MPP at the new wind speed by changing the level of generated voltage and current as shown in the figures while the power coefficient is kept at its maximum value (48%).
variables and parameters of the model and the control system. Therefore, the proposed model and its basic control system can be used for further development.
VII. REFERENCES [1]
Garcia-Hernandez, R., & Garduno-Ramirez, R. (2011, November). Modeling and Control of a Wind Turbine Synchronous Generator. Electronics, Robotics and Automotive Mechanics Conference (CERMA), IEEE (pp. 222-227).
[2]
[7] Xia, Y., Ahmed, K. H., & Williams, B. W. (2011). A new maximum power point tracking technique for permanent magnet synchronous generator based wind energy conversion system. IEEE Trans. on Power Electronics, 26(12), 3609-3620. Adzic, E., Ivanovic, Z., Adzic, M., & Katic, V. (2009). Maximum Power Search in Wind Turbine Based on Fuzzy Logic Control. Acta Polytechnica Hungarica, 6(1). Najafi, H. R., & Dastyar, F. (2013). Dynamic maximum available power of fixed-speed wind turbine at islanding operation. International Journal of Electrical Power & Energy Systems, 47, 147-156. [11] Medhat. H. Elfar. (2010). Maximum Power Tracking Algorithm for Wind Energy System Based on Artificial Intelligence (Doctoral dissertation). Electrical Engineering, Port Said University, Egypt. Rajashekara, K. S., Rajagopalan, V., Sevigny, A., & Vithayathil, J. (1987). DC link filter design considerations in three-phase voltage source inverter-fed induction motor drive system. IEEE Trans. on Industry Applications, 23(4), 673-680. Steinke, J. K. (1999). Use of an LC filter to achieve a motor-friendly performance of the PWM voltage source inverter. IEEE Trans. on Energy Conversion, 14(3), 649-654. Thongam, J. S., & Ouhrouche, M. (2011). MPPT control methods in wind energy conversion systems. Fundamental and Advanced Topics in Wind Power, 339-360.
[3] [4]
[5]
[6]
[7] [8] [9]
Abdullah, M. A., Yatim, A. H. M., Tan, C. W., & Samosir, A. S. (2012, December). Particle swarm optimization-based maximum power point tracking algorithm for wind energy conversion system. In Power and Energy (PECon), IEEE International Conference on (pp. 65-70).
[10]
Wander, I. S. (2011). Modeling of synchronous generator and full-scale converter for distribution system load flow analysis (Master dissertation). Electrical and Computer Engineering, Ryerson University, Canada. Biswas, S. D., & Debbarma, A. (2012, Feb.). Optimal Operation of Large Power System by GA Method. Journal of Emerging Trends in Engineering & Applied Sciences, 3(1), p1. Eriksson, S., Kjellin, J., & Bernhoff, H. (2013). Tip speed ratio control of a 200 kW VAWT with synchronous generator and variable DC voltage. Energy Science & Engineering, 1(3), 135-143. Neammanee, B., Sirisumrannukul, S., & Chatratana, S. Control Strategies for Variable-speed Fixed-pitch Wind Turbines. Banu, I. V., Beniuga, R., & Istrate, M. (2013, May). Comparative analysis of the perturb-andobserve and incremental conductance MPPT methods. In Advanced Topics in Electrical Engineering (ATEE), 8th International Symposium on IEEE, (pp. 1-4). Pao, L. Y., & Johnson, K. E. (2009, June). A tutorial on the dynamics and control of wind turbines and wind farms. In American Control Conference, ACC'09. in IEEE. (pp. 2076-2089). Rashid, M. H. (Ed.). (2001). Power electronics handbook. Academic Press. Mishra, V. M., Tiwari, A. N., & Sharma, N. K. (2012). Novel Optimization Technique for PI Controller Parameters of AC/DC PWM Converter using Genetic Algorithms. International Journal of Power Electronics & Drive Systems, 2(2).
[11] [12] [13] [14]
[15]
Fig. 16. (Cont’d) Changing in the wind speed with static inductive load.
In the simulation results, the dynamic responses of the whole system variable parameters (synchronous generator rotor speed, generated DC link voltage, current and power) has depicted for step change in the wind speed and the static load. The results demonstrated the feasibility of the wind turbine generator model and confirm that the proposed control technique with such algorithm for this proposed WTG model has quite good validity and robust performance as it can not only track the MPP of each wind speed, but can conserve the MPP of the same wind speed with variations of the load.
[16] [17]
VI. CONCLUSIONS This paper presents the model of a wind turbine, with synchronous generator and full power converter, and its complete closed control system based on the converter model. Results of simulation studies for each subsystem of the proposed wind energy conversion system demonstrate satisfactory performance, with reasonable steady-state values and responses. The controller gains (Kp and Ki) are optimized using the Genetic Algorithm. The model is embedded in a user-friendly environment that provides easy access to the
9