Sustainability 2015, 7, 2066-2085; doi:10.3390/su7022066 OPEN ACCESS
sustainability ISSN 2071-1050 www.mdpi.com/journal/sustainability Article
Measurement and Numerical Simulation of Air Velocity in a Tunnel-Ventilated Broiler House Eliseo Bustamante 1,2,†,*, Fernando-Juan García-Diego 3,†, Salvador Calvet 1,†, Antonio G. Torres 1,† and Antonio Hospitaler 2,† 1
2
3
†
Institute of Animal Science and Technology, Universitat Politècnica de València, Camino de Vera s/n, 46022 Valencia, Spain; E-Mails:
[email protected] (S.C.);
[email protected] (A.G.T.) Department of Construction Engineering and Civil Projects, Universitat Politècnica de València, Camino de Vera s/n, 46022 Valencia, Spain; E-Mail:
[email protected] Department of Applied Physics (U.D. Industrial Engineering), Universitat Politècnica de València, Camino de Vera s/n, 46022 Valencia, Spain; E-Mail:
[email protected] These authors contributed equally to this work.
* Author to whom correspondence should be addressed; E-Mail:
[email protected]; Tel.: +34-96-387-9431; Fax: +34-96-387-7439. Academic Editor: Marc A. Rosen Received: 23 October 2014 / Accepted: 6 February 2015 / Published: 13 February 2015
Abstract: A building needs to be designed for the whole period of its useful life according to its requirements. However, future climate predictions involve some uncertainty. Thus, several sustainable strategies of adaptation need to be incorporated after the initial design. In this sense, tunnel ventilation in broiler houses provides high air velocity values (2–3 m·s−1) at animal level to diminish their thermal stress and associated mortality. This ventilation system was experimentally incorporated into a Mediterranean climate. The aim was to resolve these thermal problems in hot seasons, as (traditional) cross-mechanical ventilation does not provide enough air velocity values. Surprisingly, very little information on tunnel ventilation systems is available, especially in terms of air velocity. Using Computational Fluid Dynamics (CFD) and a multi-sensor system, the average results are similar (at animal level: 1.59 ± 0.68 m·s−1 for CFD and 1.55 ± 0.66 m·s−1 for measurements). The ANOVA for validation concluded that the use of CFD or measurements is not significant (p-value = 0.1155). Nevertheless, some problems with air velocity distribution were found and need to be solved. To this end, CFD techniques can help by means of virtual designs and scenarios providing information for the whole indoor space.
Sustainability2015, 7
2067
Keywords: sustainable design; adaptation and retrofit (A & R); broiler house; Mediterranean climate; tunnel ventilation; sensors; CFD
1. Introduction A building needs to be designed according to its requirements for the entire period of its useful life. Among these requisites, the geographical location and the climatic situation are prominent design features. Thus, the indoor environments of broiler house building are strongly conditioned by the climatology. Unfortunately, the uncertainty arising from climate change and global warming also causes uncertainty in the building design and the facilities installed [1,2]. For these reasons, farms in areas of climatic uncertainty (e.g., Mediterranean climate) need to adapt their designs by means of sustainable strategies. To this end, new models of ventilation systems were incorporated after the initial conception of the building-farm design. Obviously, these experimental design adaptations and experimental ventilation systems must be analysed using scientific procedures (CFD techniques and direct measurements). Nowadays, broiler rearing involves the use of highly developed technology. In fact, modern broiler buildings can be considered intelligent buildings in the fullest sense [3]. In these buildings, forced ventilation is the most commonly-used ventilation system [4–7], mainly through negative pressure-systems [6,7]. Mechanical ventilation allows higher density of the broilers than natural ventilation. Moreover, mechanicalventilation diminishes the thermal stress and mortality of the birds in summer seasons or extreme climate, as it improves the control and values of the ventilation rates. Recently, [8] affirmed that housing conditions had more impact than flock density on animal welfare. Despite the technical complexity of broiler buildings, discrete and repetitive episodes of high mortality occur every year in summer [9,10]. In the Mediterranean climate, these fatal episodes of thermal stress and broiler mortality have been accentuated under the effects of global warming and climate change. In this climate, cross-mechanical ventilation is the most widespread ventilation system in broiler production [11]. There are some important studies on the influence of excessively hot climate on broilers. [12] describes its influence on high mortality rates, a decrease in meat quality and reduced welfare; [13] refers to the losses in feed intake (−16.4%), losses in body weight (−32.6%) and higher feed conversation ratio (25.6%) when a broiler reaches an age of 42 days. [14] refers to the changes in the metabolism of the broilers and the need for thermoregulation to reduce the internal heat of the animals. In this thermoregulation, high air velocity values (~2 m·s−1) can help by increasing the convective flux heat of broilers and therefore decrease their thermal stress and associated mortality. [14] reports the effects on welfare of these high air velocities over the birds: they remove the hot air around the birds, adding to conventional heat loss, and they remove humid air from around the broiler’s head, making panting more efficient and imparting a sense of wind chill. To meet these high air velocity needs, tunnel ventilation has been experimentally incorporated in some Mediterranean climate areas. Moreover, it is also crucial to relate the number of fans in action with the associated air velocity values at broiler level. This is essential to determine the optimal programming of the fans and/or inlet automatisms of these tunnel broiler buildings.
Sustainability2015, 7
2068
Mediterranean climate refers to the weather typical of the Mediterranean area (Spain, France, Italy, etc.), although it is also found in other geographic areas worldwide: sections of Central Asia, Western and South Australia, South Africa, central Chile, California (USA), etc. France is considered a reference in broiler building ventilation technology and exports its building and ventilation system models. Other nearby countries with this climate (e.g., Spain, Italy, Portugal, Greece...) adopted these models and ventilation. However, cross-mechanical ventilation is only an acceptable system for the moderate variant of this climate [6,7]. Nowadays, new ventilation systems (mechanical single sided, tunnel variants, etc.) are tested in areas (e.g., Spain) where cross-mechanical ventilation entails thermal problems. A feature of these adapted buildings is that air inlets are located in the lateral walls near the opposite façade to the fans, because in the original cross-mechanical ventilation systems the tendency was to build an office or control room there, which would remain in place when tunnel ventilation was installed. In this work, we study a typical tunnel broiler building in Spain, using CFD techniques and a multi-sensor system [6] to determine the exact indoor environment of this imported ventilation system. To this end, CFD can be a powerful tool to analyse indoor environments of broiler houses and obtain the CFD results for the entire indoor space, whereas direct measurements only provide results for a limited number of points (the physical sensors). This analysis will serve to assess optimal management of the whole broiler building and, especially, the programming of the fans and inlets. Earlier works have broadly used CFD techniques to study the internal microclimate of livestock buildings [15–18] and poultry buildings with other ventilation systems [7,11,19,20] and with tunnel ventilation under negative pressure-systems in [21–23]. Tunnel ventilation from broiler buildings is found in different countries, such as Brazil [21,22], Korea [23], USA [24] and countries with a tropical climate [25]. According to these references, tunnel ventilation achieves high air velocity values. On the other hand, in some of these designs, the fans are placed on the opposite façade to the inlets [25]. Nevertheless, in this article we study a variant of tunnel ventilation with the inlets at the lateral end [25] because in the original building design (with cross-mechanical ventilation) the control room precluded any other disposition. To summarise: (i) we studied a typical tunnel broiler building in Spain; (ii) tunnel ventilation can be easily installed in all broiler buildings with only a retrofit of one wall to install the fans there; (iii) the study is carried out using CFD techniques and a multi-sensor system; (iv) the numerical results of air velocity are validated; (v) tunnel ventilation achieves high air velocity values to improve the birds’ welfare in hot seasons; (vi) future optimisation of design and assessments is required to improve this ventilation system; and (vi) CFD techniques can help by providing virtual designs and scenarios using information from the whole indoor space. 2. Materials and Methods 2.1. The Building A broiler building equipped with tunnel ventilation located at Alcalá de Xivert (Castellón-Spain) was studied. The upper left corner of Figure 1 shows the exterior façade, with the eight frontal exhaust fans and one lateral fan. In other corners are the interior of the building in three operations; the fans in operation were in white, to allow the sunlight to enter; and in the central image of Figure 1 is the multi-sensor system with sensors at two heights (0.25 m and 1.75 m).
Sustainability2015, 7
2069
Figure 1. Measurements in the tunnel broiler building. Building dimensions were: length, 120 m; width, 12.2 m; sidewall height 2.2 m; double pitched roof (slope 21.3%). The ventilation was equipped with ten exhaust fans (Model Euromunters EM 50n) with a diameter of 1.28 m, 1.1 kW of power consumption and nominal ventilation flow 42,125 m3 h−1 at ∆P = 0 Pa. Eight exhaust fans were located on the south façade (main façade) and the other two exhaust fans in the lateral façade, one fan in each lateral wall, near those located at the south façade as shown in Figure 1. The building was also equipped with twelve inlets measuring 4.7 × 0.45 m, placed at a height of 0.3 m, controlled by an automatic system of two groups of six inlets located in the lateral walls; all inlets were located near the north façade. The inlets are placed on the side walls because the control room is located behind the wall opposite the fans, preventing the fans being positioned there. According to Daghir [25], this is a variant of tunnel ventilation where the air entrance is equilibrated. The building was empty during the field experiments (as in other similar studies: [6,7,11,18,26]) to prevent the broilers undergoing sudden changes of pressure and air flow during the experiment. This broiler building was built in 1983, and until a few years ago had natural ventilation, after which it was equipped with cross-mechanical ventilation; currently, it also has tunnel ventilation installed. The main orientations of walls and roofs were determined using a compass (we designated them North-Wall, South-Wall, East-Wall, West-Wall, East-Cover, West-Cover and floor, according to the main orientation reached). 2.2. Experimental Scenarios (Operations) In this paper, the field experiments comprised nine experimental scenarios (operations) at different boundary conditions (BCs). By means of differential pressure sensors [6], differential pressure was fixed at a constant30 Pa—which, according to the farmer, was a typical differential pressure in the management of this building—and the number of fans running was gradually increased. First, two fans were activated,
Sustainability2015, 7
2070
and gradually we added one fan at a time until all eight fans on the south façade were on. Finally, the two lateral wall fans were also in action. (Operation I corresponds to two fans in action, Operation II with three fans in action, etc., until Operation IX, with ten fans in action). Operation I began with two fans because no typical real operation in the building uses a single working fan. In the cooler winter months, high air velocity values are not required; then, a minimum number of fans working (2, 3 or 4 fans located near the floor) is enough. In hot seasons, the air velocity requirements are higher and it is necessary to activate more fans (the 5 or 6 fans located near floor level), triggering the rest of the fans (the two higher fans and the two laterals) if the weather is very hot. The two higher fans can improve the efficiency of the refrigeration system if it is activated (to improve indoor movement of the air on the whole). To maintain the differential pressure at 30 Pa during these operations, the flaps of the inlets change by means of the automatic system. 2.3. CFD Background and Turbulence Models CFD FLUENT (Fluent Inc., Lebanon, NH, USA) [27] was used to carry out the CFD simulations in this article. CFD FLUENT [27] had been used with great success in previous CFD simulations of poultry buildings, as mentioned previously [7,11,19,20,23]. CFD techniques solve a set of partial differential equations (PDEs) [15,28]: equations of continuity (Equation (1)), conservation of momentum (Navier-Stokes law) (Equation (2)) and the energy equation (Equation (3)).
( ) Sm t
(1)
() () p ( ) g F t
(2)
(E ) ( (E p )) keff T h j J j ( ) S h t j
(3)
Where ρ: fluid density (kg·m−3); t: time (s); u, v, w: velocity (m·s−1); Sm: mass source (kg·m−3); p: pressure (Pa); τ: stress tensor (Pa); g: gravitational acceleration (m·s−2); F: external force vector (N·m−3); E: total energy (J); keff: heat transmission coefficient; T: temperature (K); h: specific enthalpy (J·kg−1); Sh: total entropy (J·K−1). Reynolds-averaged Navier-Stokes equation (RANS) turbulence models are commonly used in the study of indoor environments of livestock buildings. Moreover, from the RANS turbulence models, the RNG k-ε model was chosen to carry out the CFD simulations. The standard k-ε turbulence model has been used by some authors [7,11] because it offers reasonable precision and easy convergence [29]. However, in this article, the RNG k-ε model (a variant of the standard k-ε turbulence) was used because it performs well. The RNG k-ε turbulence model includes additional terms for the dissipation rates, describing more the physical phenomenon in greater detail and improving the accuracy of the results. It should be noted that none of the existing turbulence models are complete, i.e., their prediction performance is highly reliant on turbulent flow and geometry [15]. The transport equations of this turbulence model were 4 and 5 [27]:
Sustainability2015, 7
2071 Dk k k eff Gk Gb YM Dt xi xi
(4)
D k 2 eff C1 (Gk C3Gb ) C2 R Dt xi k K xi
(5)
where k: turbulent kinetic energy (m2·s−2); αk: the generation of kinetic energy due to the mean velocity gradient (kg·m−1·s−2); µeff: effective viscosity (m2·s); Gk: the generation of kinetic energy due to the variations of the components of the average velocity of the flow (kg·m−1·s−2); Gb: the generation of kinetic energy by boundary push (kg·m−1·s−2); ε: turbulent dissipation rate (m2·s−3); αε: the generation of kinetic energy due to buoyancy (kg·m−1·s−2); YM: contribution of the pulsatile expansion associated to the compressible turbulence (kg·m−1·s−2); R: the gas-law constant (8.314·103 J·kg·mol−1·K−1); C1ε: constant; C2ε: constant; C3ε = tanh[u1/u2]; u1: velocity of flow parallel to gi (gravitational vector); u2: velocity of flow perpendicular to gi. Moreover, the constant values were C1ε = 1.42, C2ε = 1.68 [27,29]. In this article, we carried out nine three-dimensional CFD simulations, corresponding to nine tested scenarios (nine typical conditions of operation of the building). 2.4. Geometry, Mesh and BC The geometry and mesh of the broiler building were performed in the pre-processor GAMBIT [30] (Geometry and Mesh Building Intelligent Toolkit) of FLUENT [27]. This building geometry was modelled in its real dimensions. The exhaust fans were modelled as circles 1.28 m in diameter and the twelve inlets were accurately modelled in the form adopted in each scenario as in similar studies [7,11,31]. Each scenario was mainly characterised by the number of fans operating, maintaining the differential pressure at 30 Pa [6]. In these setups, the ventilation rate was measured using the procedures of [32], although the fans are new and the values are very similar to those from the manufacturer. This measurement protocol [32] consisted of ducting the exhaust air 50 cm from the fan and then measuring by means of a hot wire anemometer at 24 different locations in the section, as indicated [33]. A mesh dependency test was performed, analysing four different meshes: Mesh 1 (516,055 cells & 105,427 nodes), Mesh 2 (908,025 cells & 174,979 nodes), Mesh 3 (1,937,181 cells & 363,604 nodes) and Mesh 4 (3,627,052 cells & 661,559 nodes). In this study, the numerical results are stabilised and minor differences are observed from Mesh 3 to Mesh 4. According to this mesh study, Mesh 4 was chosen. By this procedure, we ensure that the numerical results obtained are not affected by the grid. The meshing comprised unstructured tetra and prism layers. Applying thin prism layers to the first rows near the surfaces provides a more accurate result near the boundary layers. In this way, the quality of the mesh is also studied using the equiangular skewness command in GAMBIT [30]. The geometry and mesh domain built in GAMBIT [30] was exported to the CFD-solver FLUENT [27]. Moreover, it was considered that the flow (air) is steady, three-dimensional, viscous, turbulent, incompressible and isothermal. The air properties are considered constants. Table 1 shows the properties of the air and associated values. To link the pressure and the velocity, the SIMPLE algorithm was used [27] as well as the second order upwind scheme [28].
Sustainability2015, 7
2072 Table 1. Main inputs and BCs at CFD simulations.
CFD Simulation
Fans in Action
I II III IV V VI VII VIII IX
2 3 4 5 6 7 8 9 10
Total Mass Flux Rate (1) (kg·s−1) 24.68 37.02 49.36 37.02 61.70 74.04 86.38 98.72 111.06
Average of Air Velocity at Inlets (m·s−1) 0.83 1.23 1.61 2.04 2.45 2.85 3.25 3.67 4.04
(1) Measured by the procedures of [32].
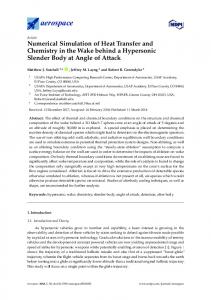
The air velocity at inlets (windows) and mass flux rate of each outlet (fans) were BC used to carry out the CFD simulations. For each operation and considering negligible fluctuations of values, we assumed that the air velocity at all inlets was the same and the mass flux rate was the same for the fans, as in earlier studies [7,11]. The input of the air velocity at inlets was obtained from the measurements at each inlet using a Testo 425 hot-wire anemometer [34] (calibrated in a wind tunnel by Testo AG Lenzkirch (Spain) [34] according to UNE EN ISO 9001:2001), and the average from all inlets is the required input. The input of the ventilation rate of each fan was obtained using the protocol of [32]. Table 1 indicates the main computational settings and the cited BC. Considering that the building was empty during the field experiments, the broiler presence was not modelled, nor other elements such as feeding and water equipment [7,11]. Obviously, CFD points with special relevance are the physical location points of the sensors. Figure 2a shows the grid in an inlet and Figure 2b the inlets in the building. In this Figure 2, we can observe that the inlets and associated flaps form an angle. This angle changes (from 4° to 38°) in order to maintain the differential pressure constant throughout the nine operations (30 Pa, in our field experiment).
Figure 2. (a) Grid in an inlet; (b) Inlets in the building.
Sustainability2015, 7
2073
2.5. Validation of CFD Results 2.5.1. General Context: the Multi-Sensor System and Points of Measurement The indoor turbulence intensity generated in mechanical ventilation of livestock buildings is very high (from 1% to 20%), with sudden changes in the air velocity values in the same coordinate throughout the experiment [6,7,35]. For this reason, a high-capacity measurement system is needed, both in number of sensors and number and quality of signals. The validation of CFD simulations [36] was thus carried out by means of a specific measuring system [6]. This measuring system consisted of air velocity sensors and differential pressure sensors and was able to acquire up to a maximum of 128 signals simultaneously at 5 s intervals. The sensors of air velocity were platinum resistance temperature detectors (RTD), the thin film detector was the Pt100 from Omega Inc. [37] and the differential pressure sensors were HCXM010D6Vs from Sensortechnics Inc. [38]. This measuring system is described in depth in [6]. In our case, only 32 sensors were read: 30 air velocity sensors and 2 differential pressure sensors [6]. The sensors were placed on 15 tripods at two heights: at adult broiler level 0.25 and at 1.75 m. These measurements were taken in three sections of the building: one section near the inlets, another section in a central zone (when the inlets were finished) and finally another section closer to the fans. The spatial distribution of the tripods was random, in an attempt to measure all areas of the test sections (central section, near the fans and the inlets). Moreover, Daghir [25] mentioned that the area of inlets and the area of fans are vital in the design of tunnel ventilation. At the centre of Figure 1, some tripods and the multi-sensor system in an operation are shown. During this field experiment (10 min registering in each operation) we received the signals from the sensors. In each of the three sections for each operation we received 3600 measurements of air velocity (30 s × 10 min × 60/5 data/min); thus, a total of 97,200 air velocity measurements (3600 × 9 scenarios × 3 sections) were taken at the 9 scenarios and three sections. Figure 3 shows the test section and Table 2 the sensor coordinates.
Figure 3. Test sections.
Sustainability2015, 7
2074 Table 2. Sensor coordinates.
Sensor number * 1–2 3–4 5–6 7–8 9–10 11–12 13–14 15–16 17–18 19–20 21–22 23–24 25–26 27–28 29–30
Section A
Section B
Section C
X-coordinate (m)
Y-coordinate (m)
X-coordinate (m)
Y-coordinate (m)
X-coordinate (m)
Y-coordinate (m)
5.56 5.39 5.83 5.61 10.66 8.16 7.18 5.50 2.22 2.52 3.45 10.61 8.74 1.54 2.81
4.34 8.42 13.64 16.51 22.78 18.65 19.17 20.20 3.87 7.06 11.24 3.55 9.86 19.54 15.76
5.92 5.62 5.73 8.57 9.47 10.60 9.00 9.04 1.50 3.47 3.92 11.48 5.83 1.54 0.82
32.14 36.54 43.25 39.36 43.32 40.22 39.36 36.88 29.20 33.65 39.21 34.83 48.17 52.00 47.00
5.87 5.42 5.69 5.58 9.89 8.78 10.03 6.21 1.86 2.94 3.75 11.26 9.13 2.34 3.11
99.23 103.90 108.76 110.33 118.02 115.14 116.25 118.93 96.48 101.15 107.40 98.06 105.18 117.49 113.07
* The first sensors at animal level, the second at 1.75 m.
During the operations in the same section there was no change in the tripods’ location, in order to measure and compare the fluctuations of values acquired as the number of fans in action increased. The 30 air velocity sensors (in their tripods) were moved from one section to another at each ventilation regime case. 2.5.2. Statistical Model and Variables In the present article, the validation model consisted of a statistical procedure by means of an analysis of variance (ANOVA). The validation model for this article is: Yijkl Si Fj Hk Ml (S F )ij (S H )ik (S M )il (F H ) jk (F M ) jl (H M )kl (S F H )ijk (S F M )ijl (S H M )ikl (F H M ) jkl (S F H M )ijkl ijkl
where the different variables and interactions are explained below: Yijkl : Air velocity in the section i with j Fans in action at Height k and by the methodology l; S i : Measurement section (3);
Fj : Fans in action (9); H k : Height of the sensor (2); M l : Methodology: CFD vs. direct measurements by multi-sensor system (2);
(S F )ij : Interaction between Section-Fan (27); (S H )ik : Interaction between Section-Height (6);
(S M )il : Interaction between Section-Methodology (6);
( F H ) jk : Interaction between Fans-Height (18);
(6)
Sustainability2015, 7
2075
( F M ) jl : Interaction between Fans-Methodology (18); ( H M ) kl : Interaction between Height-Methodology (4);
(S F H )ijk : Triple interaction between Section-Fan-Height (54); (S F M )ijl : Triple interaction between Section-Fan-Methodology (54); (S H M )ikl : Triple interaction between Section-Height-Methodology (12);
(F H M ) jkl : Triple interaction between Fan-Height-Methodology (36); (S F H M )ijkl : Fourfold interaction between Section-Fan-Height-Methodology (108);
ijkl : Error of the model.
Numbers in parentheses indicated number of factors. To study these effects, all factors were considered random. The model was analysed using the GLM procedure from SAS systems [39]. We shall perform an initial analysis to obtain first results. The non-significant interactions will then be eliminated from the model, and another analysis will be conducted to obtain the refined results. Using this procedure, the model will have improved results, making the significant effects more robust. 2.5.3. Regression Line (CFD vs. Measurements) To compare the CFD results and the measurements, a linear regression is proposed. The model of this linear regression is:
VCFD Vmeas
(7)
where, Vmeas is the average of the measured air velocity values VCFD is the air velocity obtained in the CFD simulations 2.5.4. Relative Error at Each Point The indoor turbulence in broiler buildings equipped with mechanical ventilation is high [6,7,35]. Thus, the fluctuations of the air velocity values at the same point over time may be relevant [6]. We used a robust measurement system in terms of number of sensors and in received signals; nevertheless, it is necessary to test a possible relative error in the i studied points. This relative error in the i point (Ei) can be defined as:
Ei
Vmeas VCFD Vmeas
(8)
where: Vmeas is the average of the measured air velocity using the multi-sensor system at point i taken as the real air velocity, and VCFD is the air velocity obtained in the CFD simulations at point i.
Sustainability2015, 7
2076
3. Results 3.1. Results of the Validation Model In Table 3, we can see the ANOVA results for the proposed validation model after the refinement. The main result is that the “Methodology” variable is not significant (p-value < 0.1155), nor are the interactions; i.e., there is no difference between using the CFD techniques or the direct measurements using the multi-sensor system. At this point and by means of these results from Table 3, we validated the CFD results for air velocity. Table 3. ANOVA of air velocity in different scenarios. Variables Section Fans Height Methodology Section × Fan Section × Height Fans × Height Error
DF 2 8 1 1 16 2 8 1581
Sum of Squares 33.10 555.09 1.07 0.28 45.75 21.18 5.88 175.50
Mean Square 16.55 69.39 1.07 0.28 2.86 10.59 0.73 0.111
F-ratio 149.07 625.08 9.61 2.48 25.76 95.42 6.62
p-value