Sep 18, 2007 - continuous measurements over a six-week period in the summer of 2006 covering the .... was written in Python language to: .... The x-axis on each plot shows the time elapsed in minutes during the hold measurement.
TECHNICAL REPORT
Doc #: Title: Measurement of Large Cryogenic Structures Using Spatially Phase-Shifted Date: Digital Speckle Pattern Interferometer (SPSRev: DSPI) Authors: Saif, B., Bluth, M., Greenfield, P., Hack, W., Eegholm, B., Blake, P., Keski-Kuha, R., Feinberg, L., Arenberg, J.
Phone: 410 338 4556
JWST-STScI-001222, SM-12 September 18, 2007 -
Release Date: 28 September 2007
This document was published in Applied Optics September 14, 2007.
1.0
Abstract
The James Webb Space Telescope (JWST) Backplane Stability Test Article (BSTA) was developed to demonstrate large precision cryogenic structures technology readiness for JWST. Its thermal stability was measured at cryogenic temperatures at Marshall Space Flight Center’s (MSFC) X-Ray Calibration Facility (XRCF) and included nearly continuous measurements over a six-week period in the summer of 2006 covering the temperature range from ambient down to 30K using the Spatially Phase Shifted Digital Speckle Pattern Interferometer (SPS-DSPI). The BSTA is a full size, one-sixth section of the JWST Primary Mirror Backplane Assembly (PMBA). The BSTA, measuring almost 3 m across, contains most of the prominent structural elements of the backplane, and is the largest structure ever measured with SPS-DSPI at cryogenic conditions. The SPS-DSPI measured rigid body motion and deformations of BSTA to nanometer level accuracy. The SPS-DSPI was developed specifically for the purposes of this test and other tests of large cryogenic structures for JWST.
Operated by the Association of Universities for Research in Astronomy, Inc., for the National Aeronautics and Space Administration under Contract NAS5-03127
Check with the JWST SOCCER Database at: http://soccer.stsci.edu/DmsProdAgile/PLMServlet To verify that this is the current version.
JWST-STScI-001222 SM-12
2.0
Introduction
The James Webb Space Telescope (JWST) [1, 2] is a three-mirror anastigmat with a 6.5 m diameter, deployable, active primary mirror operating at cryogenic temperatures. The primary mirror consists of 18 hexagonal segments mounted on the Primary Mirror Backplane Assembly (PMBA). The PMBA provides a thermally and temporally stable platform that maintains primary mirror segment alignment during the on-orbit observations. The PMBA distortions resulting from operational temperature variations are first order contributions to low- and mid- frequency primary mirror figure stability and overall telescope alignment stability. Digital Speckle Pattern Interferometry (DSPI) is a well-known technique for measuring deformations of diffuse objects under stress [3, 4]. The DSPI used in the test described in this paper is spatially phase-shifted, which enables accurate measurements in presence of vibration. This Spatially Phase Shifted Digital Speckle Pattern Interferometer (SPSDSPI) combines the classical speckle pattern interferometer for measurements of out-ofplane motions with a spatially phase-shifted interferometer [5, 6]. The speckle interferometer is designed and configured to measure the out-of-plane deformation and displacements of large test articles. The instrument was designed and built by 4D Technology (Tucson, AZ) [7], and is commercially available under the name SpeckleCam 5100. The object under test is illuminated with a high power pulsed Nd:YAG laser operating at the second harmonic (532 nm). The laser is seeded to keep it in a single mode. After seeding and doubling, the maximum energy output per pulse is about 0.9 J. The pulse duration is 9 nanoseconds and the pulse repetition rate is 10 Hz. The pulse repetition rate sets the upper boundary of the SPS-DPSI measurement rate. The coherence length of the laser is about 3 meters. [7]. A two element lens is used to generate an f#/5 beam to illuminate the structure under test. The f#-number of the beam can be controlled by changing the distance between the two lenses. The largest achievable f#-number is 8 for the present configuration of the instrument.
Check with the JWST SOCCER Database at: http://soccer.stsci.edu/DmsProdAgile/PLMServlet To verify that this is the current version.
-2-
JWST-STScI-001222 SM-12
2.1
The Backplane Stability Test Article (BSTA)
BSTA represents one sixth of the JWST backplane and it contains most of the prominent structural element types that make up the entire PMBA. The Backplane Stability Test Article (BSTA) is shown in Figure 1a. Figure 1b shows BSTA mounted on the BSTA Support Structure (BSS) that held the BSTA during the test. The BSTA construction is generally thin walled composite tubes bonded together with composite straps and gusset plates. The overall shape of BSTA is approximately triangular (roughly 2.88 m wide by 2.54 m tall). The structure consists of three large hexagons assembled so that each hexagon connects to the other two hexagons at two corners. Each hexagon has three Invar fittings designed to support a Primary Mirror Segment Assembly (PMSA). The structure weighs approximately 30 kg [8].
Figure 1. Photo (Fig. 1a) shows BSTA before being installed in the XRCF chamber. Drawing (Fig. 1b) shows BSTA suspended from the BSTA Support Structure (BSS). Vibration isolation of the BSTA in the XRCF was accomplished using a two-tier strategy: The suspension of BSTA was designed to have very low-frequency pendulum modes and includes springs in order to attenuate the high-frequency response. The lowfreq pendulum motions were damped by employing magnetic dampers in four locations on BSTA, providing damping in all three axial directions [8]. The SPS-DSPI was Check with the JWST SOCCER Database at: http://soccer.stsci.edu/DmsProdAgile/PLMServlet To verify that this is the current version.
-3-
JWST-STScI-001222 SM-12 installed on a vibration isolated instrument pier separate from the BSTA. The objective of these two isolation platforms was to minimize the relative movement between the test article and the instrument. 2.2
BSTA Test
The SPS-DSPI was characterized and calibrated using a single silicon gage called the Calibration Reference Article (CRA) developed for this purpose [9]. The CRA was placed in the XRCF chamber at a distance of 15.1 m away from the SPS-DSPI, i.e. corresponding to the center of curvature of BSTA. This was also the separation distance that was used for the BSTA test. The chamber was evacuated. By changing the temperature of the gage a few Kelvin, the height difference between four distinct islands on the gage was measured as a function of the temperature. The behavior of the single crystal silicon gage is very predictable. Depending on the imaging lens, the measurements deviated between 0.5% and 3.3% from the expected values, and demonstrated measurement standard uncertainty ranging from 0.5 nm/K to 5.5 nm/K. The results showed 2.1 nm RMS repeatability [9]. #9 Fitting set {3,6,9} used as common reference frame for comparing analysis and test
Data From Fitting #2 Excluded from Analysis
#7 #8
#5
#3 #4
#1 #2
#6
Figure 2. Schematic of the BSTA. The numbers refer to the PMSA fittings and associated pads. Figure 2 shows a schematic of BSTA. The three pads shown in each of the three hexes are Invar fittings, designed to hold the Primary Mirror Segment Assemblies (PMSA’s). Measuring the motions of the PMSA fittings was the primary objective of the test. A single crystal silicon plate (15 cm x 15 cm) was attached to each PMSA fitting to Check with the JWST SOCCER Database at: http://soccer.stsci.edu/DmsProdAgile/PLMServlet To verify that this is the current version.
-4-
JWST-STScI-001222 SM-12 facilitate monitoring their motions during the BSTA test. During the test, the whole BSTA structure was illuminated and pad motions were analyzed in detail. Although the illumination optics was designed to illuminate the whole BSTA structure, the illumination area had to be limited to avoid optical feedback into the SPS-DSPI laser from the corner cubes that were installed for global positioning monitoring needed for other, independent metrology. A consequence of this was that fitting #2 was not sufficiently illuminated to collect useful data.
Figure 3. BSTA test configuration. The BSTA test article shown mounted inside the XRCF chamber at MSFC. It is placed 15.1 m away from the instrument pier (seen to the left in the figure), where the SPS-DSPI is installed. Figure 3 shows the BSTA test configuration. After BSTA was placed in the chamber, the chamber was evacuated, and the BSTA structure was allowed to out-gas at ambient temperature, without any stimuli applied. During the out-gassing period, the SPS-DSPI was measuring the change in the BSTA. The rate of the BSTA pad motion the SPS-DSPI measured was used to determine when the BSTA was sufficiently out-gassed. After 5 days of out-gassing, the BSTA had reached equilibrium, and the test series could begin. The test was performed on a 24/7 basis, during a total of 6 weeks, excluding the SPSDSPI calibration. The BSTA was equipped with 132 temperature sensors placed throughout the structure. The temperature of each of these sensors was monitored, as well as the temperature of the Check with the JWST SOCCER Database at: http://soccer.stsci.edu/DmsProdAgile/PLMServlet To verify that this is the current version.
-5-
JWST-STScI-001222 SM-12 chamber, BSTA support structure and dampers. The SPS-DSPI was taking measurements at a rate of 5 exposures per second. The temperature profile during the BSTA test is shown in Figure 4. The temperature profile consisted of five individual cryogenic cycles down to 30 K. The first cycle was expected to stabilize the BSTA and so the four subsequent 30 K holds were used in the analysis. The lower end of each cycle was kept at approximately 30K during a time period of about 5 hours. The last warm-up included extended holds at approximately 36K to 54 K. The extended holds were included to generate two states that had minimal thermal gradients to facilitate comparison to analytically predicted responses. The temperature was changed from 40K to 60 K during a relatively long period of 23 hours.
Figure 4. Temperature profile for the BSTA test: The average temperature of the BSTA is shown as a function of time. The 30K holds used in the stability test as well as the 40K to 60K temperature ramp test is indicated by the vertical markers. ACAP denotes As Cold As Permitted (cooling was stopped when the lowest temperature sensor reached a reading of 25.5K).
Check with the JWST SOCCER Database at: http://soccer.stsci.edu/DmsProdAgile/PLMServlet To verify that this is the current version.
-6-
JWST-STScI-001222 SM-12 2.3
Data Analysis
The data acquisition and software algorithms are optimized with the purpose of conducting dynamic deformation measurements on large optical structures and related technology development structures for JWST. As these types of tests typically take several weeks of continuous round-the-clock data taking, because a number of cooling cycles have to be performed, a high capacity computer system is required for collecting, storing and processing the SPS-DSPI measurements. The data-taking rate is 5 measurements per second. A real-time monitoring capability allows the test personnel to monitor the test progress and the performance of SPS-DSPI instrument. Since every measurement is stored, it is always possible to re-process the data using a different algorithm or a different re-baselining period, if so desired. Data acquisition and spatial phase unwrapping routines available within 4D Technology's 4SightTM application were used, and a substantial amount of custom additional software was written in Python language to: - Increase the image capture rate to (5 images/second). - Maximize the data acquisition and processing throughput and manage the data files. - Construct detector, unwrapping and analysis masks - Provide monitoring functions so that operators could monitor data quality and be warned of abnormal conditions. - Apply different re-baselining criteria - Apply custom phase processing algorithms. - Allow unattended reprocessing of the data using different parameters. The masks used for the measurements are derived from NASTRAN ® Finite Element Models for the structure front surface. The tool is general in nature because of the way it enables masking of specific complex geometric structures under test. The software is used to determine the outlines of the front surfaces by eliminating all nodes on the interior or edges of the surface and only retaining the vertices. The polygons so generated are then appropriately geometrically transformed from the NASTRAN ® coordinate system to the image coordinate system (i.e., to pixel coordinates). The coordinate transformation is determined by iteratively adjusting the transformation parameters manually until a plot of polygons matches the image obtained of the structure to be tested. A geometric distortion model, as provided by 4D Technology for the interferometer imaging system, is applied to the transformed coordinates before plotting. The transformation parameters, along with the model polygons and distortion model, are used to derive the mask images used for processing. The raw mask in effect grows the island models to provide sufficient boundaries to ensure no data is lost due to possible shifts in the target image over time. The spatial mask is what is used to do the spatial Check with the JWST SOCCER Database at: http://soccer.stsci.edu/DmsProdAgile/PLMServlet To verify that this is the current version.
-7-
JWST-STScI-001222 SM-12 phase unwrapping. It corresponds most closely with the outline of the polygon models. The analysis mask is a shrunken version of the polygon model. This is to ensure that the phases used in the analysis of any given island are not contaminated by phase values in other islands due to the 9x9 pixel smoothing used to increase the signal to noise.
Flow diagram for ESPI analysis software Convert to phase image
Raw Data
Exclusion mask
Baseline image
Delta images
Unwrap phase image Yes Fit plane to reference island(s )
Yes
Process another?
remove fit plane from all islands levels islands relative to reference islands
Process another?
Baseline criteria met?
Failed
Full Stats file
Define new baseline
Delta Image
Write out corrected images
Read in delta image
Measure piston for each island
Write out results to stats file
Extract pad stats?
Stitch together baselines
Pad Stats file
Write out pad stats
Figure 5. The SPS-DSPI software processing and analysis flow for the BSTA measurements. 2.4
Data Processing
The BSTA measurement data consisted of raw exposures taken at a rate of 5 exposures per second, with each exposure containing only the raw phase information after masking out all non-target areas of the field of view. Processing this data requires setting a baseline, which serves as the zero-point for the phase difference with each subsequent exposure. This baseline needs to be redefined many times during the test in order to Check with the JWST SOCCER Database at: http://soccer.stsci.edu/DmsProdAgile/PLMServlet To verify that this is the current version.
-8-
JWST-STScI-001222 SM-12 avoid de-correlation of the phases, and for the BSTA test, fixed baseline periods were defined for the processing. This fixed period is shorter than the angular de-correlation period by a factor of 3. In the characterization of optical structures, where the dynamic deformation is of interest, it is necessary to measure the article under test over a period of time. Dependent on the test, this time period is typically days or weeks. The reference object interferogram - also known as the baseline - can be used for a number of measurements. To minimize decorrelation of speckle patterns, the baseline needs to be changed over time. Changing the baseline is called re-baselining. The angular de-correlation is used as one of the criteria for changing of the baseline. Another factor affecting the measurements is print-through noise. Re-baselining was done to minimize de-correlations due to this noise. Algorithms for optimizing the rate of re-baselining are part of the software developed for the SPS-DSPI. Any interferogram measurement can be used as a baseline, and by storing all measurements in a measurement series, the re-baselining can be changed in the data analysis process after the measurement series is completed, which enables optimization of the measurement performance. The flow chart of the BSTA data processing and analysis software is shown in Figure 5. The processing of this data consists of several steps; namely, - Convert each raw exposure to a phase - Calculate the phase difference between the new phase and the baseline phase - Unwrap the phase, using the exclusion mask, a.k.a. the detector mask - Remove the tilt - Check whether baseline criterion is met. If not, the most recent exposure is selected as new baseline, and a reprocessing is performed. - Level all islands - Measure the average relative piston of each defined island - Stitch together baselines Three different methods for establishing a reference plane were tested: 1) Reference to the three inner-most pads. 2) Reference to all pads. 3) Reference to the BSTA (the whole structure except the pads). The best results were obtained using the BSTA (option 3) as it comprised the most pixels and represented a better spatial distribution of pixels. The statistics for each of the pads are extracted. The baselines were stitched together in time by averaging 50 measurement points on either side of a re-baseline point. This stitching method is less rigorous than the stitching method applied to the Calibration Reference Article (CRA) test with SPS-DSPI reported in [9]. For comparison, the BSTA data were analyzed using both stitching methods, and they are in agreement to within the measurement accuracy. Check with the JWST SOCCER Database at: http://soccer.stsci.edu/DmsProdAgile/PLMServlet To verify that this is the current version.
-9-
JWST-STScI-001222 SM-12 3.0
Results
The results obtained from the stability test and the temperature ramp test are presented in the following sections. The stability test describes the PMSA fitting motions during 30 K temperature holds. Each 30 K hold is carried out for a time period of about 5 hours. The temperature ramp test describes the PMSA fitting motions during a 40 K to 60 K temperature change, carried out over a period of 23 hours. Figure 6 shows two images of the BSTA obtained with the SPS-DSPI. The x and y axis of each image denote the pixel number, spanning 1000 x 1000 pixels. To the left is shown a raw exposure, containing the pixelated information across the BSTA structure, placed 15.1 m away from the SPS-DSPI in the XRCF chamber, viewed through the 1x imaging lens. The lines indicate the mask. In the background is seen the BSTA support structure. The image to the right shows a phase-wrapped image, resulting from the difference between a raw exposure and the baseline (another raw exposure). Common motion (tilt) is evident in the fringe pattern. Common motion is removed in the data analysis to reveal the actual deformation of the BSTA structure.
Figure 6 shows two images of the BSTA obtained with the SPS-DSPI. The x and y axis of each image denote the pixel number, spanning 1000 x 1000 pixels. Figure 6 shows to the left a raw exposure, containing the pixelated information across the BSTA structure. The lines indicate the mask. In the background is seen the BSTA support structure. To the right in Figure 6 is seen a phase-wrapped image, resulting from the difference between a raw exposure and the baseline. Common motion (tilt), evident in the fringe pattern, is removed in the data analysis to reveal the actual deformation of the BSTA structure.
Check with the JWST SOCCER Database at: http://soccer.stsci.edu/DmsProdAgile/PLMServlet To verify that this is the current version.
- 10 -
JWST-STScI-001222 SM-12 3.1
BSTA pad motions during stability test
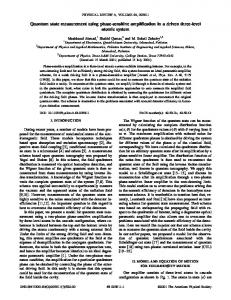
Figure 7 shows an SPS-DSPI measurement of the BSTA structure’s pads during the third 30 K temperature hold. Each plot in the mosaic of Figure 7 shows the movement (piston) in nanometers for each individual pad. The x-axis on each plot shows the time elapsed in minutes during the hold measurement. The y-axis shows the relative piston in nanometers. The trends for all the pads are similar. The stability measurements for the different 30 K holds in the temperature profile gave similar results. The key parameter for the stability test is the non-common motion between the pads, which represents the motion, which cannot be compensated. A measure of the non-common motion between the pads is found by calculating the variance of the measured Peak-to-Valley motions for the pads. The variance calculation represents the non-common motion as a mean square error and is reported as a RootMean-Square (RMS) value. The calculated RMS of the hold time considered was 32 nm/K-RMS. The measured slope RMS was also calculated and the result is 23.5 nm/K +/- 1 nm/K.
Figure 7. SPS-DSPI stability measurement on the BSTA structure’s pads (30K hold, ACAP3). The x-axis shows time in minutes during the hold, and the y-axis shows the piston in nanometers Check with the JWST SOCCER Database at: http://soccer.stsci.edu/DmsProdAgile/PLMServlet To verify that this is the current version.
- 11 -
JWST-STScI-001222 SM-12 3.2
BSTA pad motions during temperature ramp test
Figure 8a shows SPS-DSPI measurements of the BSTA structure’s pads during a temperature ramp test, where the temperature is changed from 40 K to 60 K. The ‘ramp’ is defined as a test of the structure during a change in temperature between two temperature holds, i.e. where the temperature gradients in the structure have been minimized. The 40K-60K ramp is identified in Figure 4. Each plot of the mosaic in Figure 8a shows the movement (piston) in micrometers for each individual pad. Figure 8b shows the ramp temperature as a function of time. The movement of the pads is largely correlated across the full BSTA structure. The non-correlated content was defined as the RMS of the deviations in the fittings using pad set {3, 6, 9} as the reference plane. For the 40K to 60K test, the temperature change was 13.59 K (from 41.55K to 55.14K). The measured pad motion is 350.86 nm RMS, or 25.82 nm/K RMS for all eight pads.
Figure 8a. SPS-DSPI measurement of the BSTA structure’s pads during a change in temperature form 40 K to 60 K. The x-axis shows time in minutes during the temperature ramp, and the y-axis shows the piston in micrometers. Check with the JWST SOCCER Database at: http://soccer.stsci.edu/DmsProdAgile/PLMServlet To verify that this is the current version.
- 12 -
JWST-STScI-001222 SM-12 Figure 8b shows the temperature as a function of time. 3.3
BSTA deformation test
Figure 9: Deformation measurements on the full BSTA structure taken as ‘snapshots’ during the 40 K to 60 K temperature ramp (over 23 hours). Above each picture is noted the specific temperature in Kelvin. The x-axis and y-axis of each picture in the mosaic shows the number of pixels. The color bar shown to the bottom right of the mosaic defines the color code scale of the deformation, shown in nanometer. Figure 9 shows the deformation measurements on the full BSTA structure taken as ‘snapshots’ during the 40 K to 60 K temperature ramp, which was performed during a period of 23 hours. Each picture in the mosaic shows the structure at a specific temperature. The color bar shown at the bottom right of the mosaic defines the color code scale of the deformation in nanometers. The dark red color corresponds to a deformation towards the observer (of 1,800 nm); the dark blue color corresponds to a movement away from the observer of 3,000 nm. The BSTA is used as the reference throughout the BSTA ramp test. During the 40 K to 60 K temperature ramp, all the PMSA fittings, with pads, bend away from the observer, largely due to the fact that Invar has a negative Coefficient of Thermal Expansion (CTE) while the BSTA tubes in the reference frame bulge forward. The deformation of the BSTA tubes is a result of the ‘hour-glassing’ nature of their behavior as a function of temperature. Check with the JWST SOCCER Database at: http://soccer.stsci.edu/DmsProdAgile/PLMServlet To verify that this is the current version.
- 13 -
JWST-STScI-001222 SM-12
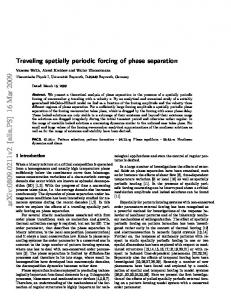
Fitting 2 not included due to non-illumination
Displacement magnitude [nm]
2000 1500 1000 500 0 -500
MUF = 1.4 All Error Bars are 2-Sigma Estimated Analysis Bias Error Included
-1000 0
As-Built Predicted
1
2
3
MC 95% Confidence Bandwidth
4 5 6 BSTA PMSA Fitting Label
Total Error Bar (Model Uncertainty Factor and bias)
7
8
9
Test Measurement
10 of the11 RMS 8 included fittings Reference Data Points
Figure 10: The result of the BSTA stability test shown per fitting (the location of the pads). Pad 3, 6 and 9 serve as reference plane. The open circles represent the measured displacement. The triangles represent the predicted displacement for the as-built BSTA structure. The BSTA stability results at 30 K were compared to the predictions found from the NASTRAN ® model [10]. The measured BSTA stability response to temperature change at cryo was 23.5 nm-RMS/K +/- 1 nm/K. The prediction from the model provided by the BSTA provider (ATK) was 20.9 nm-RMS/K +/- 16 nm/K, an excellent agreement between model prediction and measurement. Figure 10 shows the BSTA stability test results per fitting (the location of the pads). Pads 3, 6 and 9 serve as reference plane. The open circles represent the measured displacement. The triangles represent the predicted displacement for the as-built BSTA structure. Comparison between the measured and the predicted PMSA fitting motion on a per-fitting-level shows in general very good agreement between measurements and model: With a modeling uncertainty factor (MUF) of 1.4 applied to the predicted results, the maximum upper limit is 36.8 nm-RMS/K for the eight fittings included in the analysis. 4.0
Conclusions
An SPS-DSPI has enabled nm stability measurements of a large cryogenic structure, the JWST Backplane Stability Test Article (BSTA), at cryogenic temperatures. 4.1
Acknowledgements
We gratefully acknowledge the staff at NASA Marshall Space Flight Center’s X-Ray Calibration Facility for their contribution to this work: Ron Eng, Jeff Kegley, Harlan Check with the JWST SOCCER Database at: http://soccer.stsci.edu/DmsProdAgile/PLMServlet To verify that this is the current version.
- 14 -
JWST-STScI-001222 SM-12 Haight, William Hogue, Mark Baker, Ernie Wright, Richard Siler, Jay Carpenter, Greg St.John, Harry Rutledge, JohnTucker, Alan Shapiro, Kevin Russell, Barry Hale, Tom Hill, Joey Norwood, Miria Finkenor and Tom Kester, and Joe Geary, University of Alabama, Huntsville. 5.0
References
[1] P. Sabelhaus, J. Decker, “An Overview of the James Webb Space Telescope (JWST) Project”, Proceedings of SPIE, Vol. 5487, p 550-563 (2004). [2] C. Atkinson, S. Texter, R. Hellekson, K. Patton, R. Keski-Kuha, L. Feinberg, ”Status of the JWST Optical Telescope Element”, Proceedings of SPIE, Vol. 6265, 62650T (2006). [3] K. Creath, “Phase-Shifting Speckle Interferometry”, Applied Optics Vol. 24, p.3053 – 3058, 1985. [4] Steinbichler, H., Gutjahr, J. (1990). Patent No. US 5,155,363 A. United States of America. [5] B. Saif, “Simultaneous Phase-Shifted Digital Speckle Pattern Interferometry”, Ph.D. Dissertation, University of Arizona, 2004. [6] B. Saif, M. Bluth, B. Eegholm, B. Zukowski, R. Keski-Kuha, P. Blake, “Electronic Speckle Pattern Interferometry for JWST”, Proceedings of IEEE Aerospace Conference, Big Sky, Montana, March 2007, paper 5.0107 1-4244-0525-4/07. [7] M. N. Morris, J. Millerd, J. Hayes, and B. Saif, “Dynamic Phase-Shifting Electronic Speckle Pattern Interferometer”, In Proceedings of SPIE ‘Optical Manufacturing and Testing VI’, San Diego July 31 – August 4, 2005. Paper 58691B. [8] J. Arenberg, L. Gilman, N. Abbruzze, J. Reuter, K. Anderson, J. Jahic, J. Yacoub, H. Padilla, C. Atkinson, D. Moon, K. Patton, P. May, J. York, T. Messer, S. Backovsky, J. Tucker, C. Harvey, M. Bluth, B. Eegholm, B. Zukowski, B. Saif, R. Keski-Kuha, P. Blake, J. Kegley, K. Russell, “The JWST Backplane Stability Test Article: A Critical Technology Demonstration”. Proceedings of SPIE, Vol. 6265, 62650Q (2006). [9] B. Saif, B. Eegholm, M. Bluth, P. Greenfield, W. Hack, P. Blake, R. Keski-Kuha, M. North-Morris, "Calibration of spatially phase-shifted DSPI for measurement of large structures”, Applied Optics, Vol. 46, 5622-5630, (2007). [10] C. Atkinson, J. Arenberg, L. Gilman, T. Messer, P. May, D. Moon, K. Patton, J. York, S. Backovsky, J. Tucker, M. Bluth, B. Eegholm, B. Saif, R. Keski-Kuha, J. Kegley, “Technology demonstration of large stable cryogenic composite structures for Check with the JWST SOCCER Database at: http://soccer.stsci.edu/DmsProdAgile/PLMServlet To verify that this is the current version.
- 15 -
JWST-STScI-001222 SM-12 JWST”, Paper 6687-2 of Conference 6687, SPIE Optical Engineering and Appplications, San Diego, August 26-30, 2007.
Check with the JWST SOCCER Database at: http://soccer.stsci.edu/DmsProdAgile/PLMServlet To verify that this is the current version.
- 16 -