Apr 8, 2015 - lifter who was the national record holder and bronze medallist in the Olympic games. 48. K. Funato et al. Downloaded by [Nihon Taiiku ...
This article was downloaded by: [Nihon Taiiku Daigaku] On: 08 April 2015, At: 01:41 Publisher: Taylor & Francis Informa Ltd Registered in England and Wales Registered Number: 1072954 Registered office: Mortimer House, 37-41 Mortimer Street, London W1T 3JH, UK
Ergonomics Publication details, including instructions for authors and subscription information: http://www.tandfonline.com/loi/terg20
Measurement of specific movement power application: evaluation of weight lifters K. Funato , A. Matsuo & T. Fukunaga Published online: 10 Nov 2010.
To cite this article: K. Funato , A. Matsuo & T. Fukunaga (2000) Measurement of specific movement power application: evaluation of weight lifters, Ergonomics, 43:1, 40-54, DOI: 10.1080/001401300184657 To link to this article: http://dx.doi.org/10.1080/001401300184657
PLEASE SCROLL DOWN FOR ARTICLE Taylor & Francis makes every effort to ensure the accuracy of all the information (the “Content”) contained in the publications on our platform. However, Taylor & Francis, our agents, and our licensors make no representations or warranties whatsoever as to the accuracy, completeness, or suitability for any purpose of the Content. Any opinions and views expressed in this publication are the opinions and views of the authors, and are not the views of or endorsed by Taylor & Francis. The accuracy of the Content should not be relied upon and should be independently verified with primary sources of information. Taylor and Francis shall not be liable for any losses, actions, claims, proceedings, demands, costs, expenses, damages, and other liabilities whatsoever or howsoever caused arising directly or indirectly in connection with, in relation to or arising out of the use of the Content. This article may be used for research, teaching, and private study purposes. Any substantial or systematic reproduction, redistribution, reselling, loan, sub-licensing, systematic supply, or distribution in any
Downloaded by [Nihon Taiiku Daigaku] at 01:41 08 April 2015
form to anyone is expressly forbidden. Terms & Conditions of access and use can be found at http://www.tandfonline.com/page/terms-andconditions
E RGONO M ICS , 2000,
VOL .
43,
NO.
1, 40 ± 54
Measurement of speci® c movement power application: evaluation of weight lifters K. F U N AT O ² *, A. M AT SUO ³ and T . F U K U N AGA ² ² Laboratory of Sports Sciences, Department of Life Sciences, University of Tokyo, Komaba 3-8-1, Meguro-ku, Tokyo 153-8902, Japan ³ National Institute of Fitness and Sports, Shiromizu-cho 1, Kanoya city,
Downloaded by [Nihon Taiiku Daigaku] at 01:41 08 April 2015
Kagoshima, 891-23, Japan Keywords: Multi-articular movement; Dynamometer; Reproducibility; Speci® c movement power; Weight-lifting pull. A new dynamometer was developed for the measurement of speci® c movement power (SM P ) exerted by mono- or multi-articular movements. To determine the reproducibility of SM P, two identical test protocols were carried out on separate days for six movement types on seven adult males. The movement types were arm pull ( AP ), leg rise (LR ), knee extension (KE ), elbow ¯ exion (EF ), hip extension (HE ) and squat movement (SQ ). Variations in peak power obtained in two tests ranged from 0.7% ( AP ) to 9.6% ( SQ ). Coe cients of the test ± re-test correlation in peak power ranged from 0.805 (SQ ) to 0.961 ( AP ) and standard errors ranged from 4 W ( EF ) to 14 W ( SQ ). SM P in upper extremities increased from 166 W (EF ) to 307 W (AP ) resulting from the increase in velocity. However, in the movements of lower extremities, SM P increased from 506 W ( KE ) to 1351 W (SQ ) as a result of the increase in force. To evaluate the validity of the SM P, a pull movement in weightlifting was tested and related to the athletic performance on weightlifters. Positive linear correlation ( r = 0.862, p < 0.001 ) was observed between SM P and the total weight best records. It is concluded that this newly developed dynamometer has enough reproducibility and validity for evaluating the SM P, which is developed by various joint movement patterns related to the sport. The feasibility of applying this measuring protocol to the testing and training programmes for improving the daily living activities and athletic performances should now be assessed.
1. Introduction M uscle strength and power have been accepted as important factors in physical ® tness tests evaluating sports performance for athletes. Usually, these measurements are performed in mono-articular m ovem ents such as ¯ exion and extension at the elbow or knee joints ( Hill 1922 , K aneko 1970 , Thorstensson et al. 1976 , Perrine and Edgerton 1978 , Ivy et al. 1981 , Kaneko et al. 1983 , W ickiewicz et al. 1984 , Seger et al. 1988 ). Analysis of this type usually focuses on physiological and / or mechanical energy cap acity for individual muscles or muscle groups. On the other hand, vertical jum p ( Gray et al. 1962a , b, Davies and Rennie 1968 , Davies 1971 , Bosco et al. 1983,
*Author for correspondence. e-mail: funato @ idaten.c.u-tokyo.ac.jp Ergonom ics ISSN 0014-0139 p rint/ ISSN 1366-5847 onlin e Ó 2000 Taylor & F rancis Ltd http: //www.tan df.co.uk /journals /tf /00140139.htm l
Downloaded by [Nihon Taiiku Daigaku] at 01:41 08 April 2015
Specific movem ent power applica tion
41
Davies et al. 1984 ), stair climbing ( Bosco et al. 1983 , M argaria et al. 1966 ) and maximum pedal accelerations (Bosco et al. 1983 , Patton et al. 1985 , Bar-Or 1987 ) are often adopted in physical ® tness tests to evaluate the maxim um energy capacity developed during explosive whole body m ovem ent. These studies have usually been accepted as the test of maximum anaerobic power or capacity that can be developed during whole body movem ent in a short duration. Sports activities often consist of the actions of many diŒerent m uscle groups an d multi-articular movements. During these activities, the velocity and tension of muscle action are not constant throughout the entire range of motion. Thus, energy capacities measured in a muscle or a muscle group and in speci® c movement modes such as vertical jum p and pedalling do not necessary directly relate to the external energy outputs developed during speci® c athletic m ovem ent. One important factor to consider is that the movement-speci® c skill would restrict the transm ission of maximum energy capacity generated at the individual m uscle levels or measured in a diŒerent
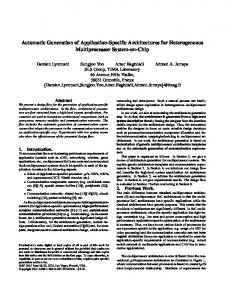
Figure 1.
A new dynamometer `Power Processor’ . See text for details.
42
K. Funato et al.
Downloaded by [Nihon Taiiku Daigaku] at 01:41 08 April 2015
movem ent mode. Therefore, a new methodology for a better understanding of athletic performance is needed, where mechanical power developed externally during sports-like m ovem ents, here nam ed the speci® c m ovem ent power ( SM P ), should be regarded as an important variable for the description and evaluation of athletic performance. In the present study, a new power-measuring device was developed to study SM P perform ed during mono- an d multi-articular movem ents. The reproducibility of measurements and force ± velocity ± power pro® les am ong various speci® c movements were examined as well as the application for weight lifters.
Figure 2.
Mechanical structure of the `Power Processor’ .
Downloaded by [Nihon Taiiku Daigaku] at 01:41 08 April 2015
Specific movem ent power applica tion
43
2. M ethod 2.1. M aterials A `Power Processor’ dynam ometer manufactured for this study is illustrated in ® gure 1. A basic structure of the Power Processor and its mechanical components are illustrated in ® gure 2. The main function of the Power Processor is the measurement of the force and velocity exerted by subjects in pulling for diŒerent loads. The body of the Power Processor is composed of an electrical rotary encoder that measures the axis revolving time and a load cell to measure the tension of the wire. A disk brake was used to stop the axial rotation immediately after a measurement and a miniature motor rewound the wire onto the axis for the next measurement. A wire wound onto a rolling bar can be loaded with diŒerent inertia. The quan tity of inertia is controlled by connecting diŒerent weights of plates to the axis onto which the wire was rewound. Three kinds of weights ( 42.5, 90.6, 261.5 N ) were applied, which corresponded to the equivalent masses of 50.7, 108.1 and 312.0 kg respectively. Equivalent mass ( EM , kg ) was calculated using: EM 5
2
1 /2 m ( R /r ) ,
where m is mass of the plate, R is radius of the plate (0.15 m ) and r is the radius of the inertia wheel ( 0.031 m ) where the wire was wound. According to the results of preliminary experim ents, the three loading conditions described above and two additional loading conditions (175.6 and 234.1 kg EM ) for rowing and weight lifting pull movements were selected to obtain the maximum power output in each movem ent mode adopted in this study.
Figure 3. Typical recordings of the instantaneous velocity, force and power curves (D, duration of time spent for force production; W, work; PP, instantaneous peak value on the power curve; Fp, instantaneous force when the PP occurred; Vp, instantaneous velocity when the PP occurred ). Work was calculated as follows: W = & P ( t )dt.
44
K. Funato et al.
Downloaded by [Nihon Taiiku Daigaku] at 01:41 08 April 2015
The axial revolving tim e was obtained from an interval of pulses generated from an electrical rotary encoder attached to the axis. A pulse was produced every 1 / 500 revolutions. The tension force of the wire was directly measured by m eans of load cell system mounted in the Pow er Processor. Data for the time of revolution and wire
Figure 4. Eight types of movements (AP, arm pull; LR, leg rise; KE, knee extension; EF, elbow ¯ exion; HE, hip extension; SQ, squat; WL, simulated weightlifting pull movement; ROW, rowing ). See text for details.
Specific movem ent power applica tion
45
tension were sampled every 5 ms and recorded digitally on the IC memory cards ( Type 7300 , Fujisoku Co., Japan ).
Downloaded by [Nihon Taiiku Daigaku] at 01:41 08 April 2015
2.2. Calculations of mechanical variables The data stored in the IC memory card were transferred to a personal computer ( PC9 801VM , NEC Co., Tokyo, Japan ) using an oŒ-line system. Linear velocity of the wire was calculated from the tim e of axial revolution. Instantaneous power was obtained by multiplying the instantaneous linear velocity [V ( t )] and force [F ( t )] for every 5 m s ( ® gure 3 ). Peak power (PP ) was recorded as the instantaneous peak value in power curve. Force ( Fp ) and velocity (Vp ) were recorded respectively as the instantaneous value at which the PP occurred during one identical eŒort of movem ent ( ® gure 3 ). 2.3. Procedures 2.3.1. M easurement validity: M easurements were obtained during the following movements as illustrated in ® gure 4.
· ·
· · · ·
·
Arm pull ( AP ): AP movement was measured with the subject in the supine position. A cloth belt, connected to the device’ s tension wire, was attached to the wrist. Subjects pulled the wire, with the elbow at full extension, while undergoing shoulder flexion from 135 to 0 8 in the sagittal plane. Leg rise ( LR ): LR movem ent was measured with the subject in the supine position. A cloth belt, connected to the device’ s tension wire, was attached to the ankle. Subjects pulled on the wire by raising the leg at a hip joint, with the knee joint in full extension, starting at a hip angle of 0 8 ( fully extended position ). Knee extension ( KE ): The subject was in a seated position. A cloth belt, connected to the device’ s tension w ire, w as attached to the an kle. M easurements were initiated at 90 8 of knee flexed position. Elbow flexion ( EF ): The subject was in a seated position. A cloth belt, co nnecte d to the device’ s tension w ire, w as attached to the w rist. M easurements were initiated at fully extended position of elbow. Hip extension ( HE ): The subject extended the hip joint while in a prone position against the load with the wire and cloth belt connected at the knee joint. The movement was initiated with the hip joint in a fully flexed position. Squat ( SQ ): SQ movement was measured by connecting the wire to a waist belt from the supporting platform of the subject via a pulley. The subject performed squat movem ent by extending the hip, knee and ankle joints sim ultaneously from an initial position of 90 8 of flexion at the hip and knee, with the trunk kept straight. Rowing ( ROW ): The subject sat on a sliding sheet of the specially designed rowing stretcher and handed the bar connected to the wire of the Power Processor. RO W movement was started in a position of knee angle of 90 8 and performed by extending hip, knee and ankle joints sim ultaneously.
The arrows in ® gure 4 indicate the direction of pull on the device’ s tension wire. All movem ents except for squat ( SQ ) and rowing ( ROW ) were measured on the right arm or leg; the trunk was ® xed on the measuring plate with a belt. To obtain reliable data, careful attention was paid to control the movement as
46
K. Funato et al.
Downloaded by [Nihon Taiiku Daigaku] at 01:41 08 April 2015
instructed above. This was because variation in angle such as range of m otion or starting position of the movement could aŒect the measurem ents. Strict registration and control of angular variation was emphasized to the subjects by two or three testers. After the subjects were carefully instructed to perform each movem ent, they were familiarized with the testing procedure. For each load, warm-up exercises were followed by three trials at m aximal eŒort. The maximum value of power was used for analysis. These measurements were repeated twice ( test 1 and test 2 ) within an interval of 3 ± 6 days. Seven males who did not perform regular daily exercises were used as subjects. Their ages and body masses ranged from 25 to 48 years and 63.0 to 79.0 kg of body masses, respectively. They were fully informed of the procedures and signed a consent form prior to participation. 2.3.2. Application to weightlifting pull: Tw enty-six weightlifters participated as subjects for the estim ation of the athletic performance of weightlifting. They consisted of 12 elite Japan ese lifters ( 23 ± 30 years and 52.5 ± 109.8 kg body mass ) and 14 district Japanese lifters ( 19 ± 21 years, 57.5 ± 86.8 kg body mass ). The device was used to measure power produced during a simulated weightlifting pulling movem ent ( W L ) and the results were studied in relation to athletic perform ance. As is shown in ® gure 4, W L movem ent showed the pull from the
Table 1.
Reproducibility of peak power (PP ), force (Fp ) and velocity ( Vp ) between test 1 and test 2. Test 1
Peak Power (W ) AP LR EF HE KE SQ Force ( N ) AP LR EF HE KE SQ Velocity ( ms AP LR EF HE KE SQ
203 196 117 456 437 1215
Ð
124.5 171.3 141.3 375.5 324.8 923.0 1
Test 2 205 191 119 450 433 1098
124.2 161.3 154.3 353.1 325.0 825.9
Variation ( % )
r
0.7 2.3 1.9 1.3 0.9 9.6
0.961*** 0.889*** 0.946*** 0.905*** 0.812*** 0.805***
5 6 4 9 8 14
0.2 5.8 9.2 6.0 0.1 10.5
0.688*** 0.825*** 0.825*** 0.865*** 0.884*** 0.903***
3.6 5.7 3.5 6.3 5.8 11.6
0.2 3.2 9.8 7.1 2.3 6.2
0.941*** 0.922*** 0.940*** 0.946*** 0.969*** 0.972***
SE
) 1.642 1.191 0.898 1.230 1.481 1.510
1.639 1.229 0.810 1.317 1.447 1.604
0.523 0.508 0.373 0.358 0.394 0.339
Means of PP, Fp and Vp in both test 1 and test 2 were obtained from three diŒerent kinds of equivalent masses. Variation (% ) was calculated in a following manner; (|test 1 Ð test 2| /test 1 )*100. r is the coe cient of variables obtained between test 1 and test 2. SE represents the standard error of prediction between test 1 and test 2. ***p < 0.001.
Specific movem ent power applica tion
47
Downloaded by [Nihon Taiiku Daigaku] at 01:41 08 April 2015
starting squat position to ® nal pull position in weightlifting. The wire pulled from the Power Processor was connected to the bar each subject held via a pulley from the supporting platform of the subject. The subject held the bar with both hands and was instructed to pull in a m anner similar to an actual weightlifting movement. The pulling movement included only the `C lean’ action and ended at a position where the upper part of the body was stretched backward with the bar positioned at chest level. 3. Results 3.1. Validity of power measurem ent For peak power (PP ), force ( Fp ) and velocity ( Vp ), mean values of all subjects obtained from each of two trials ( test 1 and test 2 ) and their respective reproducibility is given in table 1. No statistical diŒerences in PP, Fp and Vp were observed between test 1 an d test 2 for each movement ( Student’ s unpaired t-test, Pearson’ s product moment correlations, p > 0.01 ). The mean values of the variation between test 1 and test 2 for all movements were 2.8% [ranged from 0.7% (AP ) to 9.6% (SQ )] for PP, 5.3% [ranged from 0.1% ( KE ) to 10.5% ( SQ )] for Fp and 4.8% [ranged from 0.2% ( AP ) to 9.8% (EF )] for Vp. Correlation coe cients for test 1 and test 2 were also summ arized in table 1, indicating statistically signi® cant correlation ( p < 0.001 ) for all movem ents. Standard errors of prediction between test 1 and test 2 ranged from 4 ( EF ) to 14 W (SQ ) for PP, 3.5 ( EF ) to 11.6 N (SQ ) for Fp and 0.339 ( SQ ) to 0.523 ms Ð 1 ( AP ) for Vp.
Figure 5.
Means and SDs of peak power in three diŒerent kinds of equivalent masses for each kind of movement.
48
K. Funato et al.
Downloaded by [Nihon Taiiku Daigaku] at 01:41 08 April 2015
3.2. PP, Fp and Vp during each movement Figure 5 showed the changes in PP ( mean and SD ) in three diŒerent kinds of equivalent mass for each kind of movem ent. PP was found to be the lightest equivalent mass ( 50.7 kg ) condition for EF, AP, LR and K E. HE was the lightest or middle ( 108.1 kg ) condition and was at middle or the heaviest ( 312.0 kg ) condition for SQ. The SQ indicated the largest PP ( 1351 6 170 W ). Both KE ( 506 6 38 W ) and
Figure 6. Force ± velocity and force ± power relations obtained from diŒerent kinds of equivalent masses for EF, AP, KE, SQ, ROW and WL movements. Each velocity and force value (mean and SD ) represented the instantaneous values obtained from identical trial when the peak power was occurred. Data on WL was obtained from an elite weight lifter who was the national record holder and bronze medallist in the Olympic games.
Downloaded by [Nihon Taiiku Daigaku] at 01:41 08 April 2015
Specific movem ent power applica tion
49
Figure 7. Relationship between peak power developed during the simulated pull movement in weightlifting and athletic performance in weightlifting. Athletic performance was assessed as the total weights lifted in a weightlifting competition held during a year.
HE ( 528 6 146 W ) were ~ 40% of SQ. For AP (307 6 57 W ) and LR (313 6 73 W ), they were ~ 25% of SQ an d EF (166 6 39 W ) was ~ 10% of SQ. Force ± velocity and force ± power relations for upper ( EF and AP ) and lower ( KE and SQ ) lim b movements together with the rowing and the weight lifting pull movements were shown in ® gure 6. Force, velocity and power for each movement were obtained from three diŒerent equivalent mass loaded conditions ( ® ve loaded conditions for ROW and W L ). At the comparison between SQ and KE, although the velocities were alm ost sim ilar, the force for SQ was ~ 2.5 times greater than that for KE. At the comparison between EF and AP, Fp were almost similar, but maximum Ð Ð 1 1 Vp for AP ( 2.80 ms ) was about two times greater than for EF (1.27 ms ), resulting that AP ( 307 W ) generated about tw o times greater values in maximum PP than that for EF (166 W ). 3.3. Power during simulated pull movem ent in weightlifting The relationship between peak power obtained during a W L movement and an actual athletic weightlifting performance is presented in ® gure 7. The athletic performance was assessed as the total weights lifted by snatch and clean-and-jerk during the same competition. There were statistically signi® cant correlation between the two variables ( r = 0.862 at p < 0.001 ). The district level lifters tended to be greater in deviation from the regression line than elite level lifters and were plotted lower left side in ® gure 7. 4. Discussion 4.1. Reproducibi lity of the measurement Generally reproducibility of the m easurement was evaluated by variation or coe cient of correlation between the values obtained by two identical trials ( Thorstensson et al. 1976 , Bassey and Short 1990 , Gleeson and M ercer 1992 ). In this experiment, variability and reliability in SM P respectively were exam ined in term s of
Downloaded by [Nihon Taiiku Daigaku] at 01:41 08 April 2015
50
K. Funato et al.
variation and coe cient of correlation between the values obtained from two identical tests. No statistical diŒerence between duplicated SM P measurement shows the variability in SM P can be assum ed to represent methodological and biological source error. The overall variation in duplicated SM P measurements in this study was 2.8% , which compares favourably with those reported in other studies. In knee extensor isokinetic testing, Thorstensson et al. ( 1976 ) reported that variation of measurements on two occasions on diŒerent angle of the knee joint or lever arm velocity averaged 10% . In multi-articular explosive movement such as vertical jump, on the other hand, individual variation of peak power averaged 6.6% ( Davies et al. 1984 ). M argaria et al. ( 1966 ) reported that variations in two measurem ents of power calculated by the movement of stair clim bing was within the range of 6 4% . In this study, test and re-test correlation in SM P ranged between 0.805 for SQ and 0.961 for AP and standard errors of prediction ranged between 3.5 W for EF and 13.9 W for SQ. Previous studies report a similar range for index reliability coe cients. For example, for the peak torque during knee extension by using Cybex dynam ometer, the correlation coe cient in two identical trials has been reported to be as high as 0.99 (Lesm es et al. 1978 ). The studies that measured power during a explosive leg extension with the hip, knee and ankle joints extended at a time discussed the reproducibility by the correlation coe cient of 0.88 ± 0.95 for additional loading method ( Avis et al. 1985 ) and 0.995 for the device by inertialoading method ( Bassey and Short 1990 ). In vertical jump, the correlation coe cient between two identical power m easurements was 0.95 (Bosco et al. 1983 ) and 0.985 ( Gray et al. 1962a ). Reproducibility of power obtained by the maximum pedalling of the bicycle ergometer was r = 0.91 ( Patton et al. 1985 ). In light of these reports, reproducibility is sim ilar for other movements to that of other power-measuring methods, which indicates that it is a method with relatively high reproducibility. 4.2. M eaning s of SM P measurement The tension generated by muscular contraction is transmitted outside the body via the bones and joints. General methods for measuring muscle strength, performed in restricted conditions such as measuring posture, the range of motion and movem ent velocity, aim at exploring output features of physiological and /or mechanical characteristics of muscle itself from physical variables such as force, velocity and power exhibited outside the body ( Thorstensson et al. 1976 , Perrine and Edgerton 1978, W ickiewicz et al. 1984 ). In actual sport m ovem ents such as weightlifting, however, each muscular group generates tension in diŒerent arrangements of time and space ( Baumann et al. 1988 , Enoka 1988 ). In the present study, a new powermeasuring device was designed to m easure mechanical power output produced during such a movement which involves two or more joints. The device employs an inertial loading system because of the consideration that many sporting movem ents are frequently performed under the condition of inertial loading. Since power is de® ned as an am ount of work done within a given period of time, it is necessary to directly measure the force, change in position, and time in order to obtain accurate power values. Conventionally, in the measurement of mechanical power for example, for vertical jump ( Gray et al. 1962a , Davies and Rennie 1968 , Bosco et al. 1983 , Davies et al. 1984 ) and maximum acceleration pedalling ( Davies et al. 1984 , Nakam ura et al. 1985, Bar-Or 1987 ), m any studies report the power calculated from one direct measurem ent of the two essential factors, i.e. force or velocity. The Power Processor in this study directly measures the above two
Downloaded by [Nihon Taiiku Daigaku] at 01:41 08 April 2015
Specific movem ent power applica tion
51
variables. Additionally, in comparison with the conventional-m easuring device using inertial loading ( e.g. Hill 1922 , Kaneko 1970 ), the device has an advantage of possible transfer of the wire up and down as the body shift pillar allows the dynam ometer easily to shift in the perpendicular direction. Also it is considered that as the wire rewinding equipment allows power-m easuring in the repetitive movement, it is a convenient method for m easuring a large number of subjects in a short time. A general approach to the evaluation of athletic performance has been made from diŒerent viewpoints of physical resources ( e.g. m uscle strength, speed, power and work, etc., which were mostly determined from single joint m ovem ents such as knee extension or elbow ¯ exion ) and speci® c sport movement skills. As athletic performance, however, is composed of speci® c skills based on certain physical resources, it is necessary to measure it using a system where both are integrated in order to assess the SM P such as reported by Lander et al. ( 1985 ) and Toyoshima and M iyashita ( 1973 ). M ovement patterns used in the present m easurement were studied as sports-like movements such as rowing and weight lifting pull. It is necessary to take various SM P measure, constituting the respective sport movements, for further evaluation of respective athletic performance. As this device allows such measurement, it also contributes to both the evaluation of the training eŒect and the improvement of athletic performance. 4.3. Com parison of power with other testing protocols M easurement of muscular power by use of an inertial loading has mainly been done on one joint of the elbow an d knee. Kaneko ( 1970 ) reported that maxim um power of elbow extensors was ~ 160 W for adult m en. In the present study, a similar value ( 165.5 W ) for EF m ovem ent was observed. As for power exhibited during the whole body explosive movement, Avis et al. ( 1985 ) reported the instantaneous peak power ( 1746 ± 2611 W ) during a explosive bilateral leg-press movem ent on adult males using the newly developed ad ditional loading dynam ometer. In the present study, SQ Ð 1 produced 1351 W ( 19.3 W kg B.W . ) in peak power, which is lower than that obtained by the above described m ethod. If gravity would be included, however, the actual power output would appear to be larger. This suggestion was supported from the comparison of force ± power relations obtained from horizontal pull ( ROW ). A higher value in power was observed in ROW than SQ as the results of increased velocity particularly developed at an identical lower force output level ( ® gure 6 ). Grieve and Linden ( 1986 ) developed a dynam ometer that made use of aqueous viscosity loading system and measured power during three m ovem ents of pulling by the upper extremities within a limited range of articular movement of each arm joint. They reported the peak power varied within the range of 120 ± 500 W and concluded that the num ber of joints and muscular groups involved in the movement were responsible for the magnitude of the power. It is considered that as larger power was obtained in the order of the EF and AP for the upper extremities and the LR , KE, HE and SQ for the lower extremities in the present study, power developed during a movement involving two joints or more depends on the number of muscular groups and joints involved. 4.4. Com parisons of force ± velocity and force ± power relations The optim um condition for velocity and force when the maximum power is produced is an important factor when determ ining the power output of human
Downloaded by [Nihon Taiiku Daigaku] at 01:41 08 April 2015
52
K. Funato et al.
movem ents. Davies et al. ( 1984 ) measured force and velocity at instantaneous maximum power production during vertical jump and isokinetic maxim um bicycle pedalling. The power was measured to be as large as 800 W on the bicycle ( vertical jum p 2205 W , pedalling 3059 W ) and the force, as large as ~ 300 N ( vertical jum p 1073 N , pedalling 1344 N ). In contrast, the velocity was found to be ~ 0.2 m / s lower Ð Ð 1 1 on the bicycle ( vertical jump 2.48 ms , pedalling 2.28 ms ). This ® nding implies the diŒerences in the shape of force ± velocity relations between vertical jum p and pedalling even in the same subjects. In this study ( ® gure 6 ), it is possible to examine the movement characteristics from view point of optimum force and velocity conditions when the maximum power output was occurred. That is, for a com parison on the upper extrem ities, power increase from the EF to AP results from increases in velocity. In the movem ents of the lower extremities, to the contrary, it can be said that power increases from the KE to the SQ results largely from increases in force. Similar studies on the force and velocity at maximum power production have been undertaken by Dotan and Bar-Or ( 1983 ) where optimum loads and velocity conditions for the assessment of to detect the maxim um power in lower ( maximum leg pedalling ) and upper ( arm cranking ) limb movem ents were examined. They reported that the greater power of the leg pedalling, compared with arm cranking was achieved by increasing the applied forces ( 41.7 ± 78.7% ) more than by elevation of the corresponding pedalling rates ( 18.9 ± 24.2% ). Their results are consistent with those of the study reported here, when the maxim um power output was compared between the low er limb movem ent and the upper lim b one. The gravitational eŒect must be stressed at the lighter loaded condition in SQ from the comparison of ROW ( horizontal pull ) in ® gure 6. It can be said that for SQ, LR and W L movements, the power calculated was underestimated by not incorporating the power involved in an individual raising their own body mass. W ith the comparison of force ± velocity relation between SQ and W L in ® gure 6, improvement in velocity at an identical force output was characterized as the result of the speci® c resistance training in an elite weight lifter ( he won a bronze medal in the 1984 Olympic Gam es in Los Angeles and national record holder of the previous category of 82.5 kg: snatch 165.5 kg, clean-and-jerk 205.5 kg, Total 370 kg ). The production of the higher power output as the results of higher velocity at an identical force output in a weight lifter represents the speci® c movem ent skills, which are obtained as the results of resistance training in weight lifting. 4.5. Application of SM P to weightlifting athletic performance In a weightlifting contest, victory or defeat is determ ined by the weight an athlete can lift overhead. The main in¯ uence on this is to give as large acceleration as possible to the bar by an orderly activation of every muscle groups involved (G arham m er 1981 , Baumann et al. 1988 ). However, the primary factor aŒecting these results is how the bar is accelerated from a stationery position in the early stage of the pulling movem ent ( Baumann et al. 1988 ). In coaching weightlifting, this aspect of the movem ent is taken as the `® rst pull’ and the main movement is an extension of the lower extremities as a large group of muscles. The peak power exhibited in a simulated movem ent, including the ® rst pull, was closely correlated with athletic perform ance, which suggests that the power obtained by a pattern similar to an actual athletic movem ent ( i.e. athletic speci® c movement power; ASM P ) stands
Specific movem ent power applica tion
53
accurately for the athletic performance. Further, variation from the regression line tended to increase for the district level lifters as compared with the elite level lifters. This ® nding suggests that AM SP that can be exhibited by the district level lifters is not re¯ ected in their athletic performance. The results of the present study suggest that in searching for body resources aŒecting athletic performance, this device is capable of giving an appropriate assessment for the AM SP which is measured under the involvement of many joint movement patterns related to the sports movement. M oreover, use of this measuring device may lead to an expectation of better evaluation of training for the improvement of athletic performance.
Downloaded by [Nihon Taiiku Daigaku] at 01:41 08 April 2015
References A VIS , F. J., H OVING , A. and T OU SSA IN T , H. M. 1985, A dynamometer for the measurement of force, velocity, work and power during an explosive leg extension, European Journal of Applied Physiology, 54, 210 ± 215. B AR -O R , O. 1987, The Wingate anaerobic test an update on methodology, reliability and validity, Sports Medicine, 4, 381 ± 394. B ASSEY , E. J. and S H ORT , A. H. 1990, A new method for measuring power output in a single leg extension: feasibility, reliability and validity, European Journal of Applied Physiology, 60, 385 ± 390. B AUM AN N , W., G ROSS , V., Q U AD E , K., G ALBIER Z , P. and S CHW IR TZ , A. 1988, The snatch technique of world class weightlifters at the 1985 world championships, International Journal of Sport Biomechanics, 4, 68 ± 89. B OSCO , C., L UH TA NEN , P. and K OM I, P. V. 1983, A simple method for measurement of mechanical power in jumping, European Journal of Applied Physiology, 50, 273 ± 282. D A VIES , C. T. M. 1971, Human power output in exercise of short duration in relation to body size and composition, Ergonomics, 14, 245 ± 256. D A VIES , C. T. M. and R EN NIE, R. 1968, Human power output, Nature, 217, 770 ± 771. D A VIES , C. T. M., W EMY SS -H OLD EN , J. and Y OUN G , K. 1984, Measurement of short term power output: Comparison between cycling and jumping, Ergonomics, 27, 285 ± 296. D O TAN , R. and B AR -O R , O. 1983, Load optimization for the Wingate anaerobic test, European Journal of Applied Physiology, 51, 409 ± 417. E NOK A , R. M. 1988, Load- and skill-related changes in segmental contributions to a weightlifting movement, Medicine and Science in Sports and Exercise, 20, 178 ± 187. G A RHA MM ER , J. 1981, Biomechanical characteristics of the 1978 World Weightlifting Champions, in A. Morecki, K. Fidelus, K. Kedzior and A. Wit (eds ), Biomechanics VII-B, Proceedings of the International Conference of Biomechanics ( Baltimore: University Park Press ), 300 ± 304. G LEESON , N. P. and M ERCER , T. H. 1992, Reproducibility of isokinetic leg strength and endurance characteristics of adult men and women, European Journal of Applied Physiology, 65, 221 ± 228. G R AY , R. K., S TART , K. B. and G LENCRO SS , D. J. 1962a, A test of leg power, Research Quarterly, 33, 44 ± 50. G R AY , R. K., S TA RT , K. B. and G LEN CROSS , D. J. 1962b, A useful modi® cation of the vertical power jump, Research Quarterly, 33, 230 ± 233. G R IEVE , D. W. and VAN D ER L IN DEN , J. 1986, Force, speed and power output of the human upper limb during horizontal pulls, European Journal of Applied Physiology, 55, 425 ± 430. H ILL , A. V. 1922, Maximum work and mechanical e ciency of human muscles and their most economical speed, Journal of Physiology, 56, 19 ± 41. IVY , J. L., W ITHERS , R. T., B R OSE , G., M AXW ELL , B. D. and C OSTILL , D. L. 1981, Isokinetic contractile properties of the quadriceps with relation to ® ber type, European Journal of Applied Physiology, 47, 247 ± 255. K A NEKO , M. 1970, The relation between force velocity and mechanical power in human muscle, Research Journal of Physical Education, 14, 141 ± 145.
Downloaded by [Nihon Taiiku Daigaku] at 01:41 08 April 2015
54
K. Funato et al.
K AN EK O , M., F UCH IM OTO , T., T O JO , H. and S U EI , K. 1983, Training eŒect of diŒerent loads on the force ± velocity relationship and mechanical power output in human muscle, Scandinavian Journal of Sports Science, 5, 50 ± 55. L AN DER , J. E., B ATES , B. T., S A WH ILL , J. A. and H A MILL , J. 1985, A comparison between freeweight and isokinetic bench pressing, Medicine and Science in Sports and Exercise, 17, 344 ± 353. L ESMES , G., C OSTILL , D. L., C OYLE , E. F. and F INK , W. J. 1978, Muscle strength and power changes during maximal isokinetic training, Medicine and Science in Sports and Exercise, 10, 266 ± 269. M AR GARIA , R., A GH EM O , P. and R OVELLI , E. 1966, Measurement of muscular power (anaerobic ) in man, Journal of Applied Physiology, 21, 1662 ± 1664. N AK AM URA , Y., M UTOH , Y. and M IYASH ITA , M. 1985, Determination of the peak power output during maximal brief pedalling bouts, Journal of Sports Science, 3, 181 ± 187. P ATTON , J. F., M URPH Y , M. M. and F REDERICK , F. A. 1985, Maximal power outputs during the Wingate anaerobic test, International Journal of Sports Medicine, 6, 82 ± 85. P ER RIN E , J. J. and E D GERTON , V. R. 1978, Muscle force ± velocity and power ± velocity relationships under isokinetic loading, Medicine and Science in Sports and Exercise, 10, 159 ± 166. S EGER , J. Y., W ESTING , S. H., H AN SO N , M., K AR LSON , E. and E K BOLM , B. 1988, A new dynamometer measuring concentric and eccentric muscle strength in accelerated, decelerated, or isokinetic movements, European Journal of Applied Physiology, 57, 526 ± 530. T H ORSTEN SSON , A., G RIMBY , G. and K ARLSSO N , J. 1976, Force ± velocity relations and ® ber composition in human knee extensor muscles, Journal of Applied Physiology, 40, 12 ± 16. T OY OSH IMA , S. and M IY ASHITA , M. 1973, Force ± velocity relation in throwing, Research Quarterly, 44, 86 ± 95. W ICKIEW ICZ , T. L., R OY , R. R., P OW ELL , P. L., P ERRINE , J. J. and E D GERTON , V. R. 1984, Muscle architecture and force ± velocity relationships in humans, Journal of Applied Physiology, 57, 435 ± 443.