MEASUREMENT OF USER SATISFACTION WITH WEB-BASED INFORMATION SYSTEMS: AN EMPIRICAL STUDY Li Xiao and Subhasish Dasgupta George Washington University
[email protected] [email protected] Abstract Advances in new information technology and the drastic growth of the Internet over the past decade have considerably changed the end-user computing environment. Therefore, it is appropriate to review the measures of user satisfaction with information systems technology, especially in a web-based environment, which accounts for a major component of the end-user computing environment. The objective of this research was to develop and validate an instrument for measuring user satisfaction in a web-based environment. Doll and Torkzadeh (1988) developed an instrument that measured user satisfaction with information systems. This research tested the validity and reliability of the End-user Computing Satisfaction (EUCS) instrument on users of Internet portals. We found that a revised instrument with some changes to the EUCS instrument is still valid in measuring user satisfaction. Keywords: User satisfaction, Web environment, end-user computing satisfaction, end-user computing, Webbased systems
Introduction User satisfaction is generally regarded as one of the most important measures of Information Systems success. There has been considerable research devoted to establishing a standard user satisfaction instrument since the 1980s (Ives et al. 1983; Bailey and Pearson 1983; Baroudi et al. 1986; Benson 1983), when data computing in organizations moved from data processing to end-user computing (EUC) (Doll and Torkzadeh 1988). Doll and Torkzadeh (1988) developed and validated an End-User Computing Satisfaction (EUCS) instrument. It included five components: content, accuracy, format, ease of use, and timeliness. Since the development of the EUCS instrument, there have been significant changes in information technology, especially with the soaring growth of the Internet. For example, widespread use of web technology and rapid increase of Internet-based information systems is evident in the remarkable increase in the number of Internet hosts and web sites. The number of web sites increased from a paltry 130 in 1993 to well over 17 million in 2000 (Coopee 2000). The Internet opened the door to new opportunities for the free flow of information. This information now flows unhindered across local, state, and national boundaries. Despite the significant changes in the end-user computing environment during the past decade and proliferation of web-based information systems, there has been little research on measurement of user satisfaction with web-based information systems, which is a primary component of end-user computing environment at present. People generally just apply the Doll and Torkzadeh (1988) instrument in their studies to measure the extent of user satisfaction, assuming it is valid and reliable for web-based information systems. However, there are differences between web-based information systems and traditional corporate information systems. For example, with wide spread use of Internet, access to web-based information systems as well as information has been significantly enhanced. It is much easier to get access to any information that one needs, therefore sufficiency of information provided by information systems may not be an issue for web-based information systems any more. In addition, web-based information 2002 — Eighth Americas Conference on Information Systems
1149
Human-Computer Interaction Studies in MIS
systems become more complicated than traditional information systems. More issues other than content, accuracy, format, ease of use and timeliness may be relevant and important in measuring user satisfaction with them. Because of differences between web-based information systems and traditional information systems, it is not appropriate to adopt the EUCS instrument to measure user satisfaction with web-based information systems without examining validity and reliability of the instrument in the specific environment. It is very important to test validity of the instrument in the web-based information system environment. The purpose of this study is to develop and validate an instrument to measure user satisfaction in the information age. To accomplish this, we first reviewed the literature in the field of user satisfaction measurement. Then we decided to adopt the EUCS instrument by Doll and Torkzadeh (1988) as our starting point. We then checked whether this existing instrument could be used in the new information systems environment. The organization of the paper is as follows. In the next section we provide a review of literature. In the section that follows we present our research methodology. Then we report on the data collection and data analysis, followed by conclusions and discussions of research findings.
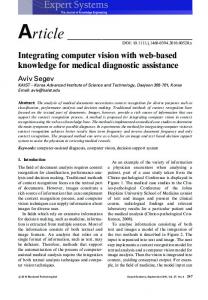
Literature Review User satisfaction has received considerable attention of researchers since the 1980s as an important surrogate measure of information systems success (Ives et al. 1983; Bailey and Pearson 1983; Baroudi et al. 1986; Benson 1983). Several models for measuring user satisfaction were developed, including the user information satisfaction instrument by Ives et al. (1983) and a 12item EUCS instrument by Doll and Torkzadeh (1988). In one of the early studies, Bailey and Pearson (1983) developed a tool for measuring and analyzing computer user satisfaction of 39 items. This instrument included many factors ranging from information quality, systems performance, personal relationship with EDP staff and top management involvement. Limitations of the study involved small sample size (29 valid data) and difficulty of applying the questionnaire. Baroudi et al. (1986) adopted the instrument by Bailey and Pearson (1983) and examined causal relations of user involvement on system usage and information satisfaction. They concluded that user involvement in the development of information systems enhances both system usage and user’s satisfaction with the system. Ives et al. (1983) developed a User Information Satisfaction (UIS) instrument to measure user’s general satisfaction with the information provided by the data processing group of the organization. Limitations of the study included use of an instrument that was based on the data processing computing environment. The emphasis was on computing tasks that were carried out by the data processing group in an organization. The measuring scale was semantic differential rather than Likert-scale type scaling. Due to the limitations of this study, this instrument is not used as much as the EUCS instrument developed by Doll and Torkzadeh (1988). Doll and Torkzadeh developed a 12-item EUCS (Figure 1) instrument by contrasting traditional data processing environment and end-user computing environment, which comprised of 5 components: content, accuracy, format, ease of use, and timeliness. Their instrument was regarded as comprehensive, because they reviewed previous work on user satisfaction in their search for a comprehensive list of items. They included measurement of “ease of use,” which was not included in earlier research. Two global measures of perceived overall satisfaction and success were added to serve as a criterion. The 12 items and the 2 global measures are listed in Appendix 1. The construct was developed with a five point Likert-type scale (1 = almost never; 2 = some of the time; 3 = about half of the time; 4 = most of the time; and 5 = almost always). End-User Computing Satisfaction
Content
Accuracy
Format
Ease of Use
Timeliness
Figure 1. End-User Computing Satisfaction (EUCS) Instrument By Doll & Torkzadeh 1988
1150
2002 — Eighth Americas Conference on Information Systems
Xiao and Dasgupta/User Satisfaction with Web-Based Information Systems
This research was based on this EUCS instrument by Doll and Torkzadeh because it is a widely used instrument, and has been validated through several confirmatory analyses and construct validity tests. After the exploratory study was completed in 1988, two confirmatory studies with different samples were conducted respectively in 1994 and 1997, which suggested the instrument was valid (Doll et al. 1994; Doll and Xia 1997). A test-retest of reliability of the instrument was conducted in 1991, indicating the instrument was reliable over time (Torkzadeh and Doll 1991). The instrument is widely accepted and adopted in other researches. McHaney and Cronan (1998, 2000) adopted it to examining computer simulation success. McHaney et al. (1999) adopted it in decision support systems research. Chen et al. (2000) applied it to measure user satisfaction with data warehouse. In the following section we consider the research methodology in detail.
Research Methodology Our first step was to examine whether Doll and Torkzadeh instrument (1988) can be used in the new information systems environment, and whether this instrument has to be revised. To do this we decided to follow Doll and Torkzadeh’s research methodology to conduct the first part of study. We designed questionnaires to survey end users on their satisfaction with web based information systems. In this research, we considered Internet portals to be representative of web-based information systems. Internet portals are widely used among end users of web based information systems. Web portals constitute some of the most visited sites on the Internet. Three of the top 50 web and digital media properties measured by the number of unique visitors per day are web portals (Media Metrix 2002). Portals provide a variety of services including web search engines, email, calendar, financial tools, and entertainment. We then followed the steps and measures as Doll and Torkzadeh (1988) did to analyze the data to examine the validity and reliability of the instrument. In the sections that follow we provide information on the pilot study, data collection and analysis.
Pilot Study Our pilot study was conducted with a sample of 30 graduate students. The construct validity was examined with correlations between total score and each item scores. To avoid spurious part-whole correlation, the total score was corrected by subtracting the item score before examining the correlation. Criterion-related validity was also examined using two-item global criterion including “Is the system successful?” and “Are you satisfied with the system?” In order to analyze the pilot study data, we assessed the item-total correlation and criterion-related correlation.
Sample Table 1. Descriptive Statistics of Research Sample Gender Work Experience
Male
Female
Total*
174 (52%)
158 (48%)
332
< 1 year
1 - 3 years
4 - 6 years
7 - 10 years
> 10 years
115 (35%)
134 (41%)
52 (16%)
14 (4%)
14 (4%)
Location Home (multiple 291 (86%) choices) * N = 340. There were some missing data.
Work
School
138 (41%)
261 (77%)
329
690
The sample for this study included students at a large mid-Atlantic university. Although the sample for this study was collected at a higher education institution, it well represents the end user population, because some students were full-time students while others were part time students from a variety of industries and management levels. Table 1 provides some descriptive statistics.
2002 — Eighth Americas Conference on Information Systems
1151
Human-Computer Interaction Studies in MIS
Data Collection According to Doll and Torkzadeh (1988) there are five components of user satisfaction with information systems: content, accuracy, format, ease of use, and timeliness. This research conducted a survey of 340 end users about their satisfaction/ dissatisfaction with Internet portals. A list of questionnaire questions is provided in Appendix 1. Data were collected in classes at a large mid-Atlantic university. Students were told that participation in this study was voluntary and anonymous. No personal identity information was collected during the survey. Hard copy questionnaires were distributed in class. It took 4-8 minutes to complete the survey.
Data Analysis In this study, we followed the methodology used by Doll and Torkzadeh (1988) to analyze the data. We analyzed the construct validity, examined criterion-related validity, and reliability. We evaluated the construct validity and the constructs in the EUCS instrument. This was done with factor analysis and item-total correlation (Kerlinger 1978).
Factor Analysis In conducting the factor analysis, we expected the factors (questions in our study) to load on constructs originally identified by the earlier study. The Principal Components Analysis (PCA) was used as the extraction technique and varimax was used as a method of rotation. Table 2 is the factor matrix of the 12-item instrument. We took the threshold value of 0.7 for factor loading criterion. Table 2. Rotated Factor Matrix of the 12-Item Instrument Item/Question Code Content Accuracy Format Ease of Use Timeliness C1 0.849 C2 0.824 C3 0.755 C4 0.701 A1 0.811 A2 0.776 F1 0.836 F2 0.675* E1 0.867 E2 0.897 T1 0.806 T2 0.706 * The loading of question F2 is 0.675, which is close to 0.7, therefore, we decided to keep it in the instrument. As we can see from the factor matrix, the primary loadings for the five factors are well above 0.7 while the factor loading for the question F2 is very close to 0.7 (for question F2 see Appendix 1). Therefore we keep all the factors as they are in the instrument. Next we conducted item-total correlation as well as criterion related correlation. Following Doll and Torkzadeh’s procedure, we examined the correlation of score of each item with the total score of all questions. To avoid the spurious part-whole correlation, we subtracted each item score from the total score before conducting the correlation, therefore we conducted correlation of each item with the total of rest 11 items. Table 3 lists the result of the correlation assessment. According to Doll and Torkzadeh, there is no accepted standard of cutoff threshold, therefore we took the same cutoff value of 0.5 as they did in their study.
1152
2002 — Eighth Americas Conference on Information Systems
Xiao and Dasgupta/User Satisfaction with Web-Based Information Systems
Table 3. Item-Total Correlation Factor C1 C2 C3 C4 A1 A2 F1 F2 E1 E2 T1 T2
Correlation Coefficient 0.638 0.697 0.605 0.223 0.637 0.670 0.600 0.650 0.585 0.580 0.553 0.481
Alpha