16th World Congress of the International Fuzzy Systems Association (IFSA) 9th Conference of the European Society for Fuzzy Logic and Technology (EUSFLAT)
Measuring Quality Policy Deployment: A Fuzzy Logic Approach Juan Cogollo-Flórez1 Myladis Cogollo-Flórez2 Andrea Flórez-Rendón1 1
Instituto Tecnológico Metropolitano, Medellín, Colombia, {juancogollo, andreaflorez}@itm.edu.co 2 Universidad EAFIT, Medellín, Colombia,
[email protected] the model and its analysis is made along with the conclusions.
Abstract Global and balanced performance measurement in Quality Policy Deployment is a key element of quality management in public Higher Education Institutions (HEI´s). This paper describes the design of a fuzzy linguistic model for measuring Quality Policy Deployment in a Colombian public HEI. The proposed model integrates Balanced Scorecard (BSC) principles with the theory of fuzzy sets for treatment of imprecision associated with quantifying of Quality Policy Deployment. The application of the model allowed to obtain a crisp Quality Policy Deployment Index incorporating imprecision and vagueness on these calculations through a fuzzy rule-based system.
2. Measurement of Quality Policy Deployment Management assessing of higher education has focused on measuring quality assurance systems, and there is a large body of research and contributions in terms of tools and methods of measurement [4]. The evolution of performance measurement in HEI´s is closely associated with the stages of quality management: audit, evaluation, assurance, accreditation and quality improvement [5]. There are several models applicable to HEI´s for quality management and continuous improvement with strategic approach: Total Quality Management, European Foundation for Quality Management, BSC, ISO 9001, Reengineering, among others. These models focus on developing systematic processes to achieve measurable quality products and are applicable both institutional and Faculties or Departments levels. However, it is considered that there is a gap in performance management and evaluation of quality policies in the field of public higher education [6].
Keywords: Fuzzy Logic, Fuzzy Sets, Performance Measurement, Quality Management, Quality Policy Deployment Index. 1. Introduction In recent years, public HEI´s have undergone major changes in institutional management due to new approaches in public management and the changing role of the state [1, 2]. This wave of changes began in the 90´s of the last century in European universities, which affected its institutional processes and faced the need to develop and/or adapt approaches and management tools to improve performance in the new scenario and become more efficient and effective [3].
2.1. An overview of Quality Policy Deployment The Quality Policy Deployment or Administration by Policies is a model developed in Japan and this one is used by many organizations to develop and communicate corporate aims at all levels and strategically manage quality [7]. Also it is known as Hoshin management (Hoshin means magnetic compass and as a second meaning, policies, in japanese), is a management style based on a generalized application of continuous improvement cycle to deploy series of annual objectives (called Hoshin) to achieve alignment of all levels and a quick adaptation to the changing environment [8].
Therefore, it is necessary the development and implementation of tools and performance measurement systems in compliance of institutional purposes regarding quality management. In order to contribute to generation and dissemination of knowledge in this area, in this paper is developed a fuzzy linguistic model based on BSC principles for measuring Quality Policy Deployment Index in a Colombian public HEI.
The Quality Policy Deployment, unlike conventional strategic planning, is based on the quality management principles and it considers objectives, goals of quality and financial aspects. Therefore, it is a dynamic process with performance measurement as a key element, where the goals are moved into actions through measurable activities.
This paper is structured as follows: first, there is a description of quality management in HEI´s and it is made a conceptual review of Quality Policy Deployment and BSC. Then, we introduce the concept of fuzzy logic and its application in the context of performance measurement and Quality Policy Deployment. Thereafter, we describe the stages of proposed fuzzy linguistic model for measuring Quality Policy Deployment in a Colombian public HEI, its theoretical aspects and the application form. Lastly, we show the result obtained by applying
© 2015. The authors - Published by Atlantis Press
2.2. BSC and Quality Policy Deployment The growing demands of performance measurement in the public sector have led the implementation of tools
1012
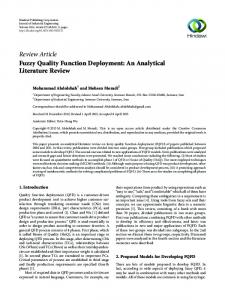
membership degree of 0.75) and high (membership degree of 0.25) simultaneously (Figure 2). Also, we can say that there is more possibility that it can be from medium to high, which is closer to human reasoning, since there is no consensus on these limits (a score of 60% in customer satisfaction may be considered as a medium for some people and high for others).
and methodologies used in private sector, which emphasize financial control and the proliferation of indicators that are not relevant in the public sector [9, 10]. In order to overcome these problems have been proposed different models with integrated approaches to performance measurement as the BSC and Performance Prism, originated in the private sector, but with a high acceptance and use in the public sector.
1,2 Membership function
The need of performance measurement tools at different levels of decision making and a balanced approach, led to Kaplan & Norton [11] propose Balanced Scorecard (BSC) as a way to evaluate the performance of an organization in four different perspectives: Customer, Internal Processes, Learning and growth and Financial.
1 0,8 Medium
Low
0,6
High
0,4 0,2 0 0%
The application of BSC in Quality Policy Deployment is structurally similar to traditional model of corporate governance; the difference is that the indicators must be designed to evaluate fully the performance of the institution in each of the quality guidelines and objectives and thus overall performance in Quality Policy Deployment.
10%
20%
30%
40%
50%
60%
70%
80%
90% 100%
Customers satisfaction
Figure 1: Representation of performance indicator classical subsets.
1,2 Membership function
2.3. Fuzzy Logic and Quality Policy Deployment Although some authors as Bojadziev [12] who argues that there is no single knowledge system called fuzzy logic, but a variety of methodologies to propose a logical examination of vague and imperfect knowledge, we can say that this is a multivariate logic that allows more practical way to deal problems that occur in the real world. It came from fuzzy sets theory proposed by Zadeh [13] and it is based on the fact that the building blocks of human reasoning are not numbers but they are linguistic labels, so fuzzy logic emulates this feature and makes use of approximate data to obtain accurate solutions [14].
1 0,8 0,6
High
Medium
Low
0,4 0,2 0 0%
10%
20%
30%
40%
50%
60%
70%
80%
90% 100%
Customers satisfaction
Figure 2: Representation of performance indicator fuzzy subsets.
Several researchers have applied fuzzy logic techniques in performance measurement or quality management [17]. The most relevant work began profusely approximately from 2000´s, starting by Lau et al [18] who developed a methodology to analyze and monitor performance of suppliers in a supply chain based on product quality and delivery time criterion.
Fuzzy set theory strength lies in its ability to provide an alternative framework for the modeling of imprecision. So, it allows the studying of vagueness and possibility, both concepts are separated from random or probabilistic uncertainty [15]. A fuzzy set is defined by a function that varies between 0 (false) and 1 (true), which assigns the membership degree of each element in a set. The shape of the membership function can be linear (triangular or trapezoidal) or nonlinear (Gaussian, generalized Bell, sigmuidal, gamma, etc.) depending on the nature of the system. The membership represents the degree to which the expert opinion places an item in the set, which may belong to more than one set with different membership degrees, allowing a gradual transition between adjacent sets [16].
Lupo [19] developed a model based on an extension of the SERVQUAL model, combined with fuzzy set theory and Analytic Hierarchy Process, to incorporate the uncertainty and estimate the relative importance of attributes, respectively, on the analysis of service performance related with higher education based on the judgment of stakeholders.
3. Development of Fuzzy BSC Model for Measuring Quality Policy Deployment Index
In performance measurement area, the above is demonstrated by considering the subsets that represent the results of customer satisfaction indicator, for example, using classical logic and fuzzy logic. In classical theory a result of 60% in the indicator is considered as a medium with membership degree of 1 (Figure 1). In fuzzy theory, the same result is seen as a medium (with a
Development of Fuzzy Model for measuring Quality Policy Deployment Index was carried out through six stages: Development of strategic guidelines and performance indicators, Setting fuzzy sets and indicators membership functions, Defining fuzzy inference method,
1013
Elaboration of fuzzy rule-based system, Selection of defuzzification method and Calculation of Quality Policy Deployment Index. 3.1 Development of Strategic Guidelines and Performance Indicators
The basis of Quality Policy Deployment is establishing quality policy and quality management principles of HEI. Then follow formulation of quality guidelines to guide action in every perspective of BSC. This first stage ends establishing the indicators to measure the performance in each one of the quality guidelines and thus to measure overall performance in Quality Policy Deployment. Table 1 shows the results of alignment between guidelines quality with respective indicators in every BSC perspective (customer, internal processes, learning and growth and financial). BSC PERSPECTIVE
QUALITY GUIDELINES
Knowledge management in the service of society Customer Promote the entry and retention of students strengthen academic recognition and visibility Increase national Internal Proce- and international sses academic mobility Strengthen research and innovation capacities Improve curricular programs Learning and Growth
Financial
Input variables Fuzzy subsets for calculating performance of perspectives: Table 2 shows the fuzzy subsets of associated indicators (input variables) to estimate the performance of perspectives. Output variables fuzzy subsets for calculating performance of perspectives: by analogy with the input variables, membership functions for fuzzy subsets output variables (indicator of each perspective) were defined (Low, Medium and High), which are plotted in Figure 3.
The definition of input variables fuzzy subsets for calculating Quality Policy Deployment Index is not described in this section as outputs in each perspective corresponds exactly to inputs of the system for calculating Quality Policy Deployment Index.
FUZZY SUBSETS PARAMETERS
INDICATORS INDICATORS
Percentage of Implementation of academic extension services designed (%) Percentage of students benefited from financial support (%) Number of articles published in indexed journals (#) Number of students and teachers benefited from outgoing mobility programs (#)
Rate of number of active students per computer (#)
Increase postgraduate education of teachers Efficient use of financial resources New external financial resources
Percentage of teachers with master's and doctoral education (%)
Medium (triangular)
High (trapezoidal)
Percentage of implementation of academic extension services designed (%)
(0,0,30,60)
(30,60,90)
(60,90,100,100)
Percentage of students benefited from financial support (%)
(0,0,10,20)
(10,20,30)
(20,30,35,35)
Number of articles published in indexed journals (#)
(0, 0,15, 30)
(15,30,45)
(30,45,50,50)
(0,0,30,60)
(30,60,90)
(60,90,100,100)
(0,0,30,60)
(30,60,90)
(60,90,100,100)
(0,0,30,60)
(30,60,90)
(60,90,100,100)
(0,0,0.6,1.2)
(0.6,1.2,1.8)
(1.2,1.8,2,2)
(0,0,24,48)
(24,48,72)
(48,72,80,80)
(0,0,16,32)
(16,32,48)
(32, 48, 54, 54)
(0,0,6,12)
(6,12,18)
(12, 18, 20, 20)
Number of students and teachers benefited from outgoing mobility programs (#) Percentage of approved research projects and running (%) Percentage of programs with high quality accreditation (%)
Percentage of approved research projects and running (%) Percentage of programs with high quality accreditation (%)
Modernize academic support
Low (trapezoidal)
Rate of number of active students per computer (#) Percentage of teachers with master's and doctoral education (%) Percentage of expenditure on investment projects (%) Percentage of external financial resources (%)
Percentage of expenditure on investment projects (%) Percentage of external financial resources (%)
Table 2: Selected performance indicators and fuzzy subsets parameters of perspectives performance input variables.
Table 1: Performance measurement indicators in Quality Policy Deployment.
3.3. Defining Fuzzy Inference Method
3.2. Setting Fuzzy Sets and Indicators Membership Functions
A fuzzy inference method allows to derive conclusions (fuzzy value) from an “IF-THEN” rules set and an input values set to the system by applying composition relations. The two most important methods of inference are the type of Mandani model, the most commonly used and introduced by Mandani & Assilian [20] and TSK (Takagi-Sugeno-Kang) model proposed by Sugeno & Takagi [21]. The main difference between these two methods is the type of consequent in fuzzy rules. While Mandani systems use fuzzy sets as consequent of the rule, TSK systems employ linear functions of input variables. The
The parameters of input and output variables fuzzy sets for the calculations of performance by perspective and the Quality Policy Deployment Index were established by analyzing historical information through the constriction of frequency histograms and the corresponding segmentation into quartiles or quintiles according to the number of fuzzy sets established by the Head of Planning of the HEI:
1014
Mandani type inference system is used in this model (Figures 4 and 5), because of its outputs are continuous values, while the TSK systems are discrete data.
Customer Performance Internal Processes Performance Learning and Growth Performance
Membership function
1,2
BSC Perspectives (Mandani)
Quality Policy Deployment Index
Financial Performance
1 0,8 0,6 Low
0,4
Figure 5: Fuzzy Inference System for measuring Quality Policy Deployment Index.
High
Medium
0,2
3.4. Elaboration of Fuzzy rule-based System
0 0
10
20
30
40
50
60
70
80
90 100
The definition of rules is the most important stage in the design of Fuzzy BSC Model as the embodiment of the expert opinion and/or analysis of historical information. The experts group of Planning Office were as guideline in the definition of fuzzy rules than in public HEI´s the main objective is not financial success but customer or user satisfaction using internal capabilities and resources with efficient and effective use of budgetary appropriation.
BSC Perspective Performance - Outputs
Figure 3: Outputs variables fuzzy subsets (performance indicator of each BSC perspective).
Academic extension services (%) Customer (Mandani)
In other words, there is influence of financial and learning and growth guidelines on internal processes and customer. In summary, to achieve customer satisfaction must be achieved the goals of internal processes, with competent staff and a culture of improvement, using efficiently the financial resources allocated and seeking new sources of additional financial resources.
Customer Performance
Students financial support (%)
Published articles (#)
Students and teachers mobility (#)
Internal Processes (Mandani)
Internal Processes Performance
The fuzzy rule-based system uses linguistic variables as antecedents and consequents. The antecedent expresses that an inference or inequality must be satisfied. The consequent is which can be inferred and is the output if the antecedent inequality is satisfied. In this model are used “IF-THEN” rules, composed of the antecedent "IF" and the consequent "THEN", using connectors "AND" to develop necessary decision rules.
Research projects (%)
High quality accreditation(%)
Students per computer (#)
Learning and Growth
Learning and Growth
(Mandani)
Performance
Master and doctoral education (%)
Ependiture on investment projects(%)
Financial (Mandani)
This model contains four rules sets for BSC perspectives and one rule set for Quality Policy Deployment Index. The construction of fuzzy rule-based system was made by developing a conclusions matrix by considering all possible combinations of inputs and assigning a conclusion to each.
Financial Performance
External financial resources (%)
Internal Processes and Learning and Growth perspectives were evaluated on three input variables, which have three fuzzy categories (Table 2), therefore there are 33 = 27 fuzzy rules in each of their systems. On the other hand, Customer and Financial perspectives were evaluated on two input variables, which have three fuzzy categories; therefore there are 32 = 9 fuzzy rules in each of their systems (Table 2).
Figure 4: Fuzzy Inference Systems for Customer, Internal Processes, Learning and Growth and Financial perspectives performance measurement.
Quality Policy Deployment Index was evaluated on four input variables (BSC perspectives), which have three fuzzy categories (low, medium and high), so were built 34 = 81 rules in its fuzzy rules matrix.
1015
Space limitations in this paper preclude showing the five rules sets in full. In order to illustrate the process, an example the fuzzy rules matrix of Internal Process perspective is shown in Table 3. Values in cells represent the consequent describing each combination and correspond to linguistic labels of output variable fuzzy subsets, and "L" corresponds to low, "M" is medium and "H" is high. Any cell in the matrix can be expressed as a rule. For example, the shaded cell corresponds to the following rule: IF “published articles” are Low AND “students and teachers mobility” is High AND “research projects” are High THEN Internal Processes perspective performance is Medium.
Published articles
Low
Medium
High
Students and teachers mobility Low Medium High Students and teachers mobility Low Medium High Students and teachers mobility Low Medium High
3.6. Calculation of Quality Policy Deployment Index The crisp numbers results of applying the Fuzzy BSC model for measuring Quality Policy Deployment Index are shown in Figure 11. The input values of each performance indicator correspond to those achieved by the HEI in the most recent fiscal year. The results can be expressed in terms of the fuzzy rule-based systems, as follows: Customer perspective: IF Percentage of implementation of academic extension services designed is 35.3% AND Percentage of students benefited from financial support is 31.5% THEN Customer performance is 50%
Research projects Low
Medium
High
L L L
L L M
L M M
Internal Processes perspective: IF Number of articles published in indexed journals is 40 AND Number of students and teachers benefited from outgoing mobility programs is 100 AND Percentage of approved research projects and running is 100% THEN Internal Processes performance is 73.3%.
Research projects Low
Medium
High
L L L
M L M
M M M
Learning and Growth perspective: IF Percentage of programs with high quality accreditation is 84.2% AND Rate of number of active students per computer is 1.98 AND Percentage of teachers with master's and doctoral education is 73% THEN Learning and Growth performance is 77.9%.
Research projects Low
Medium
High
L M M
M M H
M H H
Financial perspective: IF Percentage of expenditure on investment projects is 45.4% AND Percentage of external financial resources is 12% THEN Financial performance is 79%
Table 3: Fuzzy rules matrix of Internal Processes perspective.
Quality Policy Deployment Index: IF Customer performance is 50% AND Internal Processes performance is 73.3% AND Learning and Growth performance is 77.9% AND Financial performance is 79% THEN Quality Policy Deployment Index is 53.9%.
3.5 Selection of Defuzzification Method The result of inference process is a set with a fuzzy distribution in response. However, since generally specific responses are used to facilitate decision making, it is necessary to remove the fuzziness to obtain a crisp number.
Based on fuzzy subsets of Quality Policy Deployment Index (see Figure 3), a score of 53.9% is considered Medium (membership grade of 0.79) and Low (membership grade of 0.21). The numerical results of performance indicators for each BSC perspective and the Quality Policy Deployment Index may be interpreted as the compliance percentage of the goals and objectives of quality policy in each one of them.
The literature describes a lot of methods to eliminate fuzziness: center of the area, bisecting the area, smaller of maximum or larger of maximum [22, 23, 24]. The appropriate method depends on its adjustment degree to the considerations and constraints of the application. The center of area method is one of the most commonly used and was used in this model because of its continuity and that calculates the overlap area only once, unlike other methods. The crisp value of the performance indicators for each perspective and Quality Policy Deployment Index were generated by the search of gravity center of the membership function of respective fuzzy outputs (Figures 6, 7, 8, 9 and 10). The Matlab© software was used as support for development of every stage of fuzzy model.
1016
Figure 6: Scheme results of the fuzzy inference procedure to calculate performance of Customer perspective.
Figure 7: Scheme results of the fuzzy inference procedure to calculate performance of Internal Processes perspective.
Figure 8: Scheme results of the fuzzy inference procedure to calculate performance of Learning and Growth perspective.
1017
Figure 9: Scheme results of the fuzzy inference procedure to calculate performance of Financial perspective.
Figure 10: Scheme results of the fuzzy inference procedure to calculate Quality Policy Deployment Index
Percentage of implementation of academic extension services designed = 35.3 %
Quality Policy Deployment Index = 53.9%
Customer Performance = 50%
Percentage of students benefited from financial support = 31.5 % Number of articles published in indexed journals = 40
Internal Processes Performance = 73.3%
Number of students and teachers benefited from outgoing mobility programs = 100
Percentage of approved research projects and running = 100 % Percentage of programs with high quality accreditation = 84.2 % Learning and Growth Performance = 77.9%
Rate of number of active students per computer = 1.98 Percentage of teachers with master's and doctoral education = 73 % Percentage of expenditure on investment projects = 45.4%
Financial Performance = 79%
Percentage of external financial resources = 12 %
Figure 11: General scheme of numerical results from application of Fuzzy BSC Model developed.
1018
[8] E. Yacuzzi, La gestión hoshin: modelos, aplicaciones, características distintivas, In CEMA Working Papers: Serie Documentos de Trabajo, 316, Universidad del CEMA, 2005. [9] M. Arnaboldi and G. Azzone, Constructing performance measurement in the public sector, Critical Perspectives in Accounting, 21, 266 – 282, 2010. [10] K. Fryer, K. Antony and S. Ogden, Performance management in the public sector, International Journal of Public Sector Management, 22 (6), 478-498, 2009. [11] R. Kaplan and D. Norton, The balanced scorecard – measures that drive performance, Harvard Business Review, 70 (1), 71-79, 1992. [12] G. Bojadziev and M. Bojadziev, Fuzzy logic for business, finance and management, 2 ed, World Scientific, Singapore, 2007. [13] L. Zadeh, The concept of a linguistic variable and its application to approximate reasoning, Information Sciences, 8, 199–249, 301–357, 1975. [14] L. Zadeh, Is there a need for fuzzy logic?, Information Sciences, 178, 2751 -2779, 2008. [15] G. Klir and B. Yuan, Fuzzy sets and fuzzy logic: theory and application, Prentice Hall, New Jersey, 1995. [16] W. Siler and J. Buckley, Fuzzy expert systems and fuzzy reasoning, John Wiley & Sons, New Jersey, 2005. [17] S. Ammar and R. Wright, Applying fuzzy-set theory to performance evaluation, Socio-Economic Planning Sciences, 34, 285 -302, 2000. [18] H. Lau, W. Pang and C. Wong, Methodology for monitoring supply chain performance: a fuzzy logic approach, Logistics Information Management, 15 (4), 271 – 280, 2002. [19] T. Lupo, A fuzzy ServQual based method for reliable measurements of education quality in Italian higher education area, Expert Systems with Applications, 40, 7096–7110, 2013. [20] E.H. Mamdani and S. Assilian, An experiment in linguistic synthesis with a fuzzy logic controller, International Journal of Man-Machine Studies, 7 (1), 1–13, 1975. [21] M. Sugeno and T. Takagi, Fuzzy identification of systems and its application to modelling and control, IEEE Trans. Syst. Man and Cybern., 15, 116–132, 1985. [22] T. Ross, Fuzzy logic with engineering applications, 2 ed, John Wiley & Sons, West Sussex, 2004. [23] H-J. Zimmermann, Fuzzy set theory and its applications, 4 ed, Springer, Massachusetts, 2001. [24] J-S. Jang, C-T. Sun and E. Mizutani, Neuro-Fuzzy and soft computing, Prentice Hall, New Jersey, 1997.
4. Conclusions HEI´s management requires to execute and measure the quality strategy at every one of the levels of the organization. It is necessary to know if guidelines of quality policy and objectives are properly deployed in every management unit, through performance measurement. The application of fuzzy BSC model allowed to obtain a crisp number as Quality Policy Deployment Index which is essential for decisions making in the HEI´s and it comes from a set of fuzzy rules easily interpretable and apprehended by the staff involved in quality management. The fuzzy model has a systematic structure that allows easy adaptation to others institutions or other business management problems. The joint implementation of fuzzy logic and BSC provides a new approach for the modeling of imprecision that characterizes Quality Policy Deployment. Furthermore, it is considered a practical, easy to apply and adapt procedure, compared to the conventional approaches especially when it has a large number of input data. Acknowledgements This work is a product of research project “Estimation of processes quality control indexes using inaccurate data with deviations from normality” (internal code P14221) which is carried out jointly between the Instituto Tecnológico Metropolitano of Medellín and EAFIT University. References [1] J. Bryson, Strategic Planning for Public and Nonprofit Organizations, 3 ed, John Wiley & Sons, San Francisco, 2004. [2] M. Shattock, Managing successful universities, Bell & Bain, London, 2003. [3] B. Sporn, Management in higher education: current trends and future perspectives in European colleges and universities, In R. Begg, The Dialogue between Higher Education Research and Practice, 97-108, Kluwer Academic, New York, 2002. [4] N. Becket and M. Brookes, Quality Management in Higher Education: A Review of International Issues and Practice, The International Journal for Quality and Standards, 85-121, 2006. [5] C. Sarrico, On performance in higher education: Towards performance governance, Tertiary Education and Management, 16 (2), 145-158, 2010. [6] H. Macdonald, The University in the Modern Marketplace, In P. Rondo-Brovetto and I. Saliterer, The University as a Business?, 9-20, Office, Heidelberg, 2011. [7] M. Zairi, Strategic planning through quality policy deployment: a benchmarking approach, In G. Kanji, Total Quality Management, 207-215, Springer, Bradford, 1995.
1019