This is a preprint of a paper published at Journal of Informetrics (2008), vol 2, 173-182.
Measuring science-technology interaction using rare inventor-author names Kevin W. Boyacka and Richard Klavansb a SciTech Strategies, Inc., Albuquerque, NM 87122 USA (
[email protected]) b SciTech Strategies, Inc., Berwyn, PA 19312 USA (
[email protected]) Abstract The relationship between science and technology has been extensively studied from both theoretical and quantitative perspectives. Quantitative studies typically use patents as proxy for technology and scientific papers as proxy for science, and investigate the relationship between the two. Most such studies have been limited to a single discipline or country. In this paper, we investigate science-technology interaction over a broad range of science and technology by identifying and validating a set of 13,440 inventor-authors through matching of rare names obtained from paper and patent data. These 13,440 inventor-authors are listed as inventors on over 42,000 US patents between 2002 and 2006. Analysis of the distribution of these patents over classes shows that this 5% sample is a suitable sample for further analysis. In addition, a map of 290 IPC patent subclasses was created, showing the relationship between patent classes and industries as well as the distribution of patent classes with high science orientation and low science orientation. Keywords: science-technology interaction; inventor-author matching; patent mapping; patent distributions 1. Introduction The relationship between science and technology has been extensively studied from multiple perspectives. On one hand a variety of models or descriptive frameworks (e.g. Triple Helix of university-industry-government relations) have been proposed to characterize this relationship. On another hand, data have been used to develop metrics for the purpose of quantifying the relationship. Most of these studies, whether conceptual or quantitative, are policy oriented. Many have been concerned with knowledge production and the nature, mechanism, directionality, and/or magnitude of the transfer of that knowledge between science and technology. Quantitative studies have largely focused on the non-patent references (NPR) on the front pages of US patents, the majority of which refer to scientific or technical documents, such as journal articles or conference papers. Early work in this area, such as that performed by Narin and colleagues (Carpenter & Narin, 1983; Narin & Olivastro, 1992, 1998), was based on the assumption that a patent-to-paper reference was an indicator that a technology (in the form of a patent) directly descended from science (in the form of a paper). More recent work, particularly that of Meyer, has shown that the inference of a direct linkage from science to a resulting technology is unfounded in a large fraction of cases. Rather, the majority of patent-to-paper references are there for other reasons. This does not discount the fact that the patent and paper are related, but merely calls into question the directionality and mechanism of that relationship. While many publications refer to “science-technology linkage”, Meyer has eschewed that terminology in favor of “science-technology interaction” (M. Meyer, 2000), and we will follow that convention. While many studies have used NPR data with the specific intent of linking economic benefit to public science through technology development or patents, we suggest there is great value in simply understanding the overlap between science and technology, regardless of the direction of or mechanism for the interactions. We believe
This is a preprint of a paper published at Journal of Informetrics (2008), vol 2, 173-182.
there is a much less messy 1 and more comprehensive way to show the interaction between science and technology – through inventor-authors. This is not a new idea. Inventor-authors have been studied for the better part of two decades. However, we now have the means to scale such a study to cover “all of science” and “all of technology”, and to quantify the overlaps or interactions between the two. In this paper, we identify a large number of inventorauthors using rare names. Rare names that occur in both a literature and a patent database are far more likely to identify a single person, an inventor-author, than are more common names. The balance of the paper will proceed as follows. First, we give a brief background on relevant studies of sciencetechnology interaction, and more particularly on inventor-author studies. We then describe the data and methods used to identify and verify inventor-authors. This is followed by a discussion of results and implications, introduction of a patent map showing the science orientation of different technologies and industries, and finally by a short summary and suggestions for future work. 2. Background Several approaches to quantifying science-technology interaction have been used over the years. Primary among these has been citation analysis using NPR’s. In most of these studies, patent references are linked to specific papers in SCI (Science Citation Index) journals. Francis Narin and his company, CHI Research 2 , generated significant business out of this type of study (Hicks, Tomizawa, Saitoh, & Kobayashi, 2004), and eventually linked all science-based NPR’s to SCI papers starting with the 1983 patent year (Narin & Olivastro, 1998). We presume this took a great deal of manual work. Meyer also has a substantial body of work based on NPR’s (M. Meyer, 2000, 2002), much of which focuses on the area of nanotechnology (M. Meyer, 2001). Paper-to-patent citation analysis has also been investigated (Glänzel & Meyer, 2003), although the numbers of patents cited in papers is quite low relative to other citation types. Paper-to-patent citation volume is dominated by chemistry references, thus this technique may be less applicable in other disciplines. Lexical approaches have also been used to establish semantic linkages between patents and scientific articles. Outputs from this approach include correspondence tables between patent classes and scientific disciplines (Bassecoulard & Zitt, 2004). The idea of a common knowledge base giving rise to joint or concurrent development of science and technology through inventor-authors has also been studied. Bonaccorsi and Thoma (2007) explore some of the reasons why individuals are useful as a unit of study as opposed to using citations. Coward and Franklin (1989) were among the first to match inventors with authors using literature and patent data. They explored the field of semiconductor-related science using a database of over 100k papers and 2,452 patents, with the objective of matching patent data to their bibliometric model of the field. They identified 247 inventor-authors, and found that this method gave better results (more matches) than either institutional matching or linking through NPRs. Most studies of inventor-authors since that time have been small scale, dealing with specific fields of science such as laser medicine research (Noyons, van Raan, Grupp, & Schmoch, 1994) or nanotechnology (M. Meyer, 2006), 1
Non-patent references are notoriously messy, difficult to clean and parse using automated methods, and difficult to match to journal articles. For example, Verbeek et al. (2002) were able to link only 9.3% of 1.15 million NPR to specific articles in the Science Citation Index. They had better luck (26%) identifying journal titles. This is still well short of the 50% or more of NPRs that are commonly assumed to be science-related. 2
CHI Research was sold and divided several years ago. The patent research from CHI is now located at Ipiq.
This is a preprint of a paper published at Journal of Informetrics (2008), vol 2, 173-182.
or with the output of a country (M. Meyer, 2003; Tijssen & Korevaar, 1997). Murray (2002) took one seminal and highly cited paper-patent pair in tissue engineering, and investigated the network of researchers and inventors who subsequently cited those works. Although most work in matching inventors with authors has also required an institutional match to validate the inventor-author, there are cases in which academic authors have inventions that are assigned to an organization other than the academic institution. Several studies have attempted to match these academic inventors with their patents that are assigned to other institutions (Balconi, Breschi, & Lissoni, 2004; M. Meyer, 2003; Noyons et al., 2003). The work by Noyons et al. (2003) is the largest scale and most comprehensive inventor-author study to date. Although their work was limited to EU countries, they were able to link over 15,000 inventor-authors (combination of full and partial matches), roughly 60% of which also showed institutional matches, and the other 40% of which linked the academic inventor with patents assigned to other institutions. As with all types of studies involving names, synonymy (multiple name variations for one person) and homonymy (multiple persons with the same name) are issues in inventor-author studies as well. Different approaches to reducing the effects of these issues include restricting matches to same-country matches (M. Meyer, 2006; Noyons et al., 2003), limiting the domain of study (M. Meyer, 2006), logic involving variations on name parts (Noyons et al., 2003), and textual analysis using vector space matching on extracted terms (Cassiman, Glennisson, Verbeek, & van Looy, 2007). In this study, we approach the synonymy and homonymy issues by restricting matches to rare names occurring in literature and patent data. 3. Data and Methods 3.1 Data The purpose of this study is to quantify the interaction between science and technology through inventor-author linkages in such a way that those interactions can ultimately be compared by scientific discipline for policy purposes. 3 To do this, we need to cover “all of science” and “all of technology”, or at least as large a segment of each as is possible, rather than to focus at the level of a single discipline. Large databases were thus needed for this study. For the literature part of the study, we use Scopus data from a five-year period, 2002-2006, comprising 5.96 million papers and 23.6 million authors with institutions. The advantage of using Scopus data over Thomson Scientific (or Web of Science) data for author studies is that Scopus links individual authors and institutions at the paper level. By contrast, with Thomson data, although all authors and all institutions are listed, institutional affiliations of each author must be inferred except for first author/first institution combinations and papers with only one authoring institution. For the patent part of the study, we use data from the US Patent and Trademark Office (USPTO) for the same five-year period, 2002-2006, comprising over 907,500 patents and 2.15 million inventors. Weekly front-page files are available on-line from USPTO 4 that contain inventor, assignee, and reference information, among other fields. Although the format of these files has changed over the years (from tagged record to XML), full inventor and 3
A detailed disciplinary comparison is planned, but is beyond the scope of this paper.
4
ftp://ftp.uspto.gov/pub/patdata/
This is a preprint of a paper published at Journal of Informetrics (2008), vol 2, 173-182.
assignee data are available and can be easily parsed from the source data. Inventors are not specifically linked to assignees in these data. Rather, relationships between inventors and assignees must be inferred. Over the five-year time period, 11.8% of US patents have no assignee, 85.8% have one assignee, and only 2.4% have multiple assignees. 3.2 Methodology Our matching of inventors with authors is based on the simple assumption that if a name is rare and occurs in the inventor data, and in the author data, it is very possible that both instances are referring to the same person. Conversely, if a name is common, and could represent tens, or even hundreds, of different authors or inventors, it will take much more effort to find an accurate match. We wish to avoid this effort. Further, we do not believe finding all inventor-authors is necessary. For policy purposes, and to show the overlap between science and technology on a disciplinary basis, a representative sample is all that is required. Let us now define what we mean by a rare name. Certainly, the most extreme case of rare would be where there is only one institutional affiliation for a given name. However, if we were to limit the analysis to this definition of rare, it might be difficult to obtain a sufficiently large and representative sample of inventor-authors. We have chosen to have a variable definition of rare, one that will allow us to not only gather a larger sample, but to compare thresholds of rareness. Consider the case in Table 1 for one author string. Table 1. Institutional distribution of papers for a unique author string. Author string ABARBANEL_H ABARBANEL_H ABARBANEL_H
Institution University of California, San Diego Scripps Institution of Oceanography Universidad Autonoma de Madrid
# papers 39 3 1
fraction 0.907 0.070 0.023
Author ABARBANEL_H is associated with 3 different institutions in the Scopus data. However, nearly 91% of the publications assigned to this author name are at one institution. We thus make the assumption that this name is rare at a threshold of 0.90. Note that we have truncated the author name to include only the first initial because neither authors, inventors, publishers, nor database vendors are consistent in their use of multiple initials. Although this choice increases the effect of homonymy in our analysis, it reduces the synonymy dramatically. We rely on the rareness fraction to reduce the effect of homonymy. The method used to process and match the author and inventor data is as follows: • • •
Using all author/institution pairs from the Scopus data, all author names were converted to authfi strings (last name with first initial), and the Scopus orgid was used for the institution affiliation. For each unique authfi, the fraction of papers by institution was calculated, following the example given in Table 1. The sum of the fractions for each unique author string should be equal to 1.0. Using all inventor/assignee pairs from the patent data, all inventor names were converted to strings in last name with first initial format, to match the author format. Assignee data were used for institutional affiliation. In the case of one assignee, the inventor was given that institutional affiliation. In the case of no assignee, the affiliation was left null. In the case of multiple assignees, additional logic was used to link inventors with assignees – first using common city, then common state, and finally common country.
This is a preprint of a paper published at Journal of Informetrics (2008), vol 2, 173-182.
•
•
For each unique inventor string, the fraction of patents by assignee was calculated (NULL was considered an assignee), following the example given in Table 1. The sum of the fractions for each unique inventor string should be equal to 1.0. Author strings and inventor strings were then matched at different rareness fraction thresholds. For example, using a threshold of 1.0, the author and inventor strings were required to match exactly, and both fractions were required to be 1.0. For a threshold of 0.7, the author and inventor strings were required to match exactly, and both fractions were required to be 0.7 or higher.
The results of this process are shown in Table 2. We matched name strings down to a fractional threshold of 0.7. At this level, 56,774 unique author strings matched inventor strings. Additional matching could be done down to fraction > 0.5, and still preserve the feature that each unique name string will occur only once. If matching were done at fraction = 0.5, it would introduce the case where many author strings will be given twice, each with a fraction of 0.5. We would expect the precision of matching to drop drastically at this point. Table 2. Results of the inventor-author name matching process at different fractional thresholds. Rareness fraction range
# auth names
# inv names
f = 1.00 1.0 > f > 0.9 1.0 > f > 0.8 1.0 > f > 0.7 1.0 > f > 0.6 1.0 > f > 0.5 1.0 > f > 0.5 UNIQUE (authfi) UNIQUE (authfi+inst)
1,106,404 1,138,340 1,222,530 1,305,848 1,462,269 1,512,207 1,971,180 2,182,303
278,146 281,214 292,594 304,527 330,886 335,987 425,546 436,521
8,712,536
1,049,650
Inv-auth Matches
Inv-auth + institution matches
35,360 38,842 47,454 56,774 76,027 84,402 148,532
7,843 9,068 11,362 13,440
Fraction valid matches 0.222 0.233 0.239 0.237
# patents
NULL assignees
18,816 25,370 34,653 42,129
3,708 3,973 4,653 5,391
Note that we did not require a country or institutional match to this point in the process. This was done for two reasons; first, we wanted to measure the precision of matching based on rare names only, without other filtering; second, the institutional names used in the Scopus and USPTO databases are often quite different for the same institution (e.g. University of California, San Diego vs. Regents of the University of California), and we were keen to avoid the cleaning steps. To validate inventor-author pairs, each of the 56,774 inventor-author matches was visually inspected for an institutional match to determine the actual matches; the resulting numbers of validated pairs (those with institutional matches) is given in Table 2. Interestingly, at a rareness fraction of 1.0, the valid matching rate is only 22%. There were another 10.5% of the inventor-author pairs where the patent assignee was NULL. (This is only slightly lower than the overall NULL assignee rate of 11.8%.) Some of these would undoubtedly be matches if the patent owner were named. However, if the rate at matching null assignees is similar to that of matching named assignees, the resulting matching rate would only be .222/.895 = 25%. This suggests that even among the
This is a preprint of a paper published at Journal of Informetrics (2008), vol 2, 173-182.
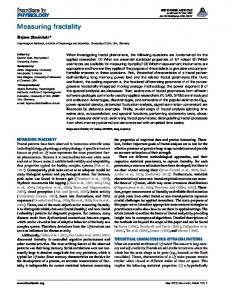
rarest of names, those where there is only one affiliated authoring institution and only one patenting institution, roughly ¾ of the presumed inventor-author pairs are actually two different people, one who writes papers at one institution, and another who patents at a separate institution. When the rareness threshold is lowered to 0.8, the valid matching rate actually increases from 22% to nearly 24%. For the next rareness increment, for thresholds down to 0.7, the matching rate decreases slightly. It is important to mention that our method does not match inventor-authors in cases where the author is an academic researcher whose patents are assigned to companies rather than to the academic institution. Research on this effect was reviewed in section 2. However, our results, showing that even among the rarest of names, ¾ of inventor-author name matches are false, suggest that the academic inventor matching techniques used by Noyons et al. (2003), Meyer (2006), and others, may actually overstate academic involvement to some degree. Those methods assume that a name match between an academic author and an inventor of a non-academic patent in the same country are the same person, and do not account for the fact that there may actually be an inventor at the assignee institution with the same name. To be fair, those methods do match on multiple initials, and are thus more precise in that regard, undoubtedly giving rise to fewer false hits than in our method. Yet, rare names are often rare because they are indigenous to specific countries or regions. Thus, limiting matches to within-country matches does not assure accurate matching. 4. Discussion 4.1 Distribution by IPC sections The numbers of unique patents for which the validated inventor-authors were listed as inventors is given in Table 2. At the fraction > 0.7 level, 42,129 patents were identified. Of these, 41,803 patents were assigned to IPC subclasses (4-character) shown in the IPC8 classification guide (WIPO, 2006). This is 5.09% of all U.S. patents issued (in those same IPC subclasses) during the years 2002-2006. The remaining few hundred patents are design patents and other patents not classified in one of the standard IPC subclasses. The IPC8 guide (WIPO, 2006) lists 8 sections (A-H), 129 classes (3 character codes such as A01), and 639 subclasses (4 character codes such as A01B). In addition, the 8 sections are subdivided into named groupings that loosely correspond to 2 character codes, such as A0. In order to quantitatively link patents to scientific disciplines, we need to know if our 5% sample of the patents is representative of the actual distribution of science-oriented patents. Figure 1 shows the distribution of our sample of 41,803 patents with respect to the distribution of all patents, and to the distribution of patents containing non-patent references. Results are shown by IPC subsection (twocharacter codes) using only the primary IPC code for each patent. Secondary classifications are not considered here. Category B8, related to nanotechnology, is a very new category, with few patents, and has been omitted from the chart. Perusal of the Figure 1 suggests that our sample of patents is not representative of the distribution of all patents. The differences become even greater if viewed at the level of the 129 IPC3 codes. There may be many reasons why our 5% sample is not representative. Here we explore two of those reasons.
C3
CRYSTAL GROWTH
C0,1
CHEMISTRY
G2
NUCLEONICS
C2
METALLURGY
A6 G0,1 H0
ELECTRICITY
HEALTH; AMUSEMENT
B0
SEPARATING; MIXING
D2
PAPER
E2
EARTH OR ROCK DRILLING; MINING
F0
ENGINES OR PUMPS
B2,3 A0
AGRICULTURE
F2
LIGHTING; HEATING
B4
PRINTING
D0
TEXTILES OR FLEXIBLE MATERIALS
F1
ENGINEERING IN GENERAL
A2
FOODSTUFFS; TOBACCO
F4
WEAPONS; BLASTING
B6
TRANSPORTING
E0
BUILDING
A4
This is a preprint of a paper published at Journal of Informetrics (2008), vol 2, 173-182.
PERSONAL OR DOMESTIC ARTICLES
INSTRUMENTS
Inv‐auth sample Patents with NPR All patents
SHAPING
0.0%
5.0%
10.0%
15.0%
20.0%
25.0%
30.0%
35.0%
Percentage share, US patents, 2002‐2006
Figure 1. Distribution of patents assigned to validated inventor-authors by IPC subsection. Subsections are ordered (top to bottom) by the ratio of patents by our inventor-author sample to all patents to show an ordering of relative science orientation. First, there may not be equal likelihoods for different patents categories to link to science. If one assumes that the sample distribution should be the same as the actual patent distribution, this contains the implicit assumption that each patent (and thus each patent class) is equally likely to have an inherent linkage to the science that is being published today. We believe that this is a poor assumption for intuitive reasons. As an example, we would expect the computer industry to be highly linked to science because increases in computing are tied to semiconductor processes whose advances are taking place at the micro-scales that are the subject of current scientific endeavors worldwide. By contrast, new methods of assembling clothing or furniture, or a new tool used in the construction industry, are most likely due to advances in engineering, rather than to advances in the science that is published in peer reviewed journals. Verbeek et al. (2002) also found that some technology fields are highly science-dependent while others are not.
This is a preprint of a paper published at Journal of Informetrics (2008), vol 2, 173-182.
Our intuition about the likelihood for different patent classes to be inherently linked to science is reflected in the sample distribution, and also in the NPR distributions shown in Figure 1. For example, categories A4 (Personal and domestic articles), B6 (Transporting), and E0 (Building) are highly under-represented by our sample. The categories in section F (Mechanical engineering) are also under-represented, but to a lesser extent. These are examples of categories that are engineering based rather than science based. By contrast, categories C0,1 (Chemistry), G0,1 (Instruments) and H0 (Electricity) are over-represented. These categories are all tied to basic sciences on an intuitive level. Although at first glance one might think that G0,1 (Instruments) is engineering based, it is the major category within section G (Physics), and thus does tie back to basic science. The second reason we wish to mention is that these differences may represent the different propensities for inventors in different industries to publish. Some companies and industries have an unwritten policy not to publish (e.g. the American automobile industry). This is likely a confounding factor, but not the primary one, given the arguments listed for the first reason above. Taken by itself, this explanation would require the assumption that all patents are equally likely to link to science, which we have already shown is not likely. These arguments suggest that our 5% sample of patents, while not representative of the actual patent distribution, is reasonably representative of the distribution of patents that actually link to science from a patent classification standpoint. 4.2 Distribution by country It is also informative to look at the country distribution of the sample using inventor addresses. Country shares and rank are shown in Table 3 for all patents, patents with NPR, and our inventor-author based sample. Fractional counting at the patent level was used in all three cases. Comparison of the shares and rankings for the three different cases gives rise to some interesting observations. First, a comparison of patents with NPR to all patents can show the relative propensity of a nation to patent in fields that have an interaction with science. For example, the United States, although it has the largest share of US patents by any measure, has a larger share of patents with NPR than would be expected from the shares of all patents. This would suggest that the United States has a higher than average propensity to patent in areas related to science. The same thing can be seen, although to a lesser degree, for the United Kingdom, Canada, Israel, and several other countries further down the list. By contrast, Japan, South Korea, and Taiwan have shares of patents with NPR that are far lower than would be expected from their shares of all patents. This is most pronounced for Taiwan, whose share of patents with NPR is only about 20% of the expected value. It would be easy to assume that these countries have a propensity to patent in fields that have lower interaction with science. However, other factors suggest a closer look. It is well known that the science base in these countries is heavily weighted toward engineering and the physical sciences (see, for example, Figure 3 in King (2004) for a citation share distribution for Japan) 5 . Since these are precisely the fields with the highest science-technology interaction, corresponding to IPC sections C, G, and H (see Figure 1), it is difficult to understand why these countries would not have larger fractions of patents with NPR. We note that these are all Pacific Rim countries with very different patenting systems and cultures than are found in the United States and Europe. There could be some systematic reason related to culture that results in lower than expected NPR rates, even when these patents are examined and granted within the US system. 5
Unpublished work by the authors shows very similar science profiles for Japan, China, Korea, and Taiwan.
This is a preprint of a paper published at Journal of Informetrics (2008), vol 2, 173-182.
Table 3. Distribution of patents by country. The top 25 countries are ordered by share of patents with NPR (non-patent references).
Country United States Japan Germany United Kingdom France Canada South Korea Netherlands Israel Sweden Switzerland Italy Taiwan Australia Finland Belgium Denmark India Austria Singapore China Russian Federation Spain Norway Ireland
All patents Rank Share 1 51.5% 2 21.1% 3 6.5% 6 2.2% 7 2.2% 8 2.0% 5 2.7% 10 0.9% 13 0.7% 11 0.8% 12 0.8% 9 1.0% 4 3.4% 14 0.6% 15 0.5% 16 0.4% 18 0.3% 21 0.2% 17 0.3% 20 0.3% 19 0.3% 25 0.1% 22 0.2% 23 0.1% 26 0.1%
Patents with NPR Rank Share 1 59.0% 2 16.7% 3 6.1% 4 2.6% 5 2.3% 6 2.2% 7 1.7% 8 0.9% 9 0.9% 10 0.8% 11 0.8% 12 0.8% 13 0.7% 14 0.7% 15 0.6% 16 0.5% 17 0.4% 18 0.3% 19 0.3% 20 0.2% 21 0.2% 22 0.2% 23 0.2% 24 0.1% 25 0.1%
Sample Rank Share 1 64.5% 2 13.3% 3 8.7% 6 1.4% 4 2.6% 5 1.6% 19 0.1% 8 1.1% 10 0.9% 12 0.4% 9 1.1% 7 1.2% 24 0.1% 17 0.2% 11 0.6% 13 0.4% 14 0.4% 16 0.3% 15 0.3% 22 0.1% 29 0.0% 23 0.1% 20 0.1% 18 0.1% 28 0.0%
ShareS / ShareNPR 1.09 0.79 1.42 0.54 1.13 0.75 0.07 1.14 0.99 0.50 1.36 1.57 0.09 0.28 0.91 0.86 1.03 0.91 1.23 0.37 0.18 0.53 0.60 0.89 0.40
Second, comparison of the sample share with the share of patents with NPR, the ratio of which is shown in the last column of Table 3, leads to observations about the usefulness of using rare names to identify inventor-authors by nation. Countries with a share ratio greater than 1.0 are over-represented using our rare name method of identifying inventor-authors, while those with a share ratio less than 1.0 are under-represented. The most overrepresented countries percentagewise are Italy, Germany, Switzerland, and Austria. Three of these four are dominated by Germanic names; thus a case can be made that Germanic names have a higher level of rareness than names from other languages. On the other end of the scale are the Asian names. South Korea, Taiwan, and China each have share ratios of less than 0.2. Japan has far more rare names than its Pacific Rim counterparts, but still less than many other countries, with a share ratio of 0.79. English names show diverse behavior; the United States is unexpectedly over-represented with a ratio of 1.09, while the United Kingdom (0.54), Canada (0.75), Ireland (0.40), and Australia (0.28) have far fewer rare names among inventor-authors. We have no means of explaining this difference among English-speaking countries. In short, our method of identifying inventor-authors using rare names does not provide a representative sample when considered by nation or language. However, this does not
This is a preprint of a paper published at Journal of Informetrics (2008), vol 2, 173-182.
seem to be a problem when considering the purpose of the study – to quantify science-technology overlap on a broad basis. The results of section 4.1and Figure 1 suggest that our sample is sufficiently representative for this purpose. 4.3 Map of IPC classes Figure 1 showed science-technology interaction at the level of 22 IPC subheadings. A much more detailed view of the interaction is possible if one maps IPC subclasses. Figure 2 shows a visual map of 290 IPC subclasses (4character codes), generated from co-classification of IPC subclasses. The patent map was generated using the same process and algorithms we have used previously to generate maps of scientific journals (Boyack, Klavans, & Börner, 2005) and papers (Klavans & Boyack, 2006b). Co-classification counts were assigned for a pair of IPC subclasses if code1 was primary and code2 was secondary for a single patent. Counts were then summed by subclass pairs over all patents, the matrix was made symmetric by adding the upper and lower halves, and a K50 similarity measure (Klavans & Boyack, 2006a) was calculated. Given the number of very small subclasses, we kept only those subclasses with a total of 150 or more co-classification counts. Thus, only 290 of the original 639 IPC subclasses were represented in the final co-classification matrix. Of the 9,966 pair-wise similarities between classes (23.8% of the matrix elements were non-zero), only 940 edges remained after the edge pruning that is part of our layout process (Klavans & Boyack, 2006b). The resulting layout, visualized in Pajek (Batagelj & Mrvar, 1998), is shown in Figure 2. Node sizes reflect the relative numbers of patents by class. Labeling of the map was done by hand at two different levels. First, most visually identifiable clusters in the map were labeled using examination of both the IPC subclass names and the dominant institutional assignees in the clusters. Second, the map was examined to see if it could be labeled by industry. Using industry names from Hoover’s taxonomy of 37 industries, 6 we found that the map could indeed be segmented by industry into contiguous segments. We do not claim that the industry boundaries on this patent map are absolutely precise, but rather show fuzzy boundaries between industries. IPC subclasses are relatively course distinctions, and in many cases a single subclass may belong to multiple industries, much as many large companies serve multiple industries. Seventeen of Hoover’s 37 industries are represented on the patent map. In two cases industries have been combined: Automotive and Aerospace & Defense in one case, and Computer Hardware + Software in the other. In these two cases, any division between the industries based on locations of IPC subclasses on the map would have been artificial. Some industries are completely surrounded by others in patent space. For example, the Telecommunications and Computer industries are bounded by Electronics on both sides. All but one of the industries have drawn boundaries on the map. The one exception is the Consumer Products industry, which comprises all of the unbounded space. The patent map shown in Figure 2 could be the subject of an entire paper. Many stories about technology and industry linkages could be told. Although such an analysis would undoubtedly be interesting, we choose to maintain our focus here on science-technology interaction, and limit our interpretation of the map to that end. In Figure 2, node color is related to science-technology interaction. Here, relative science-technology interaction values were calculated as the ratio of the fraction of patents in the sample to the fraction of all patents by class. Darker nodes, those with ratios over 1.15, show areas where science-technology interaction is high, while lighter nodes (white or very light) with ratios lower than 0.87 show areas where the interaction is low. 6
Hoover’s is a Dun & Bradstreet company that collects and sells detailed business information about companies and industries. Their free industry taxonomy is available at http://www.hoovers.com/free/industries/.
This is a preprint of a paper published at Journal of Informetrics (2008), vol 2, 173-182.
Consumer Products
Packaging
Construction Vehicles, Parts
1.50 < Ratio
Welding
1.15 < Ratio