Measuring the Alignment between Business Processes and Software Systems: a Case Study Lerina Aversano
Carmine Grasso
Maria Tortorella
Department of Engineering
Department of Engineering
Department of Engineering
University of Sannio, Via Traiano 1 82100 Benevento Italy
University of Sannio, Via Traiano 1 82100 Benevento Italy
University of Sannio, Via Traiano 1 82100 Benevento Italy
+390824305551
+390824305551
+390824305554
[email protected]
[email protected]
[email protected]
ABSTRACT
adequately supports a business process when it is executed [3].
The alignment degree existing between a business process and the supporting software systems strongly affects the performance of the business process execution. Methods are needed for detecting this kind of alignment and keeping a business process aligned with a supporting software system even when one of the two evolves. Actually, any modification performed in the business process activities and/or supporting software systems may impact the process activities and/or software components, in terms of input/output and/or purpose and, therefore, cause misalignment. This paper proposes a framework including a set of metrics codifying the alignment concept with the aim of measuring it and detecting misalignment if it occurs. The application of the framework is explored through a case study.
Software engineers very often have to deal with cases in which some misalignment occurs, and, as a consequence, the business process is not effectively supported by a software system. This may cause a decreasing of business process performance. Software innovation activities have to consider the alignment level existing between business processes and supporting software systems. In the best of the authors’ knowledge, research and industry have only marginally addressed these aspects. Even if business processes and supporting software systems appear aligned in a certain operation context, modifications of this context can cause a misalignment between them. Misalignment must be detected and alignment actions must be identified and executed. The re-alignment consists of modification interventions that involve one or more objects of the analyzed business process, which are mainly activities, and components of the supporting software systems. The modification impacts on the other objects must be detected and, on the basis of the relations between those objects, changes must be planned. For example, in order to avoid misalignment, a change of a business activity may require modifications of the software system components supporting it and/or dependent activities. On the contrary, modifications of a software system component may require the analysis and modifications of the activities it supports and/or other software components.
Categories and Subject Descriptors D.2 Software Engineering [D.2.7 Distribution, Maintenance, and Enhancement]: Corrections, Documentation, Enhancement, Extensibility, Portability, Restructuring, reverse engineering, and reengineering, Version control.
General Terms Algorithms, Management, Measurement, Documentation, Performance, Design, Economics, Reliability, Experimentation, Languages, and Verification.
Monitoring the existing alignment degree between business process and software systems involves measurement activities that have to be continuously executed in the operative business context.
Keywords Software system evolution, Impact analysis, Business process modelling, Empirical study.
In [4], a coarse grained strategy was proposed for detecting misalignment between software systems and supported business processes if a change was executed. The alignment degree was expressed by the use of two attributes expressing the Technological Coverage of a business process and Technological Adequacy with which each business activity was technologically supported. This paper enhances the previous work and proposes a framework for alignment detection by introducing a set of finegrained metrics whose aggregation allows evaluating the two attributes previously introduced.
1. INTRODUCTION The alignment of business processes and software systems is a critical concern for the organizations, as it directly affects their performance. It indicates at which extent, the software system Permission to make digital or hard copies of all or part of this work for personal or classroom use is granted without fee provided that copies are not made or distributed for profit or commercial advantage and that copies bear this notice and the full citation on the first page. To copy otherwise, or republish, to post on servers or to redistribute to lists, requires prior specific permission and/or a fee. SAC’10, March 22-26, 2010, Sierre, Switzerland. Copyright 2010 ACM 978-1-60558-638-0/10/03…$10.00.
The rest of the paper is organized as follow: Section 2 gives an overview of the related work on this topic; Section 3 describes the
2330
systems and business processes and (ii) the definition of two types of links existing between the concepts of these models.
proposed misalignment detection framework with the metrics used for supporting its application; Section 4 presents a case study aiming at highlighting how the approach can be applied; and final remarks are given in the last section.
3. A FRAMEWORK FOR MEASURING THE ALIGNMENT
2. RELATED WORK
Measuring the alignment requires the quantitative codification of the alignment existing between a business process and the supporting software systems. This involves the identification of suitable metrics for codifying the alignment level.
The issue of alignment was mentioned for the first time in the late 1970s and since then several studies and researches were conducted highlighting the alignment concerns [10]. A view of business and technological alignment defines at which degree the information technology mission, objectives, and plans, support and are supported by the business mission, objectives, and plans [3]. Moreover, it involves “fit” and “integration” among business strategy, IT strategy, business infrastructure, and IT infrastructure [1, 2].
This paper considers the two attributes proposed in [4], i.e. the Technological Coverage and Technological Adequacy, and performs a fine-grained analysis for obtaining more objective and precise measures. Actually, the previous framework considered just the business activities for evaluating the cited attributes, while the solution proposed in this paper focuses also on other resources, such as actors and informative assets, and control flow among activities.
Understanding what business and information systems alignment is, how to obtain it and therefore maintain it, is a “problem” [11]. Traditional approaches addresses the alignment concern seeking an answer to how can organizations achieve alignment, but with little contribution on how to identify and correct misalignments.
The assessment of the alignment degree is performed through the definition of a measurement framework, defined on the basis of the Goal Question Metrics (GQM) paradigm, defined by Victor Basili [12, 13]. The use of this paradigm starts from the definition of the evaluation goals, and analyzes the questions to be answered for reaching the stated goals and the metrics to be assessed for answering the questions.
In [9], criteria and associated generic metrics are proposed to quantify at which extent there is a fit between the business and the system which supports it. In [5], a framework is presented for analyzing the alignment problem and proposing an approach to application architecture design with reference to a business context.
In the analyzed context, the measurement goal can be formulated as follows:
The Business and Information Systems MisAlignment Model (BISMAM) is proposed in [6, 8], to understand, classify and manage misalignments. The proposal addresses the alignment problem combining misalignment approaches with medical sciences approaches, based on a metaphor between misalignment and disease. The authors believe that the misalignment approach is closer to organizations real life and that medical sciences approaches provide relevant concepts and techniques for misalignment classification and management.
Analyze a business process and the supporting software systems with the aim of evaluating the alignment level existing between them from the point of view of the software engineer. The questions to be answered for achieving this goal are: Q1. Which is the Technological Coverage (TC) of the business process? Q2. Which is the Technological Adequacy (TA) of the business process?
Finally, as previously said, the authors of this paper proposed a coarse grained strategy [4] for detecting misalignment between software systems and supported business processes when a change is executed. The approach considered two attributes for evaluating the alignment degree and they are: Technological Coverage and Technological Adequacy. The Technological Coverage was evaluated as the percentage of process activities supported by software systems. While the Technological Adequacy expressed how adequate was the used software systems for supporting the business activities. It was derived from the values assumed by the same attribute evaluated on each activity.
Other questions can be formulated on the basis of the business process complexity and characteristics of the activities. As it is shown in Figure 1, the metrics considered in the measurement framework can be brought to the essential aspects involved in a process model. In particular, the evaluation of the metrics involves: - Activity: referring the lowest level of details of the performed human tasks with reference to the business process - Resource: regarding all the resources involved in the activity execution, including both human resources (Actors), and inputs/outputs data required to perform the activity (Artefacts). The term artefact is used for pointing out information considered in the business process at any granularity level: variable, structured and unstructured documents, images, e-mails, and so on.
The Technological Coverage and Technological Adequacy are further explored in this paper for proposing a fine grained method detecting misalignment between business process and software system. In particular, this paper extends the previous approach by considering a set of metrics allowing the evaluation of different and complementary aspects of the alignment relationship. These metrics rely on (i) the use of models for representing the software
2331
Goal
Q2
Q1
Which is the Technological Adequacy (TA) of the business process?
Which is the Technological Coverage (TC) of the business process?
Activity Coverage (AC)
Actor Coverage (AcC)
Artefact Coverage (AtfC)
Activity
Transition Coverage (TC)
Activity Adequacy (AA)
Resources
Artefact Adequacy (AtfA)
Actor Adequacy (ActorA)
Control Flow
Figure 1. GQM Framework for measuring the Alignment.
Activity Coverage (AC) evaluation:
- Control Flow: defining the flow among the process activities, including sequences, alternatives, iterations, parallel and pre/post conditions.
AC
The business process entails the interaction of the essential aspects listed above. In particular, an activity is executed by actors by using some artefacts. An activity performs operations of searching, using and/or defining artefacts. In the proposed framework, an artefact is modelled as a class related to a business activity, whose methods regard the operations the activity foresees. Obviously, more than one activity accesses an artefact by performing different operations. The evaluation of an activity takes in consideration only the operations (methods) it executes with reference to an artefact.
# BPAS # BPA
Let’s call BPA the set of the Business Process Activities and BPAS the set of Business Process Activities Supported by software systems. Obviously BPAS is a subset of BPA. Then, AC is evaluated in terms of number of the business process activities supported respect the total number of the process activities. Actor Coverage (ActorC) evaluation:
ActorC
A representation of the hierarchical structure of the GQM model is depicted in Figure 1. The goal is refined in two questions that break down it into its two major components with reference to the Technological Coverage and Technological Adequacy. Each of the two questions is then refined into metrics.
# BPActorsS # ( BPActors SSActors ) # BPActors # BPActors
Let BPActors be the set of the Actors involved in the Business Process Activities and BPActorsS the set of Actors involved in the business process and whose activities are supported by the software system. Even in this case, BPActorsS is a subset of BPActors as some actors could be forced to manually execute their activities. In particular, the business actors supported by the software system are identified through the intersection of the sets of actors included in the software system design, SSActors, and BPActors. ActorC is computed as the ratio between the number of the actors supported by the software system and the number of actors involved in the Business Process.
3.1 Technological Coverage For answering question Q1, the measurement framework analyses the coverage level for each of the three essential aspects previously listed. In particular, the considered metrics are: Activity Coverage (AC), Actor Coverage (ActorC), Artefact Coverage (AtfC). They are evaluated from the technological support point of view, basically expressed in terms of number of supported activities, actors and artefacts. In addition, the Transition Coverage (TC) is considered for evaluating the offered support from a dynamic point of view.
Artefacts Coverage (AtfC) evaluation:
AtfC
The metrics are evaluated as follows:
2332
# BPAtfS # ( BPAtf SSAtf ) # BPAtf # BPAtf
Let’s call BPAtf the set of the Artefacts used/defined in the Business Process Activities and BPAtfS the set of Artefacts used/defined in the Process Activities that are also managed by the software system. Of course, the BPAtfS is a subset of BPAtf as some artefacts could be supported by the software systems. In particular, the business artefacts managed by the software system are related to the intersection of the sets of artefacts managed by the supporting software system, SSAtf, and BPAtf. AtfC is computed as the number of the artefacts used/defined by the software system and the number of artefacts considered by the business process.
where AtfAi is the automatic support adequacy of artefact i. AtfAi is computed by considering the methods of the business class associated with artefact i that are implemented in the corresponding class of the supporting software system. AtfAi is evaluated as:
AtfAi
where BMAtfi is the set of methods of the i business class and BMAtfSi is the set of methods supporting the business activities and implemented by the software system. BMAtfSi is calculated as the intersection of BMAtfi and the implemented methods SM.
Transition Coverage (TrC) evaluation:
TrC
# BPTS # ( BPT SST ) # BPT # BPT
Activity Adequacy (AA) The Activity Adequacy expresses how adequate is the automatic support offered to the business activities. It is evaluated as the average of the automatic support adequacy offered to each business activity. Then, AA is evaluated as:
BPT is the set of the transitions that models the control flow among the Business Process Activities and BPTS, the subset of transition that are automatically controlled by the software system. In particular, the transitions controlled by the software system are identified through the intersection of the sets of transition implemented by the software system, SST, and BPT. TrC is computed as the ratio between the number of the transitions supported by the software systems respect the total number of transitions exhibited from the Business Process.
AA
AA
iBPAS
AC ActorC AtfC TrC 4
AAi
3.2 Technological Adequacy
# BPA
AtfA
jBPAtfSi
# BMAtfi
Actors Adequacy (ActorA) The Actor Adequacy expresses how adequate is the automatic support offered to the business actors. It is evaluated as the average of the automatic support adequacy offered to each business actor. Then, ActorA is evaluated as:
The metrics are evaluated as follows:
ActorA
Artefact Adequacy (AtfA) The Artefact Adequacy expresses how adequate is the automatic support offered to the business process artefacts. It is evaluated as the average of the automatic support adequacy offered to each artefact modelled in the considered framework as a business class. The business class includes as many methods as the operations required from the business activities execution with reference to the considered artefacts. Then, AtfA is evaluated as:
ActorA
i
iBPActorS
# BPActors
where ActorAi is the adequacy of the automatic support offered to actor i. For the reasons previously explained, ActorAi is computed by considering the automatic support adequacy of each activity j belonging to the set BPASi of all the activities the actor i executes, AAij. ActorAi is evaluated as:
AtfA
iBPAtfS
ij
where BPAtfi is the set of the artefact activity i uses/defines.
For answering the second question, Q2, the measurement framework analyses the adequacy of the support provided by the software system to the business activities, artefacts and actors. In particular, the considered metrics are: Activity Adequacy (AA), Artefact Adequacy (AtfA), Actor Adequacy (ActorA). They are evaluated by measuring similar metrics on each single activity, artefact and actor.
AtfA
i
where AAi is the automatic support adequacy of activity i. For the reasons previously explained, AAi is computed by considering the automatic support adequacy of each artefact j belonging to the set BPAtfSi of the artefacts the activity i uses, AtfAij. AAi is evaluated as:
The final value of the Technological Coverage is achieved by aggregating the listed metrics. In particular, it is computed as the average of AC, ActorC, AtfC and TrC:
TC
# BMAtfS i # ( BMAtf i SM ) # BMAtf i # BMAtf i
ActorAi
i
AA
jBPASi
ij
# BPAi
# BPAtf where BPAi is the set of activities requiring the participation of actor i.
2333
context. The analysis of the business process model allowed the identification of all the business activities. In addition, the analysis of each activity permitted to identify its executors in terms of actors.
Once evaluated the adequacy of the automatic support offered to each activity, actor and artefact, it is possible to calculate the final value of the Technological Adequacy. In particular, the obtained values, AA, AtfA, ActorA, are aggregated by an average formula.
TA
AA AtfA ActorA 3
An analogous analysis of the SANTACLAUS software system and available documentation, permitted to extract a similar set of information. All the concepts required for evaluating the different metrics were identified from the set of business and software information specified above.
3.3 Interpreting the Misalignment The goodness of the evaluated alignment degree has to be interpreted with reference to the automation level of a business process wished from the organization hosting the process. In other terms, a business process may not be completely automatically supported, as it includes some activities that can be only manually executed. In this case, the technological coverage and adequacy of the business process cannot reach the maximum value. Therefore, the organization has to express two target values indicating the minimum wished technological coverage and adequacy with reference to a certain business process. The two values are called Thre_TC and Thre_TA and indicate the threshold of Technological Coverage and Technological Adequacy, respectively. In addition, Thre_TA can be calculated with reference to each single activity i, Thre_TAi.
GUI
Operator
MngDB
Start of the donation procedure Loading of users and categories Visualization of the input donation form User selection
Input of the user data
Setting of the user data
Storing of the user data
printOnLog selection of the items for donation
Once the alignment is defined and the parameters TC and TA are evaluated, a change can cause Thre_TC > TC. The change can be due to a management (introduction and/or modification of an activity) or technological (modification of the software system) innovation and it can bring to the decreasing of the technological coverage potentially causing misalignment. Analogously, the change performed, for example, on activity i can cause the decreasing of the technological adequacy for that activity, obtaining Thre_TAi > TAi. This indicates misalignment in activity i. This misalignment must be detected and repairing actions must be identified and performed for re-establishing the alignment.
Input confirmation
Setting of the data donation
Save and Close
Save and Continue
printOnLog
show success msg
Setting of the data donation
It can also happen that a change does not decrease the values of the parameters, preserving the alignment. This can happen if, for example, a not automatically supported activity is deleted or technological innovations increases both TC and TAi, for some i.
Storing of the data
Storing of the data
printOnLog
show success msg
4. A CASE STUDY
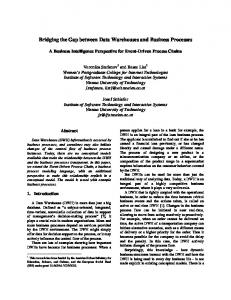
Figure 2. Model of the business process using SantaClaus
In order to evaluate the effectiveness of the proposed framework, it has been applied to the business process used by a voluntary association, named BENESLAN, to manage object donations for needy children (http://santaclaus.beneslan.it/). For the sake of space, only a part of the donation business process is shown in Figure 2. It is executed by operators of the voluntary association. Actually, the total number of activities of the full considered process is 28.
The metrics were, then, applied on the basis of their definitions. They have been automatically evaluated by using a Java application supporting the analysis and computing activities. In particular, the analytical data measured for each activity, artefact and actor are provided in Table 1. The screenshot in Figure 3 shows how the formulas have been applied and the metrics computed. Table 2 includes just a summary of the evaluation of the metrics. The aggregation of all the measures leads to a value of 0.747 calculated for the Technological Coverage, TC, and a value of 0.587 computed for the Technological Adequacy, TA. These data indicate that even if the SANTACLAUS software system offers a support to the donation business process execution, this does not reach a good level of adequacy. In particular, considering the values of the metrics, it is possible to notice that the main lack of support is related to the way the artefacts are managed. In fact, the Artefact Adequacy, AtfA, is the metric that reaches the lowest adequacy value. This aspect also emerges by
The considered business process is supported by a software system, named SANTACLAUS (http://santaclaus.beneslan.it/santaclaus/), a web application written in PHP and Java. The donation business process and software system SANTACLAUS has been analysed and evaluated for determining their alignment degree. The aim of this case study is to show the applicability of the proposed alignment evaluation framework in a real operative
2334
looking at the coverage values that reach the lowest measure for the artefact.
Table 1. Analytical measures. Metrics Actors Adequacy: ActorAi Actor1: gesDB Actor2: Operator Actor3: Gui+GesAllocation Actor4: Gui Actor5: Guest
Only some activities are listed. The table highlights that: one artefact (Donation) is taken in consideration by the business activities, but the software system does not implement classes for their automatic management; some artefact (Town and User) are considered by the business process, but not all the operations needed for automatically managing them are implemented in the corresponding software classes. In any case, Table 1 highlights also that the business artefacts Article, District and Category are completely and adequately supported, but the positive values their adequacy reaches is negatively affected by Town, Donation and User technological adequacy.
Values 1.000 1.000 1.000 1.000 1.000
Artefact Adquacy : AtfAi AtfA1: Article AtfA2: District AtfA3: Town AtfA4: donation AtfA5: account AtfA6: user AtfA7: category
0.917 1.000 0.500 0.000 1.000 0.670 0.889
Activity Adequacy: AAi AA1: Start of The donation procedure AA2: Loading of users and categories AA3: Visualization of the input donation form AA4:userSelection AA5:Input of the user data AA6:setting of the user data AA7:storing of the user data AA8:selection of the items donation AA9:input confirmation AA10:.Setting of the data donation
1.000 0.285 1.000 1.000 0.750 0.250 1.000 0.285 1.000 1.000
Table 2. TA and TC values obtained for Santaclaus.
Figure 3. A screenshot with some computed metrics Regarding the actor technological adequacy, ActorA, it is possible to notice that it reaches the highest value, confirming a good support of the software system provided to the actors’ activity execution. However, the actor technological coverage, ActorC, does not confirm this result. Actually, not all the actors are automatically supported, but just 5 of the 7 involved in the business process execution.
METRIC NAME Activity Coverage (AC)
VALUE 0.893
Actor Coverage (ActorC) Artefacts Coverage (AtfC) Transition Coverage (TC)
0.714 0.538 0.843
Technological Coverage
0.747
Activity Adequacy (AA) Actor Adequacy (ActorA) Artefacts Adequacy (AtfA)
0.758 0.714 0.382
Technological Adequacy
0.587
For the control flow aspect, the transition coverage has been evaluated and its technological coverage reaches a satisfying value. Obviously, the final evaluation regarding the alignment degree between the considered business process and supporting software system depends on the threshold, Thre_TC and Thre_TC, codifying the expected alignment level in the specific context where the executing organization works.
Finally, with reference to the business activities, almost all the activities are supported by the SANTACLAUS software system, even if not all of them are adequately automated. This happens for the activity 2 - Loading of users and categories, 8 - selection of the items donation.
5. CONCLUSIONS This work presents a framework for measuring the alignment existing between business processes and supporting software
2335
systems. The framework involves the execution of some activities and evaluation of a set of metrics.
Competitive Advantage, Idea Group, Hershey, PA, 2001, pp.1-24.
In particular, the framework evaluates the Technological Coverage and Technological Adequacy of a software system with reference to a business process. Its application involves the analysis of all the activities, artefacts and actors of the business process.
[3] Reich, B., and Benbasat, I.: Factors That Influence the Social Dimension of Alignment Between Business and Information Technology objectives, MIS Quarterly, 24, 1, March 2000. [4] Aversano, L., Bodhuin, T., Tortorella, M.: Assessment and Impact Analysis for Aligning Business Processes and Software Systems, Proc. of the 2005 ACM Symposium on Applied Computing, ACM press, 2005, pp. 1338 – 1343.
The results of the evaluation of the metrics allow for the identification of a possible misalignment. In particular, they provide a misalignment degree giving a measure of the extent at which the software systems used in a business process supports it. If misalignment emerges, evolution activities need to be planned and executed for re-establishing alignment and guaranteeing the most efficient and effective execution of the business process.
[5] Wieringa, R.J., Blanken, H.M., Fokkinga, M.M., and Grefen, P.W.P.J.: ``Aligning application architecture to the business context.'' In Conference on Advanced Information System Engineering (CAiSE03), Springer Verlag, 2003. LNCS 2681, pp. 209–225 [6] Carvalho, R., Sousa, P.: Business and Information Systems MisAlignment Model(BISMAM): an holistic Model Leveraged on Misalignment and Medical Sciences Approaches, proceedings of BUSITAL 2008.
The measurement framework was described and a case study, referring to a business process and related supporting software system, was presented. Obviously, the evaluation of the adequacy of the way a software system supports a business process could depend also on the way the actors execute it. Therefore, the adequacy measurement should also consider the actors’ opinion. This can be considered in the technological adequacy evaluation and affect the measurement process discussed in this paper.
[7] Korherr, B. and List, B.: A UML 2 Profile for Event Driven Process Chains, Proceedings of the international Conference on Research and Practical Issues of Enterprise Information System(Confenis 2006), Vienna, Austria, IFIP Series, Springer Verlag, 2006. [8] Thevenet, L., Salinesi, C., Etien, A., Gam, I., Lasoued M. :“Experimenting a Modeling Approach for Designing Organization’s Strategies in the Context of Strategic Alignment, AWRE 2006 Adelaide, Australia.
The future work to be performed in the described context will refer the completion of the experimental activities aiming at understanding the framework applicability and refining the set of chosen metrics and mechanisms for their computation.
[9] Etien, and C. Rolland, "Measuring the fitness relationship", Requirements Engineering Journal (REJ), Springer, 2005, 10:3, pp. 184 – 197.
For making more objective and effective the application of the measurement framework formalism will be defined for modelling both business process and software system, so to make directly and graphically comparable the two modelled entities. In this direction, further study will also regard the development of an automatic detection method helping to evaluate the impact of an evolution strategy. The aim is to offer a decision support when a business or software concept needs to evolve in an operative context.
[10] Society for Information Management: IT Management Concerns Survey. What keeps CIO awake at night? (2006) [11] Pereira, C., Sousa, P.: Getting into the misalignment between Business and Information Systems. In: 10th European Conference On Information Technology Evaluation. Madrid (2003). [12] V. R. Basili, G. Caldiera, and H. D. Rombach, “The goal question metric approach”, Encyclopedia of Software Engineering, Wiley, 1994.
6. REFERENCES [1] Henderson, J.C., and Venkatraman, N., Strategic Alignment: Leveraging Information Technology for Transforming Organizations, IBM Systems Journal, 32, 1, 1993, pp. 4-16;
[13] V.R. Basili and D.M. Weiss, “A Methodology for Collecting Valid Software Engineering Data”, IEEE Transanctions on Software Engineering, IEEE CS Press, vol. 10, no. 6, November 1984, pp. 728-738.
[2] Papp, R. Introduction to Strategic Alignment, in R. Papp (ed.), Strategic Information Technology: Opportunities for
2336