or in the area of digital libraries, for example for collections of text documents [4] or. 1. Corresponding Author. 2 https://cabig.nci.nih.gov. 3 http://www.cancergrid.
Metadata Extraction using Text Mining Shivani SETH, Stefan RÜPING1 and Stefan WROBEL Fraunhofer IAIS Schloss Birlinghoven, 53754 St. Augustin, Germany {shivani.seth,stefan.rueping,stefan.wrobel}@iais.fraunhofer.de
Abstract. Grid technologies have proven to be very successful in the area of eScience, and healthcare in particular, because they allow to easily combine proven solutions for data querying, integration, and analysis into a secure, scalable framework. In order to integrate the services that implement these solutions into a given Grid architecture, some metadata is required, for example information about the low-level access to these services, security information, and some documentation for the user. In this paper, we investigate how relevant metadata can be extracted from a semi-structured textual documentation of the algorithm that is underlying the service, by the use of text mining methods. In particular, we investigate the semi-automatic conversion of functions of the statistical environment R into Grid services as implemented by the GridR tool by the generation of appropriate metadata. Keywords. Metadata, Text Mining
1.
Introduction
Grid technologies have proven to be very successful in the area of eScience, and healthcare in particular, because they allow to easily combine proven solutions for data querying, integration, and analysis into a secure, scalable framework. There are a number of projects that aim at developing Grid-based infrastructure for post-genomic cancer clinical trials, the most advanced of which are NCI’s caBIG2 (Cancer Biomedical Informatics Grid) in the USA and CancerGrid3 in the UK and the ACGT4 project, in the context of which this work was developed In order to integrate the services that implement these solutions into a given Grid architecture, some metadata is required, for example information about the low-level access to these services, security information, and some documentation for the user. In this paper, we investigate how relevant metadata can be extracted from a semistructured textual documentation of the algorithm that is underlying the service, by the use of text mining methods. In particular, we investigate the semi-automatic conversion of functions of the statistical environment R [1] into Grid services as implemented by the GridR tool [2] by the generation of appropriate metadata. While the problem of metadata extraction has already been addressed in the field of ontology population [3] or in the area of digital libraries, for example for collections of text documents [4] or 1 2 3 4
Corresponding Author. https://cabig.nci.nih.gov http://www.cancergrid.org http://eu-acgt.org
images [5], the field of metadata for grid services still provides many challenges. One reason is that a grid service is a very complex object, which is usually not described in a uniform and standardized way. In addition, integrating new services often requires manual integration work by the administrator anyway, such that the additional setup of metadata is not much additional work. In contrast, the approach proposed in the paper does rely on a more standardized form of documentation – R help text – and a generic service for the setup of specific single services which very much minimizes the administrator’s work. The remainder of the paper is structured as follows: the next section introduces the GridR service, for which we want to extract metadata, and the ACGT system in the context of which GridR was developed. Section 3 describes our approach to the extraction of metadata, which is empirically evaluated in Section 4. Section 5 concludes.
2.
GridR
GridR is a generic service for the gridified execution of scripts that are written in the statistical language R. GridR was developed in the context of the project ACGT. Before we introduce GridR in detail, let us shortly describe the ACGT system and its approach to metadata. 2.1.The ACGT System In recent years, the rapid development of high-throughput genomics and postgenomics technologies has provided clinicians fighting cancer with new discovery paths and has opened the possibility to develop patient-specific treatment strategies. However, the amount of information now available for each patient (e.g. in microarray context from 10’000s to 100’000s of variables summarizing up-to millions of array features) has rendered difficult the isolation of the clinically relevant information from all available data. Considering the current size of clinical trials (hundreds of patients), there is a clear need, both from the viewpoint of the fundamental research and from that of the treatment of individual patients, for a data analysis environment that allows the exploitation of this enormous pool of data. This is the aim of the Advancing Clinico-Genomics Trials on Cancer (ACGT) project. ACGT aims at developing an open-source IT infrastructure to provide the biomedical community with the tools needed to integrate complex clinical information and make a concrete step towards the tailorization of treatment to the patient. On the data side, the ACGT environment is designed to be versatile and will allow the integration of high-throughput databases with data both from existing (e.g. microarrays, imaging) and future technologies (e.g. high-throughput proteomics). The design of the platform considers the integration of private (i.e. trial-specific) databases with public ones, thus making publicly available datasets potentially immediately available for hypothesis validation and meta-analyses. On the methodology side, the ACGT platform is designed to be modular, allowing to integrate additional data analysis tools (software, both open source and commercial, web services) as plugins, as they become available. Considering that the amount of data generated is expected to rise to several gigabytes of data per patient in a close future access to high-performance computing resources will be unavoidable. Hence, Grid
computing [6] appears as a promising technology. Access and use of Grid-based resources is thus an integral part of the design of the infrastructure. An early decision in the ACGT project was that the statistical package R, which in conjunction with the Bioconductor project [7] has quickly become a quasi-standard in the field of bioinformatics, should become a core data analysis tool. This led to the implementation of GridR, which is described in the next section. The ACGT approach to metadata heavily relies on the introduction of a central metadata repository [8], in which all information about services, workflows, data types, and virtual organizations is stored. Both the ACGT workflow environment and several metadata-aware services make heavy use of the metadata repository. 2.2.GridR GridR is one of the important analysis tools to be used in the ACGT environment. GridR is based on the open-source statistical package R. The R environment provides a broad range of state-of-the-art statistical, graphical techniques and advanced data mining methods (including comprehensive packages for linear and non-linear modeling, cluster analysis, prediction, hypothesis tests, resampling, survival analysis, time-series analysis), it is easy extensible and turned out as the de facto standard for statistical research and many applied statistics project, especially in the biomedical field. The associated project Bioconductor addresses the needs of the biomedical and biostatisticians community for genomic data-analysis oriented R packages. Numerous methods available as R/Bioconductor packages and considered experimental a few years ago have been stabilized and became accepted standard in the analysis of highthroughput genomic data. In the ACGT analysis environment, R is used as a user interface and as an analysis tool. R as user interface is supposed to serve as programming language interface to the ACGT environment. Used as analysis tool, the goal is to achieve a seamless integration of the functionality of R and the ACGT semantic data services in a grid environment, hiding complexity of the grid environment. In order to achieve this level of integration, appropriate metadata is necessary. In a typical usage scenario, the user wants to execute an existing R script. In order to do that, he has to follow some very easy programming guidelines (basically reading script input from a fixed variable x and writing the output of the script into another fixed variable y). He then uploads the script to the metadata repository, in the process of which he has to define the input and output types. The script then becomes available as a standard service, which can be executed in the workflow environment. In the execution of the script, the generic GridR service is called, which loads the actual script from the metadata repository, embeds the R code into appropriate code to download the input and upload the results directly from within R, and executes the script using R in batch mode. However, with the availability of high-quality functions in existing R libraries5, it is often already possible to achieve the needed functionality with a single existing R function. Hence, it is completely meaningful to make available services for each of the single functions in a library. In addition, questions of automatic checking and reusability of algorithms can be addressed much simpler at the level of workflows than at the level of scripts. 5
see the Comprehensive R Archive Network http://cran.r-project.org
3.
Automatic Extraction of Metadata
In Grid systems, metadata is used to describe a service in order to allow automatically integrating it into the system, and allowing the users to understand the operation of the service. In general, metadata can be divided into three categories � Technical metadata contains all information that is necessary to access the service, such as its name, its URL, and its signature, i.e. a description of its input and output types. WSDL [9] is a prominent example of a language to express this type of metadata. � Administrative metadata holds information about the owner of the service and the terms under which one is allowed to operate the service. For example, the Dublin Core Metadata Element Set [10] – which is frequently used to describe digital media, but can also be applied to services - holds the elements Creator, Publisher, Contributor, and Rights to cover the administrative aspects. In Grid systems, security information, such as necessary access rights and where to request access, is important administrative information. � Descriptive metadata finally contains a description of the semantics of the service. It is not necessary for the operation of the services, but for the user to find an appropriate service for their task. Semantics can be described by a simple documentation text, but often ontologies or taxonomies are used to allow a standardized, machine-readable description. A prominent example in the field of biological data can be found in the BioMOBY initiative [11]. The goal of BioMOBY is to create an ontology of bioinformatics data types, define a data syntax for this ontology, create an open API over this ontology and register services in an ontology-aware registry for the MOBY-S system. In the case of the GridR service, which is a generic service which can be instantiated by deploying different R scripts, administrative metadata is usually constant for all scripts. Likewise, parts of the technical metadata can be shared, as it is essentially the same service that implements the execution of all R scripts. Metadata that is dependent on the R script consists of the input and output types and the semantic metadata. Hence, in the remainder of this paper we will only address the questions of how to extract the input and output types of an R function, and how to order the function into a taxonomy of services. 3.1.Metadata Extraction In our approach, we envision the following use case: a system administrator is tasked with integrating a new R library into the Grid system. After installing the actual software, the critical step is to set up appropriate metadata for each function. Luckily, R packages already come with a semi-structured textual documentation of all functions, an example of which can be seen in Figure 1. The documentation is structured into different sections such as Description, Usage, Arguments, Details, Value, References, See Also, and Example. As one can see, the section Arguments is again structured into a list of names and descriptions of the single parameters. The section Value describes the output in a similar, slightly less structured format.
Figure 1: R help text for function "diana"
As the metadata is crucial for the operation of the Grid system, the extraction process is required to achieve perfect accuracy. Wrong metadata on the input and output types would prohibit the function to be executed properly. A wrong entry of the function in the taxonomy of services would stop the user from discovering it in the first place. We will now present how to make use of text mining [12] methods to solve this task. However, in text classification tasks it is difficult to achieve perfect accuracy, in particular on data sets so small as in the case of metadata descriptions. Hence, we aim for a semi-automatic procedure that supports the administrator as much as possible in the setup of the metadata, but relies on the administrator for the final check. This procedure simplifies the metadata extraction process in two ways: � The identification of input and output types reduces to a library-specific mapping of R data types to Grid data types. Generally, Grid data types tend to be more semantically enhanced than R data types, where usually a single data type (data.frame) is used for all data sets. However, in the context of a single library, it is reasonably safe to assume that the R data type does not map to multiple Grid data types. As the documentation of the function arguments and values is already highly structured in R help texts, the identification of the single arguments themselves can be achieved by simple regular expressions. � An iterative procedure allows to significantly increase the available data for the extraction process: In a standard approach, data of functions of other libraries, that have already been integrated into the taxonomy of services, would be used as the basis for learning the extraction process. With an iterative procedure, it is also possible to use information of already processed functions of the same library for the following functions. We will later see that
there may be problems in transferring text mining models from one library to the other, such that data of the same library, even if it is few, is very valuable. In summary, our metadata extraction algorithm can be described as follows: first, a new R library is entered into the system and the help texts are extracted. A text categorization model that maps help texts to their nodes in the taxonomy of services is learned on the R functions that already appear in the taxonomy (it would also be possible to use documentations of other services in the taxonomy as well). Then, for each function of the library the following steps are executed: 1. The inputs and outputs are extracted by regular expressions. R data types are mapped to grid data types by a library-specific translation table, if this data type has already been processed. 2. The function is mapped to its predicted node in the taxonomy by the text categorization model. 3. The user inspects the metadata that is proposed by the system and corrects it, if necessary. 4. If the user has changed the mapping of R data types to grid data types, this is entered in the mapping table 5. If the user has changed the mapping of the function into the taxonomy, an updated mapping model is learned on the old data plus the new function. In the next section, we will describe in detail how to learn the mapping model, and how to set up an optimal order in which the functions should be processed. Some related work exists. An automatic extraction of metadata for services has been investigated in [15], where the semantics of parameters has been characterized by the connections of the service in tried and tested workflows. This means that this approach take place only after the initial integration of the services and after a number uses of the services in a workflow, in contrast to the one presented in this paper. The approach described in [16] uses metadata in the form of an ontology over possible mismatches of outputs and inputs and of services, which is also used to find appropriate functions to perform the necessary translations. This approach could prove to be an ideal addition to our approach to handling inputs and outputs, which relies on the administrator to make the necessary translation between R data types and data types in the workflow.
4.
Experiments
Nine R libraries were chosen for the experiments are conducted. Out of these nine libraries four libraries provide basic data mining and general purpose functions. These are rpart (25), kernlab (50), e1071 (44) and cluster (55). The remaining five libraries are Bioconductor libraries, specifically designed for genomic analysis: affy (56), affyPLM (14), ringo (25), marray (67) and xps (91). The number in brackets following the library name indicates the number of functions that the library contains, making a total of 419 functions in all. These functions were mapped to a taxonomy of functions that was defined for our experiments. Because of the limited number of functions, we opted to not use an existing taxonomy, which are usually very finely grained, but design a new one that contains the basic types of functions that appear in data mining tasks.
Figure 2: Taxonomy of services
Figure 2 shows the taxonomy. The root node has the following six child nodes: 1.
Preprocessing: this node contains functions that are responsible for all kinds of preprocessing of the data, e.g. transformation, filtering and normalization. The input of the functions belonging to this node is a data set and the output is the transformed data set. 2. Functions: this node contains a variety of functions that perform a particular task on the data set. This node is further subdivided into input functions, output functions, learners, and learner application functions 3. Data: consists of functions that contain all kinds of data. This node is further subdivided into datasets, data types, models, and performance values 4. Validation: consists of functions that compute the performance of a given functions over a data set. These are generally statistical functions. 5. Postprocessing: consists of functions that transform the data after the analysis. 6. Auxiliary: this node basically contains functions that cannot be sorted into any other nodes. After the manual mapping of functions to nodes, the postprocessing node received only two functions, which came from a single library. For this reasons, this branch was ignored in the following experiments. For the validation, a process of batch validation has been used. In this process, a model is learned on the data of all libraries except one, and then tested on the data of the remaining library. This process is iterated for each of the libraries. Compared to a standard cross-validation, this better reflects the envisioned use case of adding a complete additional library to the Grid system. In order to investigate whether it is possible to learn the mapping of functions, represented as help texts, into the taxonomy, the following process was designed: help text were converted to lower case, stop words were removed and stemming using the
Porter stemmer was applied. This is a standard preprocessing in Textmining [12]. Following the bag-of-words approach, texts were converted into vectors of word counts, where words appearing in less than 1% of the texts or more than all but 1% of the text were removed. Again, this is standard text mining procedure, with the exception of using word counts instead of TFIDF features (normalized word counts), which performed significantly worse in our experiments. The multi-label classification problem was solved by a Support Vector Machine (SVM), which is the state-of-the-art approach for text classification [14], where binaries SVMs were converted to multiclass classifiers using a one-against-rest approach. In a first experiment, we investigated how good the problem of mapping a function to the 6 top-level branches of the taxonomy could be solved. Table 1 shows the results. Overall, a classification accuracy of 70.3% could be achieved, which is significantly larger than the default accuracy of 36.3% (the default consists of sorting all functions into the largest branch, functions, which correctly classifies 152 out of 419). Table 1. Results for prediction of 1st level nodes pred aux pred data pred func pred pre pred vali class recall
true aux 63 12 16 13 0 60.6%
true data true func true pre 6 24 13 68 5 6 5 116 10 1 7 42 1 0 1 84.0% 76.3% 58.3% Total accuracy 70.26% +/- 9.46%
true vali 2 1 1 4 1 11.1%
Class precision 58.3% 73.8% 78.4% 62.7% 33.3%
Applying the same approach to the 2nd-level prediction problem gives an accuracy of 67.3%. The decrease in accuracy in lower levels is expected, because of the lower ratio of examples over classes (the lower the level, the more nodes have to be predicted). In order to investigate if a combination of the 1st- and 2nd-level classifiers could improve the situation, we investigated if the correlation between both classifiers at the 1st level, i.e. we checked if a function that was falsely predicted at the 2nd level was at least in the right 1st level branch. It turned out that of the 137 functions that were falsely predicted at the 2nd level, 13 were at least put into the correct 1st-level branch, such that the 2nd level classifier's performance at the 1st level is 70.4%. Hence, we can conclude that the direct prediction of all nodes in the taxonomy is superior to an iterative prediction on multiple levels. As promising as the results so far are, they are clearly not optimal. To find an explanation for this, it is instructive to have a closer look at our process of validation. As explained, we employ a so-called batch validation, meaning we iteratively remove the functions from one library from the data set, learn a model on the remaining functions, and test this model on the selected library. This directly models our use case of integrating metadata of a new R library based on libraries with existing metadata. However, if we employ standard cross-validation, where the examples to test the model on are selected randomly, we notice that the accuracy rises from 70.3% to 79.4%. This is an indication that it can be hard to transfer models from one library to another, such that information from the same library can very much improve the classification process.
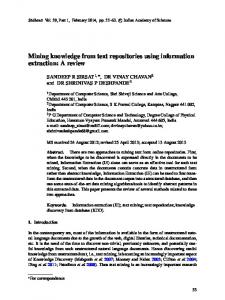
Figure 3: Learning curve for Rpart library with active learning
Another interesting experiment is to compare the performance of the classification process on different kinds of libraries. The 9 libraries that were selected for our experiments consist of 5 libraries of the Bioconductor project, i.e. contain specific bioinformatics functions, and 4 general R libraries. Comparing the batch-validated accuracies shows that on the Bioconductor libraries alone the accuracy falls to 65.1%, while on the general R libraries alone it rises to 77.8%, compared to 70.3% on all libraries. This shows that in particular the Bioconductor libraries are hard to model. This motivates the approach to add functions that have been already checked by the user to the training set and update the classification function during the metadata extraction process. This process can further be optimized, if we present the user the functions to be checked not in a random order, but select those functions first, for which the model is particularly unsure. This approach, which tries to make optimal use of the user's feedback in the sense that a high increase in accuracy can already be seen with little user feedback, is known as active learning [13]. In Figure 3 the learning curve (plot of accuracy over number of examples checked by the user) for the Rpart library can be seen. Rpart contains a total of 25 functions. As can be seen, after selecting only 2 functions, the error is already reduced by half. After selecting 9 of the 25 functions, perfect accuracy can be achieved. A similar result has been obtained with the Affy library, where accuracy was raised from 53.7% to 65.0% after adding 5 functions, and error is reduced by half after 13 of the 54 functions. Note that with the active learning approach in our case perfect accuracy will always be achieved, as we are working only on a finite number of functions in each library, all of which the administrator will eventually have checked, unless he decides to trust the system completely.
5.
Conclusions and Future Work
We have presented an approach where with the combination of a generic execution service for a scripting language and textmining applied to semi-structured help texts it is possible to semi-automatically integrate functions of this language into a grid system. Results show that while a completely automatic extraction of metadata is too complex, an interactive approach that exploits feedback of the administrator can greatly improve the correctness of the extracted metadata. Therefore, this approach significantly reduces the administrative overhead in integrating new functions as services and makes it possible to easily provide a vast number of functionality in the grid system. Limitations of the proposed approach exist for functions with parameter-dependent output, which is easily defined in the R language, but hard to model in webservice definitions. It should be possible to transfer the proposed to other scripting and programming languages, provided adequate documentation is available. The practical investigation and the generality of it will be a target of future work. It would also be very interesting to investigate the possibilities of integrating other information such as actual execution traces of the functions or their usage patterns in workflows to optimize and possibly refine the classification.
References [1] R Development Core Team, R: A language and environment for statistical computing, R Foundation for Statistical Computing, Vienna, Austria, 2008, http://r-project.org. [2] D. Wegener, T. Sengstag, S. Sfakianakis, S. Rüping, A. Assi, GridR: An R-based grid-enabled tool for data analysis in ACGT clinico-genomic trials, Proceedings of the 3rd International Conference on eScience and Grid Computing (eScience 2007), Bangalore, India, 2007. [3] P. Buitelaar, P. Cimiano (Eds.), Ontology Learning and Population: Bridging the Gap between Text and Knowledge, Frontiers in Artificial Intelligence and Applications Series, Vol. 167, IOS Press, 2008. [4] H. Han, C. L. Giles, E. Manavoglu, H. Zha, Z. Zhang, E. A. Fox, Automatic Document Metadata Extraction using Support Vector Machines, Proceedings of the 3rd ACM/IEEE-CS Joint Conference on Digital Libraries (2003), 37-48. [5] L. Diaz, C. Martin, M. Gould, C. Granell, M. A. Manso, Semi-automatic Metadata Extraction from Imagery and Cartographic Data, Proc. Geoscience and Remote Sensing Symposium (2007), 3051-3052. [6] I. Foster, C. Kesselman, S. Tuecke, The Anatomy of the Grid: Enabling Scalable Virtual Organizations, International Journal of High Performance Computing Applications 15:3 (2001), 200-222. [7] R. Gentleman, V. Carey, W. Huber, R. Irizarry, S. Dudoit, Bioinformatics and Computational Biology Solutions Using R and Bioconductor, Springer, 2005. [8] S. Ramirez, J. Karlsson, M. García, J. Rios Perez, O. Trelles: Repositories for bioinformatics webservices, Proceedings of VIII Jornadas de Bioinformática, pp. 50--56, Valencia, Spain, 2008. [9] The W3 consortium, Web Services Description Languagge, http://www.w3.org/TR/WSDL [10] Dublin Core Metadata Element Set, Version 1.1, http://dublincore.org/documents/2008/01/14/dces/ [11] M. D. Wilkinson, M. Links, BioMOBY: an open-source biological web services proposal, Briefings in Bioinformatics 3:4 (2002), 331-341 [12] R. Feldman, J. Sanger, The Text Mining Handbook, Cambridge University Press, 2007. [13] D. A. Cohen, Z. Ghahramani, M. I. Jordan, Active Learning with Statistical Models, Journal of Artificial Intelligence Research 4 (1996), 129-145. [14] T. Joachims, Text categorization with support vector machines: Learning with many relevant features, Proc. ECML’98 (1998), 137-142. [15] K. Belhajjame, S. M. Embury, N. W. Paton, R. Stevens, C. A. Goble, Automatic Annotation of Web Services based on Workflow Definitions, Proc. 5th International Semantic Web Conference, Athen, GA, USA, 2006. [16] K. Belhajjame, S. M. Embury, N. W. Paton, On Characterising and Identifying Mismatches in Scientific Workflows, Proc. DILS (2006), U. Leser, F. Naumann (eds.), LNBI 4074, 240-247.