Vinci that can be found in the Louvre in Paris is an iconic model of Mona Lisa. Now consider a poster reproduction of this painting that can be bought in the.
Metamodeling: Some Application Areas in Information Systems Dimitris Karagiannis, Hans-Georg Fill, Peter H¨offerer, and Martin Nemetz University of Vienna, Department of Knowledge Engineering, Br¨ unner Straße 72, A-1210 Vienna, Austria, {dk|hg|ph|mn}@dke.univie.ac.at, http://www.dke.univie.ac.at
Abstract. Metamodeling is a powerful concept in the area of information systems that can be applied to solve a variety of tasks. The goal of the paper at hand is to provide an insight into these application areas. In order to do so first the basic thoughts behind metamodeling are introduced. Then it will be shown that there are applications in the context of the creation and composition of metamodels that have to be supported by “cross-sectional” aspects like visualization and simulation. Finally, we will describe some of these applications in more detail. Key words: metamodeling, intellectual capital management, semantic interoperability, visualization
1 Introduction This paper is going to provide insight into some application areas of metamodeling. The best way to realize such an intention is to start with a discussion of the meaning of the main term. When considering the term “metamodeling” we see that it consists of two parts: “meta” and “modeling”. Let’s begin with a deeper look into the second one. “Modeling” basically denotes the process of creating models. Models in computer science, in turn, are seen as “a representation of either reality or vision”. ([30], p. 187). Therefore, they describe certain subjects under consideration either as they are or as they should be. Of course, this representation is not able to include all aspects of the original but can only focus on some of them (property of reduction) and a model is always intended for a specific purpose (property of pragmatics). [26] Models can be classified according to the language that is used for their creation. Non-linguistic or iconic models use signs and symbols that have an apparent similarity to the concepts of the real world that are being modeled. Linguistic models on the other hand use basic primitives (i.e. signs, characters, numbers, ...) that do not have any apparent relationship with the part of reality being modeled except the one that is defined in an explicit way [29]. Nearly all
2
Dimitris Karagiannis et al.
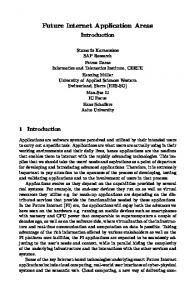
models used in computer science are of the latter linguistic type1 on which we restrain ourselves hereafter. Now, we can turn to the second part of “metamodeling” which is the “meta”prefix that comes from Greek and according to Webster’s Dictionary literally means either “between”, “with”, “after”, or “akin to”. One of the actual usages of this prefix defines a kind of “beyond”-relationship. This also fits the term “metamodel” as a metamodel can be seen beyond other models in that it is a “a model of models” [20]. It is important to understand this statement in a correct way where the following example might help. Consider the famous Mona Lisa who shall be our subject under consideration now. The painting by Leonardo Da Vinci that can be found in the Louvre in Paris is an iconic model of Mona Lisa. Now consider a poster reproduction of this painting that can be bought in the museum shop. This poster again is a model, or to be more precise a model of a model (the painting). But it is not a model of models (please notice the plural). For something to be a metamodel it has to describe a set of other models which has to be understood as providing the means for the creation of other models. Put in other words this implies that “A metamodel is a model of a modelling language.” [4] A graphical representation similar to figure 1 is typically used to explain this in more detail while introducing the so-called metamodeling hierarchy. On the top layer there is the subject under consideration that shall be modeled. This is done with the help of a modeling language. For instance, when creating a database for let’s say the management of student data we can use the EntityRelationship modeling technique (ERM, [2]) in order to abstract reality. The available modeling primitives of the modeling language (in the case of ERM: entities, weak entities, relationships with different cardinalities) are described in the metamodel. The metamodel is also generated using another language, the meta modeling language which primitives in turn can be defined by another meta layer which is called meta-meta-layer or meta2 -layer containing a meta2 -model using a meta2 modeling language. Theoretically, this process can be carried on to the n-th level but for practical reasons it is stopped most often at the meta2 layer. Research work concerning metamodeling can focus on different aspects. First “conceptual” formalizations of metamodels concerning their syntax and semantics – i.e. their actual representation using logical rules, graphical representations, or the like – can be explored. Next the role of metamodels in terms of theoretical applications can be elaborated whereas we distinguish the two basic options of “create” and “compose”. The two aspects of formalization and possible application areas allow for solving concrete tasks in certain domains which we refer to as “metamodel domain solutions” that finally can be instantiated in order to deal with real world problems. In the following we are not going into any more detail concerning the “conceptual” formalizations of metamodeling. We are rather focusing on the application 1
Linguistic models can be further distinguished in being realized with textual or graphical/diagrammatic languages [12].
Metamodeling: Some Application Areas in Information Systems abstraction level
3
formal definition of syntax
real world direct model of
model
in
indirect model of
metamodels
direct model of in
indirect model of
meta²-model
modeling language
meta modeling language direct model of
in
meta² modeling language
Fig. 1. Metamodeling hierarchy (adapted from [29]).
areas that we are discussing in section 2. Subsequently, some of these areas are described in more detail in section 3.
2 Application Areas of Metamodeling In Summer 2006 we did a literature survey concerning existing work in the area of metamodeling. In order to do so we examined 77 papers from 18 well known journals in different communities of computer science that is to say software engineering, databases, knowledge engineering, and information systems. For a complete list of the reviewed journals and more information on the search process please refer to [14]. When we started our literature survey we wondered whether we could find different typical metamodel applications for different areas of computer science. That would be to assume that, for instance, the knowledge engineering community is using metamodels in one special way whereas let’s say the software engineering community is making a completely different use. In fact, we realized that metamodels are utilized to solve two fundamental types of tasks that we would like to denote as “create” and “compose”. “Create” involves the generation of new metamodels (i.e. modeling languages) from scratch. This is a highly domain-specific task as the created metamodel has to provide language constructs for all specific aspects that have to be grasped by the models that are then generated using this metamodel. The advantage of using metamodels is quite apparent: a commonly accepted understanding of relevant “real-life”-concepts is guaranteed and new model instances can be created in a structured way whereas it is ensured that all relevant aspects are taken into account and nothing of importance is forgotten. Rosemann
4
Dimitris Karagiannis et al.
and Green [23] emphasize this when speaking of metamodels as clarifying the understanding, simplifying the communication, being a means for structuring and analyzing, and finally being the enabler for the derivation of new modeling techniques. “Compose” on the other hand denotes the combination of already existing metamodels in order to create one single new metamodel for a specific purpose. This purpose may, for instance, be to achieve interoperability of the resources that are modeled using the source metamodels that are composed [13] or to create “combined” models that are able to depict all aspects in one single model that had to be grasped in various separate models before (see section 3.2). Composition is done in a mapping process that relates various elements of different source metamodels with one another2 . Now if we think of actual application areas for metamodeling we can distinguish between “create”- and “compose”-applications. New metamodels can be created in a variety of domains including intellectual capital management, performance management, regulatory compliance, knowledge management, business process management, and so on. The composition of metamodels is a means to achieve semantic interoperability, for instance. Finally, there are also some “cross-sectional” functions that go together with the concept of metamodeling like visualization and simulation. These findings are summarized in figure 2. In the next section we are going to describe some of these application areas in more detail. Create Metamodels Intellectual Capital Management
Performance Management
Compose Metamodels Regulatory Compliance
…
Semantic Interoperability
Visualization
Simulation
Fig. 2. Some application areas of metamodeling.
3 Metamodeling: Some Applications In the following we want to provide some insight into actual applications of metamodeling. First we are introducing an approach that shows the creation of 2
This process is described in some more detail in section 3.2 on page 8.
Metamodeling: Some Application Areas in Information Systems
5
a new metamodel in the domain of intellectual capital management. Then the composition of metamodels for achieving semantic interoperability is described. Finally, we discuss the cross-sectional role of visualization in the context of metamodeling. 3.1 A Metamodel for Intellectual Capital Management The reporting of intellectual capital is gaining steadily more on importance as the overall discrepancy between an enterprise’s market value compared to its book value is getting bigger [27]. When looking at the S&P 500 Companies and their ratio of market-to-book value, it can be determined that the ratio has reached in March 2001 more than five times the value of December 1977 [16]. This huge portion of value of an enterprise that cannot be seen on the traditional financial balance sheet implies a lot of risks [15]. Due to the variety of intellectual capital reports that are available, a comparison of values stated in these reports can most likely not be executed. The here presented Intellectual Capital Report Benchmarking (ICRB) Framework consists of a set of four areas. As indicated in figure 3 on the next page, these four areas interact with one another in the following way: By focusing on step (1) of the framework, the organizational structure of an organization under study (OSUS), i.e. the main processes as well as its organizational charts will be elicited as a basis for the application of the ICRB framework as both the processes and organizational charts will serve as the starting point for the identification, utilization, management, and reporting of an organization’s intellectual capital. However, as soon as an organization aims to manage and/or reports its intellectual capital, it can choose from a variety of available intellectual capital methods. These methods may differ completely and thus, divergent results may be produced when relying on diverse intellectual capital methods ([18], but cf. e.g. also [1], pp. 283-374, who indicates exemplarily the differences of 25 methods for intellectual capital management and reporting). Thus, the selection of a method for intellectual capital management and reporting, as it is indicated in step (2) in figure 3 on the following page, influences the outcomes in the long run due to diverging data, but even more important the application of available intellectual capital templates in the short run. These templates (marked with step (3) in figure 3 on the next page) are seen as constructs that organize both data material describing an organization’s intellectual capital and linkages of these data with the organizations processes and organizational charts. Eventually, these templates have been realized by establishing metamodels for intellectual capital reporting, as it is indicated in figure 4 on page 7. By this step many of the existing intellectual capital methods can be applied on an organization by keeping the required intellectual capital data in certain areas of the instantiated metamodels. Thus when applying the ICRB framework, in step (4) outcomes in form of reports can be created (periodically) by relying on diverse intellectual capital methods, which allows in turn a comparison of values as it anticipated above.
6
Dimitris Karagiannis et al.
Finally, the ICRB framework is accompanied by a step model (indicated in figure 3 by the dashed cyclic arrows), which shall act as a guideline for the introduction of the ICRB frameworks in organizations. The ICRB Step Model starts with the elaboration of the strategy and tactical targets, wherein the firm’s global strategy is defined as an intellectual capital report and depends also on the company’s strategic and tactical objectives. Further, step 2, the definition of the business processes and working environments has to be executed as the firm’s business processes have to be modeled for being able to step forward to the extraction of intellectual capital-relevant business processes and working environments. Here, those business processes that contain intellectual capitalintensive activities have to be identified, before in step 4, the intellectual capital processes are defined and subsequently in step 5, the selection of applicable intellectual capital reporting concepts can be chosen. Finally, step 6 contains the evaluation of reported values, where based on automatically created intellectual capital reports, it can be checked whether the company’s performance is satisfactory according to its prior-set strategy [18].
2
IC Methods
R&B Outcomes
4
value creation AK WB IC-Rating ARCS
MERITUM Danish Guidelines
Skandia Navigator IA Monitor IC Navigator
monetary
non-monetary
Calculated Intangible Value Comprehensive Company Value Tobin‘s q Market-to-book relation value extraction
1
OSUS
IC Templates
OSUS … Organisational Structure under Study IC … Intellectual Capital R …Report B … Benchmark
3
Fig. 3. Intellectual Capital Report Benchmarking Framework.
In the following, the afore-referred to metamodels for intellectual capital reporting shall be outlined briefly: As the firm’s business processes play a major role when considering an organization’s intellectual capital, they have to be included in the considerations concerning the creation of a metamodel for intellectual capital reporting. In the following, figure 4 on the facing page [17] gives an overall picture of the whole modeling method containing seven metamodels for intellectual capital reporting, one metamodel for business processes and one metamodel for working environ-
*
*
Enterpriserelated Data
Relational Factors
*
*
Decision
Running Object
*
Learning Index
Indices
*
*
Competence Pattern
Division
Multiplication
Substraction
*
Educational Index
Customerrelated Data
*
is calculated with
Composed Costs
*
Cost Meta-Model
Merging
End
*
*
*
Research and Development
Organizational Unit
Is subordinated *
*
*
Costs
*
Cost Hierarchy
*
*
*
*
*
*
*
*
*
Action
uses resource
belongs to
Activity
* role has
Performer
*
*
Role
*
*
Contant
Subprocess
*
*
*
Resource
has resource
Organizational Unit
Is subordinated *
*
*
*
Employee Structure
*
Administration
Human Factor Risk
*
Competencies
Employees
*
*
Human Factor Risk
Production/ Innovation
Is subordinated *
Structural Factor Risk
Risk
*
*
*
Risk Meta-Model
*
Human Factors
defines
* *
Organizational Unit
*
Human Factors Meta-Model
*
Structural Factors
IT Infrastructure
defines
*
Structural Factors Meta-Model
Working Environment Meta-Model
Business Process Meta-Model
Skills Index
Parallelity
*
Competence Pattern Meta-Model
Mathematical Operators
*
defines
Market-related Data
*
*
Relational Factors Meta-Model
Addition
Process Start
subsequent
Knowledge Index
*
Customer Factor Risk
Organizational Unit
Is subordinated
*
*
*
used in
*
Relational Factor Risk
Area of Application
* is
Patent
*
Patent Map Meta-Model
Structural Factor Risk
*
Metamodeling: Some Application Areas in Information Systems 7
ments. The seven intellectual capital reporting metamodels are again classified
Fig. 4. Metamodels for Intellectual Capital Reporting. [17]
into two categories: Primary model types and secondary model types, whereas the first consists of the human factor metamodel (HFM), the structural factor metamodel (SFM), and the relational factor metamodel (RFM). The secondary
8
Dimitris Karagiannis et al.
model types are composed of the risk metamodel (RM), the cost metamodel (CM), the competence pattern metamodel (CPM), and the patent map metamodel (PM). The primary model types contain information that is directly related to and can be found in intellectual capital reports, whereas the secondary model types are composed of data that is relevant for the linking and/or calculation of values relevant for intellectual capital reports. Hence, they represent the supporting means for the values to be included in the primary model types. [17] The final outcome of the modeling of an organization’s intellectual capital are reports that indicate the development of an organization’s intangibles. Hereby, the meta-data for the reports is visualized with the aid of XML and XSLT, which allows for the automatic transformation of these meta-data into various formats, as e.g. HTML, RTF but also the visualization of data in a spreadsheet program like MS Excel. These by one click automatically created and selectable reports should serve as key performance indicators, which do both measuring intellectual capital factors and also support the management in the course of either the establishment or the maintenance of environments that allow employees to think freely, to take over responsibility, and to share knowledge, which in turn helps the firm to create higher profits. [19] 3.2 Combining Metamodels and Ontologies to Achieve Semantic Interoperability The topic of integrating data and ensuring the interoperability of information systems and business processes is of great practical importance which can already be seen by the fact that according to Gartner up to 40% of the companies’ information technology budgets are spent on integration issues [10]. The heterogeneities that have to be dealt with in this context are usually classified to be of syntactical, structural or semantic nature [22] whereas resolving the latter seems to be most laborious as 60–80% of the resources of integration projects are spent on reconciling semantic heterogeneities [3]. In this section we want to demonstrate that the composition of metamodels is a powerful means in order to achieve semantic interoperability of modeled resources. A composition of metamodels can be realized in a process of comparing two metamodels with one another in order to identify semantic equivalences between metamodel elements. These equivalence relationships can then be used either as loosely defined mappings as well as a basis for the creation of one single new integrated metamodel. Related work concerning these issues can, for instance, be found in [31] where an abstract syntax of a mapping definition language is introduced as well as a language for integration rules that allows for the combination of two source metamodels in one integrated metamodel. The shortcoming of this and other similar approaches is that the semantics of the metamodel elements is not taken into account in an explicit way. The mapping process is mostly done by domain and metamodeling experts that have to put forth a lot of knowledge concerning the meaning of metamodel elements in order to be able to identify equivalent parts.
Metamodeling: Some Application Areas in Information Systems
9
In [13] a generic architecture is introduced that allows for the (semi-)automatic identification of semantic equivalences which is achieved through the establishment of semantic mappings between metamodel elements and ontology concepts that provide explicit and machine-processable representations of meanings. Figure 5 on the next page depicts this architecture showing that the abstract metamodels 1 and 2 are to be mapped with one another whereas for demonstration purposes the relationship between A and B shall be examined in more detail. Basically, there are two aspects concerning semantics that have to be taken into account when comparing (meta-)model elements: first is type semantics and second inherent semantics. The difference between these two aspects can be explained best using an example like, for instance, from the area of business process modeling. Consider an “activity” of a business process model that has been generated using the Business Process Modeling Notation [21]. The fact that something is an “activity” means that something is done by some performer using some resource. We denote this as type semantics. In the process model this activity is now given a name like “deny proposal” which is some more meaning as we exactly know what is done (“deny”) on which resource (“proposal”). This additional meaning is called inherent semantics. When comparing two (meta-)model elements for semantic equivalence both semantic aspects have to be considered. Type semantics is provided by the metamodeling hierarchy whereas inherent semantics is provided when mapping (meta)model elements with ontology concepts.3 In our example in figure 5 we see that A and B are carrying the same type semantics as they are both derived from Ω. Additionally, they have the same inherent semantics which can be inferred through the fact that ontology concept I (which is connected to A) and ontology concept II (connected to B ) are semantically equivalent through an intermediate concept III, which is taken as valid assumption in this example. Now, one benefit that arises from revealing semantic equivalence between different elements of metamodels (and therefore language descriptions) is that model instances that have been created using these modeling languages can be made interoperable or can be integrated as well. This is also indicated in figure 5 on the following page where two models 1 and 2 can be combined in one single new model due to the knowledge that A and B are equivalent. This induces that a and b are equivalent concerning their type semantics. The inherent semantics of a and b can be explicated the same way as described above for the metamodel elements and if this semantics type turns out to be equivalent as well (which is taken as granted in this example) then a and b can be unified in one single element in a new model as indicated in figure 5. Finally, the link from metamodel mapping and integration to semantic interoperability has to be elaborated as it may not be obvious. This link exists as metamodels provide the means to create models which in turn represent reality. Now, when semantic equivalences between (meta-)model elements are revealed the underlying models or represented aspects of reality, respectively, are found to be equivalent as well. In the context of business process models this can now 3
These interrelationships are described in some more detail in [13].
10
Dimitris Karagiannis et al. definition of syntax and (implicit) type semantics
semantics definition: commonly accepted ontologies
meta²-model Ω
meta²-model-layer ontology 1 I metamodel 1
metamodel 2
meta-modellayer
Semanti
A(Ω)
c Equiva
lence
B(Ω)
III
II
model 2
model 1
ontology 2 modellayer
a(A)
b(B)
combined model (enabled through semantic equivalence on meta-model layer) a/b
legend: … „conforms to“-relationship: syntax, type semantics … semantic mapping: explication of implicit type semantics and inherent semantics x(y) … model element x conforms to model element y of the superior metamodel
Fig. 5. Architecture for the composition of metamodels using ontologies (adapted from [13]).
for instance be used in order to establish interoperability of real processes that are carried out in different departments or organizations (cf. [13]). 3.3 Metamodels and Visualization In business informatics the visual representation of models, data and their relationships plays an important role. Examples can be found in several areas that are either core parts of business informatics or contribute important aspects to the field such as enterprise modeling, descriptive statistics, graph theory or knowledge management ([7]). In the following the specific relation between metamodeling and visualization shall be highlighted. Whereas metamodeling can be seen as a method to identify the concepts and relationships of a certain domain for the purpose of model creation by human users, the role of visualization is often seen from a different point of view. In most international publications in the area of computer science visualization is mainly regarded from a technical, data-oriented perspective (cf. e.g. [25]; [24]):
Metamodeling: Some Application Areas in Information Systems
11
There, it is used as a technique to discover new facts in large data sets through mapping data to graphical representations. By applying methods such as color coding or specialized types such as parallel coordinates ([9]) previously unknown relationships that are contained in the data may be found. Examples include the discovery of relationships in business data ([11]) or applications in the natural sciences such as the mining of the human genome ([28]). However, visualization is not only a technical science but has a long tradition in other fields as well. These include the different domains of art and design and the foundations of visualization in the area of geometry and mathematics as well as in the field of visual language theory and semiotics [7]. It thus seems obvious to take into account not only the technical aspects of visualizations focusing on methods for representing data but also its conceptual foundations. In this sense visualization fulfills a function that is similar to that of metamodeling: Based on a number of graphical primitives compositions of these primitives can be created that may then be used for representing human knowledge as well as information. In addition, these compositions can not only be created by human users but may also be assembled based on computer algorithms, e.g. for creating visualizations for analyzing data. This additional aspect closes the loop of the concept of visualization to the technical, data-oriented view as described above. One way to formalize the conceptual aspects of visualization has been described by the approach of Semantic Visualization ([5], [6]). The central idea of this approach is to define visual objects that contain not only graphical representations but provide mechanisms to influence the representations by inherent control structures and variables. To integrate visualizations that have been specified elsewhere it is also possible to recursively insert visual objects into each other. Thereby the syntactic basis for a conceptual view on visualizations is established. To relate these visual objects to other conceptualizations such as metamodels the approach of Semantic Visualization defines linkages between the visual objects and semantic schemata. The visual objects together with these semantic annotations are termed Ontological Visualization Patterns. In detail it is then possible to annotate an arbitrary visual object (e.g. one that represents a gauge) together with its variables (e.g. for modifying the position of the needle in the gauge) by the corresponding semantic concepts (e.g. thermometer and temperature). Thereby a semantic description of the visualizations is determined. To link the Ontological Visualization Patterns to metamodels it is equally necessary to semantically annotate the metamodels. By traversing from metamodels to the corresponding semantic schema over to the semantically annotated visual objects a direct mapping of visual representations and metamodel classes and relations can be established (see figure 6). The mapping of Ontological Visualization Patterns to metamodel elements can be done in a variety of ways ([7]): The functional implementation can either be accomplished automatically through the application of logical reasoning via the ontology, semi automatically with additional input from a user or manually. For the definition of metamodels and ontologies it can be reverted to standards or proprietary technologies. The definition of Ontological Visualization Patterns
12
Dimitris Karagiannis et al. Ontology
Semantic Mapping Semantic Mapping
Meta-Model
Visualization Business Graph
1..*
1..*
1..1
1..1
1..*
Control Connector
IsToActivityElement 1..*
1..1
Working Environment
Relations
1..*
IsFromActivityElement
Flow Element
1..1
1..1
1..1
Business Process 1..*
1..1
1..*
1..1
Person responsible for
Required Resource
WE Element
1..*
1..*
1..1
1..*
1..1
0..*
0..* refers to 1..*
1..*
Visual Object
1..1
Transformation Function
1..*
consists of
Activity
1..*
1..* contains
1..1
1..*
Person
Group
Resource
Start
End
Graphical Primitive
0..*
0..* linked to
1..*
0..*
Internal Variable
1..*
responsibleFor requiredFor
refers to 1..1
SubProcess responsibilityBy
1..*
External Variable
WE Relation
1..1
Control Element
1..1
1..* consists of
1..1
IsFromWEElement IsToWEElement 1..*
1..1
Ontological Visualization Pattern 1..*
provisionedBy
Decision
Fig. 6. Application of semantic visualizations to metamodels [8].
may also be realized with proprietary techniques or by the extension of existing standards such as Scalable Vector Graphics ([7]). The mapping can either be static or dynamic - in the sense that the patterns are tightly coupled to the metamodel elements or may be dynamically allocated. Similarly, the assignment may be performed on demand or based on pre-configured mappings. A summary of these mapping dimensions is given in figure 7.
Functional Implementation
Automatic
Semi automatic
Manual
Standardization
Fully Standards based
Partly Standards based
Proprietary
Deployment Time Reference
Static
Dynamic
On demand
Pre-configured
Fig. 7. Dimensions of the mapping between metamodels and visualizations [8].
4 Conclusion This paper provided an introduction into possible application areas of metamodeling in the context information systems. After a short description of the term metamodel we provided a classification of these applications according to the basic metamodel operations “create” and “compose” that have to be supported
Metamodeling: Some Application Areas in Information Systems
13
by “cross-sectional” aspects like visualization and simulation. We described the creation of a domain-specific metamodel for intellectual capital management and the composition of metamodels using ontologies in order to achieve semantic interoperability. Finally, we took a glimpse on how metamodel elements can be mapped to visualization patterns.
References 1. Andriessen, D. Making Sense of Intellectual Capital. Elsevier ButterworthHeinemann, Oxford, 2004. 2. Chen, P. P. S. The entity-relationship model - toward a unified view of data. ACM Transactions on Database Systems 1, 1 (1976), 9–36. 3. Doan, A., Noy, N. F., and Halevy, A. Y. Introduction to the Special Issue on Semantic Integration. SIGMOD Record 33, 4 (2004), 11–13. 4. Favre, J. M. Foundations of Meta-Pyramids: Languages vs. Metamodels - Episode II: Story of Thotus the Baboon. In Language Engineering for Model-Driven Software Development (Dagstuhl, Germany, 2005), J. B´ezivin and R. Heckel, Eds., vol. Language Engineering for Model-Driven Software Development, Internationales Begegnungs- und Forschungszentrum fuer Informatik (IBFI). 5. Fill, H. G. Basic Conceptions for Semantic Visualization. In e-Staat und e-Wirtschaft aus rechtlicher Sicht - Aktuelle Fragen der Rechtsinformatik Tagungsband des 9. Internationalen Rechtsinformatik Symposions IRIS 2006, E. Schweighofer and et al., Eds. Boorberg Verlag, 2006, pp. 482–485. 6. Fill, H.-G. Semantic Visualisation of Heterogeneous Knowledge Sources. In Modellierung f¨ ur Wissensmanagement - Workshop im Rahmen der Modellierung 2006 (2006), K. Hinkelmann and U. Reimer, Eds., Sonderdrucke der Fachhochschule Nordwestschweiz, pp. 17–27. 7. Fill, H.-G. Visualisation for Semantic Information Systems. PhD thesis, Universit¨ at Wien, 2006. 8. Fill, H. G., and Karagiannis, D. Semantic Visualization for Business Process Models. In Proceedings of the Twelth International Conference on Distributed Multimedia Systems - International Workshop on Visual Languages and Computing 2006. Knowledge Systems Institute, Grand Canyon, USA, 2006, pp. 168–173. 9. Fua, A.-H., Ward, M. O., and Rundensteiner, E. A. Hierarchical Parallel Coordinates for Exploration of Large Datasets. In 10th IEEE Visualization 1999 (VIS’99) (1999), IEEE. 10. Haller, A., Cimpian, E., Mocan, A., Oren, E., and Bussler, C. WSMX A Semantic Service-Oriented Architecture. In IEEE International Conference on Web Services (ICWS 2005) (2005), IEEE Computer Society, Ed., pp. 321–328. 11. Hao, M., Dayal, U., and Hsu, M. Visual Data Mining for Business Intelligence Applications. In WAIM2000 (Berlin Heidelberg, 2000), H. Lu and A. Zhou, Eds., Springer. 12. Harel, D., and Rumpe, B. Modeling Languages: Syntax, Semantics and All That Stuff - Part I: The Basic Stuff. 2006-05-26 2000. ¨ fferer, P. Achieving Business Process Model Interoperability Using Meta13. Ho models and Ontologies. In Proceedings of the 15th European Conference on Infor¨ mation Systems (ECIS 2007) (2007), H. Osterle, J. Schelp, and R. Winter, Eds., pp. 1620–1631.
14
Dimitris Karagiannis et al.
¨ fferer, P. Metamodels in Action: An Overview. In 14. Karagiannis, D., and Ho ICSOFT 2006 - First International Conference on Software and Data Technologies (Set´ ubal, 2006), J. Filipe, B. Shishkov, and M. Helfert, Eds., vol. 1, Insticc Press, pp. IS–27 – IS–36. 15. Karagiannis, D., Nemetz, M., and Schwab, M. Dashboards for Monitoring Compliance to Regulations - A SOX-based Scenario. In Electronic Proceedings of IGO’06 - International Conference on Integrating Global Organizations (2006). 16. Lev, B. Intangibles: Management, Measurement, and Reporting. Brookings Inst. Press, Washington, DC, 2001. 17. Nemetz, M. A Meta-Model for Intellectual Capital Reporting. In Proceedings of 6th International Conference on Knowledge Management (PAKM 2006) (Berlin, 2006), U. Reimer and D. Karagiannis, Eds., Springer, pp. 213–223. 18. Nemetz, M. Towards a Model for Creating Comparable Intellectual Capital Reports. In Proceedings of I-Know’06 - International Conference on Knowledge Management (Graz, 2006), H. Maurer and K. Tochtermann, Eds., JUCS. 19. Nemetz, M., and Karagiannis, D. Unification of Intellectual Capital Reports with IT-Support. In Electronic Proceedings of the World Congress on Intellectual Capital, Hamilton, Ontario, Canada (2007). 20. Object Management Group. MDA Guide Version 1.0.1. 2007-01-22 2003. 21. Object Management Group. Business Process Modeling Notation Specification. 2006-10-18 2006. 22. Obrst, L. Ontologies for Semantically Interoperable Systems. In CIKM ’03: Proceedings of the Twelfth International Conference on Information and Knowledge Management (New York, NY, USA, 2003), ACM Press, pp. 366–369. 23. Rosemann, M., and Green, P. Developing a meta model for the Bunge-WandWeber ontological constructs. Information Systems 27, 2 (2002), 75–91. 24. Rushmeier, H., Turk, G., and Van Wijk, J. J. Proceedings of the 2004 IEEE Visualisation Conference. IEEE Computer Society, Austin, TX, USA, 2004. ¨ ller, E., and Rushmeier, H. Proceedings of the 2005 IEEE 25. Silva, C. T., Gro Visualisation Conference. IEEE Computer Society, Minneapolis, MN, USA, 2005. 26. Stachowiak, H. Allgemeine Modelltheorie. Springer, Wien, 1973. 27. Stewart, T. A. The wealth of knowledge: Intellectual Capital and the TwentyFirst Century Organization. Currency Book, New York, London, 2001. 28. Stolk, B., Abdoelrahman, F., Koning, A., and Wielinga, A. Mining the Human Genome using Virtual Reality. In Fourth Eurographics Workshop on Parallel Graphics and Visualization (2002), D. Bartz, X. Pueyo, and E. Reinhard, Eds., The Eurographics Association. 29. Strahringer, S. Metamodellierung als Instrument des Methodenvergleichs: eine Evaluierung am Beispiel objektorientierter Analysemethoden. Berichte aus der Betriebswirtschaft. Shaker, Aachen, 1996. 30. Whitten, J. L., Bentley, L. D., and Dittman, K. C. Systems analysis and design methods, 6th ed. McGraw-Hill Irwin, Boston, 2004. ¨hn, H., and Karagiannis, D. Facilitate Modelling Using 31. Zivkovic, S., Ku Method Integration: An Approach Using Mappings and Integration Rules. In Proceedings of the 15th European Conference on Information Systems (ECIS2007), ¨ June 7-9 2007, St. Gallen, Switzerland (St. Gallen, June 2007), H. Osterle, J. Schelp, and R. Winter, Eds., University of St. Gallen, pp. 2038–2049.