i LA PORTE. :i - 'vl/.lVVfr ..... Creek at Alexandria in Madison County, Ind. First, the site is located on ... flow-duration ratio for Pipe Creek at Alexandria results in.
Method for Estimating Low-Flow Characteristics of Ungaged Streams in Indiana
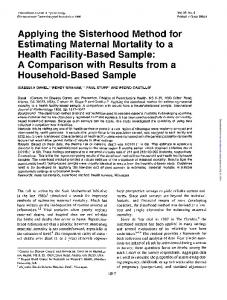
United States Geological Survey Water-Supply Paper 2372
Prepared in cooperation witf the Indiana State Board of Health
Method for Estimating Low-Flow Characteristics of Ungaged Streams in Indiana By LESLIE D. ARIHOOD and DALE R. GLATFELTER
Prepared in cooperation with the Indiana State Board of Health
U.S. GEOLOGICAL SURVEY WATER-SUPPLY PAPER 2372
U.S. DEPARTMENT OF THE INTERIOR MANUEL LUJAN, Jr., Secretary U.S. GEOLOGICAL SURVEY Dallas L. Peck, Director
Any use of trade, product, or firm names in this publication is for descriptive purposes only and does not imply endorsement by the U.S. Government
UNITED STATES GOVERNMENT PRINTING OFFICE : 1991
For sale by the Books and Open-File Reports Section U.S. Geological Survey Federal Center, Box 25425 Denver, CO 80225 Library of Congress Cataloging in Publication Data Arihood, Leslie D. Method for estimating low-flow characteristics of ungaged streams in Indiana / by Leslie D. Arihood and Dale R. Glatfelter; prepared in cooperation with the Indiana State Board of Health. p. cm. (U.S. Geological Survey water-supply paper ; 2372) Includes bibliographical references (p. ) Supt. of Docs, no.: I 19.13:2372 1. Stream measurements Indiana. I. Glatfelter, D.R. (Dale R.) State Board of Health. III. Title. IV. Series. GB1225.I3A75 1991
551.48'3'09772-dc20
II. Indiana
90-13876 CIP
CONTENTS Abstract 1 Introduction 1 Background 1 Purpose and Scope 1 Climate and Physiography 2 Northern Zone 2 Central Zone 2 Southern Zone 2 Description of Data Base 4 Development of Method for Estimating Low-Flow Characteristics 7 Regression Analysis 7 Mapping of Flow-Duration Ratio 8 Application of Method 9 Accuracy of Method 10 Accuracy of Equations Developed from Regression Analysis 10 Accuracy of Flow-Duration Ratios from Plate 1 12 Accuracy of Equations and Row-Duration Ratios 13 Sensitivity Analysis 14 Limitations of Method 15 Summary 16 References Cited 16 Appendix 17
PLATE
1. Flow-duration ratios for northern and central Indiana In pocket
FIGURES
1-3. Maps showing: 1. Physiography of Indiana 3 2. Locations of continuous-record gaging stations used in the analysis of low flow 5 3. Basins where 7-day, 10-year low flow is zero 6 4. Plots of the observed and predicted 7Q10 and the residuals when the equation is applied at the 82 gaging stations used to develop the equation 10 5. Box and whisker plots of estimation and prediction data used in data splitting 11 6, 7. Plots of the observed and predicted 7Q10 and the residuals when: 6. The 41-station equation is applied at 41 gaging stations not used to develop the equation 12 7. Flow-duration ratios obtained from plate 1 are used in the estimating equation 14 8. Plot comparing estimate of 7Q10 at partial-record stations with estimate of 7Q10 predicted by the method 15 Contents
III
TABLES
1. Summary of drainage areas and years of record for the 82 gaging stations used in the regression analysis 7 2. Summary of low-flow data used in the regression analysis 7 3. Stations and data from adjacent States used to test equation 13
IV
Contents
Method for Estimating Low-Flow Characteristics of Ungaged Streams in Indiana By Leslie D. Arihood and Dale R. Glatfelter Abstract Equations for estimating the 7-day, 2-year and 7-day, 10-year low flows at sites on ungaged streams are presented. Regression analysis was used to develop equations relating basin characteristics and low-flow characteristics at 82 gaging stations. Significant basin characteristics in the equations are contributing drainage area and flowduration ratio, which is the 20-percent flow duration divided by the 90-percent flow duration. Flow-duration ratio has been regionalized for Indiana on a plate. Ratios for use in the equations are obtained from the plate. Drainage areas are determined from maps or are obtained from reports. The predictive capability of the method was determined by tests of the equations and of the flow-duration ratios on the plate. The accuracy of the equations alone was tested by estimating the low-flow characteristics at 82 gaging stations where flow-duration ratio is already known. In this case, the standard errors of estimate for 7-day, 2-year and 7-day, 10-year low flows are 19 and 28 percent. When flow-duration ratios for the 82 gaging stations are obtained from the map, the standard errors are 46 and 61 percent. However, when stations having drainage areas of less than 10 square miles are excluded from the test, the standard errors decrease to 38 and 49 percent. Standard errors increase when stations with small basins are included, probably because some of the flowduration ratios obtained for these small basins are incorrect. Local geology and its effect on the ratio are not adequately reflected on the plate, which shows the regional variation in flow-duration ratio. In all the tests, no bias is apparent areally, with increasing drainage area or with increasing ratio. Guidelines and limitations should be considered when using the method. The method can be applied only at sites in the northern and central physiographic zones of the State. Low-flow characteristics cannot be estimated for regulated streams unless the amount of regulation is known so that the estimated low-flow characteristic can be adjusted. The method is most accurate for sites having drainage areas ranging from 10 to 1,000 square miles and Manuscript approved for publication June 19, 1986.
for predictions of 7-day, 10-year low flows ranging from 0.5 to 340 cubic feet per second.
INTRODUCTION Background Low-flow data are essential to proper management of water resources. A common use of low-flow data is for determining the permissible rate of disposing waste into a stream. For example, the Indiana State Board of Health uses the 7-day, 10-year low flow as a criterion for wasteload allocation. Low-flow data also aid in determining availability of water for municipal and industrial supplies, irrigation, recreation, and protection of the aquatic environment. The U.S. Geological Survey has determined several low-flow characteristics at stream sites in Indiana where streamflow has been measured (Stewart, 1983). Characteristics investigated in this report are 7Q2 (7-day, 2-year low flow) and 7Q10 (7-day, 10-year low flow). The 7Q2 and 7Q10 are the average discharges for 7 consecutive days below which streamflow recedes on the average once every 2 and 10 years. Stewart (1983) has presented 7Q2 and 7Q10 for 208 continuous-record gaging stations and 258 partialrecord stations in Indiana. However, many stream sites for which low-flow data are required do not have any streamflow measurements on which to base estimates of 7Q2 and 7Q10. Therefore, in 1983 the U.S. Geological Survey began a study in cooperation with the Indiana State Board of Health to develop a method for estimating 7Q2 and 7Q10 for sites on ungaged streams.
Purpose and Scope The purpose of this report is to present equations for use in estimating low-flow characteristics 7Q2 and 7Q10 for sites on ungaged streams in Indiana. Regression analysis was used to develop equations that describe the relation between basin and low-flow characteristics at 82 gaging stations. The same relation is used to estimate low-flow characteristics at ungaged sites. The equations for estimatintroduction
1
ing 7Q2 and 7Q10 can be applied to all sites on unregulated streams in northern and central Indiana having (1) drainage areas of less than 1,000 mi2 (square miles) and (2) 7Q10's greater than zero.
Climate and Physiography Climate and geology are the major factors controlling the low-flow characteristics at any point on a stream. Climate controls the input to and some of the loss from the hydrologic system; geology controls the transmissivity and storage. Together they determine the magnitude of the low-flow characteristics. The geographic variation of these factors, plus the size of the drainage area, accounts for most of the variation in low-flow characteristics among streams. Other factors such as percentage of drainage area covered by forest, slope of the channel, and percentage of drainage area covered by lakes have a lesser effect. The two climatic factors affecting low flow are precipitation and evapotranspiration. Average annual precipitation ranges from 34 in (inches) in the northeastern part of the State to 44 inches in the south-central part (Stewart, 1983, p. 7). Potential annual evapotranspiration generally increases from 34 inches in the northeast to 38 inches in the southwest (Farnsworth and others, 1982, map 3). Indiana can be divided into three general physiographic zones (Schneider, 1966, p. 42). Streamflow characteristics in each zone are discussed here along with the physiography. For convenience, the zones are called the northern, central, and southern zones (fig. 1). The central zone, a depositional plain of low relief, is underlain by thick till that has been modified by postglacial stream erosion. In general, relief in the northern and southern zones is greater than that in the central zone. However, these two zones also include some areas of plains having low relief. The following discussion of the three zones is based on Schneider (1966). Northern Zone
The northern zone, or northern moraine and lake region, consists of the Calumet lacustrine plain, the Valparaiso morainal area, the Kankakee outwash and lacustrine plain, the Steuben morainal lake area, and the Maumee lacustrine plain. The Calumet lacustrine plain consists of a stairstepping progression of ancient beaches representing successive stages of glacial Lake Chicago. These beaches range from 590 to 640 ft (feet) in altitude. The highest one is 60 ft above Lake Michigan. Industrialization of the area makes determination of natural low-flow characteristics difficult. The Valparaiso morainal area, whose topography ranges from hilly to an undulating till plain, is 150 ft higher than the neighboring Calumet lacustrine plain. Ice-block and peat-filled lakes are common in the entire morainal area 2
but are more common in the knob-and-kettle topography of the northeast-southwest-trending part of the area (fig. 1). Low-flow data are sparse except for the southern part, where sustained flow is high. The Kankakee outwash and lacustrine plain is a low and poorly drained area underlain mostly by sand from valley train and outwash deposits. These features give this area a high sustained flow. The topography of the Steuben morainal lake area is rugged, owing to an abundance of glacial features such as moraines and morainal lakes, kames, eskers, meltwater channels, and ice-block lakes. The diverse valleys may contain streams, clay beds, or swamps, or may have internal drainage. Sustained base flow in the area is as diverse as the geology. The Maumee lacustrine plain is a nearly level plain formed by glacial Lake Maumee. Low-flow characteristics of this small area are controlled by a combination of features of the central zone and the Steuben morainal lake area of the northern zone. Central Zone
The central zone consists of one major physiographic region, the nearly flat to rolling Tipton till plain. This plain is broken by only a few eskers and erosional valleys formed by meltwater. The zone also contains several poorly developed end moraines of low relief. Because the surficial geology is nearly uniform, variability in base flow probably is due to the distribution of aquifer material in the zone. Southern Zone
The southern zone, probably the most diverse of the three zones, consists of seven units: the Dearborn upland, the Muscatatuck regional slope, the Scottsburg lowland, the Norman upland, the Mitchell plain, the Crawford upland, and the Wabash lowland. Streams having drainage areas as large as 250 mi2 may not support year-round flow. However, smaller streams in outwash aquifers, at spring sites, and in karst areas commonly have continuous flow. The Dearborn upland, a dissected plateau formed by flat-lying limestone of Ordovician age, is overlain by 15 ft of drift in the south to 50 ft of drift in the north. This unit is dissected by deeply entrenched streams forming rugged V-shaped valleys. The altitude of the Muscatatuck regional slope along the north end ranges from 725 ft at its west edge to 1,100 ft at its east edge, and along the south end from 500 to 875 ft. Carbonate rock is overlain by drift generally ranging in thickness from 5 to 10 ft in the Pleistocene glaciated area of the south to 150 ft in the buried (Wisconsin) valleys of the north edge of the slope. The Scottsburg lowland is a valley formed by erosion of nonresistant shales along the strike of bedrock. The
Method for Estimating Low-Flow Characteristics of Ungaged Streams in Indiana
87
EXPLANATION NORTHERN ZONE
1 2 3 4 5
Northern moraine and lake region Calumet lacustrine plain Valparaiso morainal area Kankakee outwash and lacustrine plain Steuben morainal lake area Maumee lacustrine plain
41
CENTRAL ZONE Tipton till plain
S\\\v\ Muscatatuck regional slope
Wabash lowland
50
100 MILES
i
50
100 KILOMETERS
Figure 1. Physiography of Indiana (from Schneider, 1966).
northern part of this valley is covered with drift as thick as 150 ft that makes the unit hard to detect. The Norman upland is characterized by great relief consisting of steep slopes and narrow divides. However,
many of the valley floors have been flattened by outwash, The area is underlain by siltstone that is generally erosion resistant and by soft interbedded shale. The great relief provides good drainage of the area. Introduction
The Mitchell plain is characterized by karst topography, the result of solution weathering. Numerous solution features and sinkholes are evident. Runoff is rapid, but the drainage areas are difficult to determine because much of the runoff flows into sinkholes and, thus, into numerous underground passages. At times, flow may leave the channel only to return to the streambed at a downstream location. In extreme cases, flow may be diverted to completely different streambeds. West of the Mitchell plain lies the Crawford upland, a deeply dissected area of narrow but flat river valleys, like those in the Norman upland. The eastern part contains numerous springs and caverns in the Mississippian Limestone. In general, the area is well drained. The broad Wabash lowland, west of the Crawford upland, is the largest physiographic feature in the southern zone. Underlain by nearly nonresistant siltstone and shale of Pennsylvanian age, it had been eroded to a lowland flat tract by the beginning of Pleistocene time. The lowland is covered by till and, in addition, is underlain by widespread lacustrine, outwash, and alluvial sediments. Drainage, which is poor in some parts of the lowland, has been largely modified by man.
DESCRIPTION OF DATA BASE
The data used in the regression analysis consist of low-flow characteristics and basin characteristics. The lowflow characteristics used as dependent variables in the regression analysis are from 82 of the 208 gaging stations. Low-flow characteristics were determined by a mathematical procedure that fitted a Pearson type III distribution to the logarithms of the flow data. The analysis for low-flow characteristics at each station used data from the beginning of record through the 1982 water year. The 82 stations are distributed uniformly throughout the northern and central physiographic zones of the State (fig. 2). No stations from the southern zone were used in the analysis because in that area 7Q2 and 7Q10 are almost always zero. Stations where low-flow characteristics are zero were not included in the regression analysis because the data were transformed into base 10 logarithmic (log) units before analysis. Basins where 7Q10 is zero are shown in figure 3. The few stations in the southern physiographic zone where 7Q10 is greater than zero are listed in Stewart (1983). The number of gaging stations used in the analysis was only 82 because of drainage area and regulation criteria. Stations were not used if their drainage area is greater than 1,000 mi2 or if the stream is regulated. Basins larger than 1,000 mi2 either have low-flow characteristic data available or contain some streams that are regulated. Basin characteristics were used as independent variables in the regression analysis. The characteristics tested 4
for their usefulness in estimating 7Q2 and 7Q10 are as follows: 1. Recession index: the number of days required for streamflow to decrease by 1 log unit during the low-flow period of a recession. 2. Total drainage area: the area contributing directly to surface runoff. 3. Contributing drainage area: the total drainage area minus the area of internal drainages. 4. Soil-runoff coefficient: a coefficient that relates storm runoff to the soil permeability of the five hydrologic soil groups as defined by Davis (1974, fig. 5). 5. Mean annual precipitation: the 1941-70 average annual precipitation (U.S. Department of Commerce, 1973). 6. Channel slope: the slope of the streambed between points that are 10 and 85 percent of the distance from the location on the stream to the basin divide. 7. Channel length: the distance measured along the main channel from the location on the stream to the basin divide. 8. Surface storage: the percentage of the contributing drainage area covered by lakes, ponds, and wetlands. 9. Flow-duration ratio: the flow at the 20-percent flow duration divided by the flow at the 90-percent duration. 10. Forest cover: the percentage of the contributing drainage area covered by forest. Except for recession index, total drainage area, and flowduration ratio, values for these basin characteristics at the 82 stations are listed in Glatfelter (1984, table 3). The data base of basin and low-flow characteristics was assembled for use in developing the estimating equations. The equations are more accurate if the independent variables are in the range of the data base used to develop the equations. For example, if the equations are developed from a data base for which all drainage areas are about the same size, then the estimate of low-flow characteristics will be more accurate for basins near that size than for basins of other sizes. The distribution of the data and the effect of the distribution on the potential accuracy of the equations can be determined by analyzing the data in tables 1 and 2. Two patterns can be seen from the data in table 1. First, the number of gaging stations is about the same for each subdivision even though the drainage area limits and the range of those limits increase. In other words, data from fewer stations on streams having larger drainage areas were used to develop the estimating equations. Second, the average years of record is longer for stations having larger drainage areas. Thus, greater confidence can be placed in low-flow data from stations having larger drainage basins. Low-flow data in table 2 follow the same pattern as the drainage-area data in table 1. The number of gaging stations is about the same for each subdivision even though
Method for Estimating Low-Flow Characteristics of Ungaged Streams in Indiana
87°
86°
096100
5361
EXPLANATION "
Boundary of basin
536190 A Continuous-record station and number. Complete number includes part number
04 Part number :rir_/l J*S \rWARDEN 335700$ 335700rf^^ ^pwesc^U? ^^ri^trvAio-T'j AO
KrrR5^g< fco^ ,^,^/^n^£ Mrk^>^fe^>ift£^« 339108; ^
DUNfAl^
J^
^
40°
100 MILES
50 0
50
100 KILOMETERS
Figure 2. Locations of continuous-record gaging stations used in the analysis of low flow.
the 7Q10 limits and the range of those limits increase. Thus, data from fewer stations having larger values of 7Q10 were used in the regression analysis. However, the larger values of 7Q10 are generally associated with stations having larger drainage areas and longer periods of record.
Tables 1 and 2 are summaries of the data used in the regression analysis. Given in the appendix, which follows the references, is a complete listing of the data from the 82 gaging stations used in the regression analysis to develop the final equations. Description of Data Base
5
Xv -L( -71
S
i LA PORTE.
:iIPORTttRi; - 'vl/.lVVfr H, N y S
t^/J /^l
' V M /1/vw^ -I
.'" / %. lULAGRANG^sfEbBTEN/l JELKHART pv __/i.±_^i___^£-/-f
V_ ; lx^-^'%'
i D^ALB-J
^pt^H^^A A 4
-H>-fSTARKE
EXPLANATION
j-sp^t ^ \^W.AN
41° fc
Area of basin where 7-day, 10-year low flow is zero
|WH (^Y! ;AL^N
i^.^ ! ^^4,vi^"^-fe^^^-^r^ ^ P