Mar 5, 2012 - Institute, Palo Alto, CA, Babcock & Wilcox (1989). 3. J.H. Sharp, S.A. Wentworth, "Kinetic analysis of thermo- gravimetric data," Analytical ...
Air & Waste
ISSN: 1073-161X (Print) (Online) Journal homepage: http://www.tandfonline.com/loi/uawm19
Methodology for Modeling the Devolatilization of Refuse-Derived Fuel from Thermogravimetric Analysis of Municipal Solid Waste Components Keith J. Fritsky , David L. Miller & Nicholas P. Cernansky To cite this article: Keith J. Fritsky , David L. Miller & Nicholas P. Cernansky (1994) Methodology for Modeling the Devolatilization of Refuse-Derived Fuel from Thermogravimetric Analysis of Municipal Solid Waste Components, Air & Waste, 44:9, 1116-1123, DOI: 10.1080/10473289.1994.10467308 To link to this article: http://dx.doi.org/10.1080/10473289.1994.10467308
Published online: 05 Mar 2012.
Submit your article to this journal
Article views: 131
View related articles
Full Terms & Conditions of access and use can be found at http://www.tandfonline.com/action/journalInformation?journalCode=uawm19 Download by: [123.142.191.206]
Date: 28 January 2016, At: 12:18
TECHNICAL PAPER ISSN 1047-3289 J.Air & Waste Manage. Assoc. 44: 1116-1123
Methodology for Modeling the Devolatilization of Refuse-Derived Fuel from Thermogravimetric Analysis of Municipal Solid Waste Components Downloaded by [123.142.191.206] at 12:18 28 January 2016
Keith J. Fritsky, David L. Miller, and Nicholas P. Cernansky Department of Mechanical Engineering and Mechanics Drexel University, Philadelphia, Pennsylvania The capacity of waste-to-energy (WTE) plants in the U.S. is expected to double by the year 2000. Many of these plants will burn refuse-derived fuel (RDF) consisting of municipal solid waste (MSW) components. A large percentage of the mass of RDF is volatile matter, which when combusted, contributes significantly to the boiler heat rate. A methodology is presented for estimating the devolatilization characteristics of RDF based on the premise that RDF can be modeled as some combination of select MSW components. Thermogravimetric analyses of these components provide the input data to the methodology. The outputs from the methodology are calculations of volatile weight loss versus temperature, or calculated thermograms, for the components at userdefined conditions. The hypothesis was made that these thermograms could be summed, given the mix of components in the RDF, to give an accurate description of the devolatilization process for the RDF. This hypothesis was tested by performing thermogravimetric analysis on MSW components that included newspaper and plastic consumer goods made from polystyrene foam, polyethylene terepthalate, polypropylene, and high-density polyethylene. These components were analyzed both as individual samples and as a controlled mixture that served as a surrogate RDF sample. The samples were heated within the the thermogravimetric analyzer (TGA) at a rate of 50°C/min in a nitrogen flow. Thermograms were calculated for the components and then summed according to the methodology. The calculations matched the thermogravimetric data for the surrogate RDF sample, thus supporting the hypothesis that RDF devolatilization is described by the superposition of the volatile weight loss for the constituent materials.
Introduction A severe shortage of landfill capacity for a growing volume of MSW has resulted in higher waste disposal and transportation costs. This has led U.S. municipalities to consider and adopt alternative waste management strategies such as recycling, composting, and WTE. Table I illustrates the future trend in waste management strategies in terms of the relative share of MSW1. The capacity of WTE plants in the U.S. is expected to double by the year 2000. Many of these plants will burn RDF consisting of
Implications • The research described provides a model to solve practical design problems of solid waste combustion systems. Specifically, it would be a constant heat rate. A kinetics model incorporating the research presented of the votatiles. This capability may lead to more reliable, less polluting combustor designs. The impact on iawand policymakers would be to reduce the uncertainty surrounding decisions involving the regulation of .solid waste combustors.
select MSW components. RDF is generally prepared in a facility that systematically separates the combustible fraction of MSW and reduces the fuel to a uniformly sized pellet, brique, or. fluff material. Materials in MSW such as glass and metals, are generally recovered for recycling. Table II includes the results of ASTM proximate and ultimate analyses for nine RDF samples and bituminous coal samples2. As seen on the 'table, RDF displays large fluctuations in several properties in contrast to coal including ash content, carbon content, and heating value. RDF nonhomogeneity is attributed to seasonal variations and changes in solid waste composition. Table II also shows that a significant percentage of the mass of RDF constitutes volatile matter, which burns as it evolves from the solid. The combustion of volatiles contributes significantly to the overall heating value of the fuel; therefore, it is important to understand the manner in which this volatile matter evolves from a fuel particle within a combustion device. The overall objective of the study was to model the devolatilization characteristics of RDF. The term "devolatilization" refers to the release of volatile matter by thermal decomposition in either an inert environment (also called "pyrolysis") or in a Copyright 1994 - Air & Waste Management Association
1116 • September 1994 • Vol. 44 • Journal of Air & Waste Management Association
Downloaded by [123.142.191.206] at 12:18 28 January 2016
reacting environment. The overall approach was to first study the devolatilization process for MSW components that would most likely be present in RDF. Then, using the information obtained for the components, a model could be developed to estimate the devolatilization characteristics for RDF containing some arrangement of components. The devolatilization model could be incorporated into a larger RDF combustion kinetics model to help design RDF combustors. For instance, a large release of volatiles would occur in situations where the heating value of the waste drops below a design value and the waste-feed rate is increased to maintain a constant heat rate. The combustion model could be used to size the combustor to provide sufficient residence times and excess air for complete combustion of the volatiles. The specifics of this overall approach are now summarized. Plots of weight loss as a function of temperature, called thermograms, were made from thermogravimetric analyzer (TGA) measurements for samples of selected MSW components at a specific set of conditions. With the aid of the experimental data and a mathematical model for devolatilization rate, a methodology was developed to calculate thermograms for MSW components for any set of conditions and superimpose these thermograms to produce a composite thermogram for RDF containing any combination of components. The methodology is described in detail in this paper as is the experimental work associated with development and evaluation of the methodology.
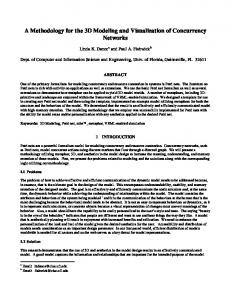
Experimental Apparatus and Procedure A Cahn TGI31 TGA was used to measure weight loss as a function of temperature for samples of the selected MSW components. Figure 1 shows the TGA along with other components of the experimental facility. Figure 2 details the TGA assembly. The main parts of the TGA were the microbalance, thermocouple probe, electrically heated furnace, and temperature controller.
The microbalance was operated in a mode allowing measurement of a maximum weight change of 1 g with a maximum sensitivity of 1 jig. Approximate sample temperatures were measured by means of a Type K thermocouple probe located within 1 cm of the sample. The furnace/controller system was capable of heating a sample to a maximum temperature of 1100°C at a maximum nominal rate of 100°C/min. Temperature programs consisted of a series of isothermal and linear ramp segments. Three samples of each MSW component were devolatilized within the TGA. Each sample was placed in a 4.2 ml quartz sample holder and sealed inside a 3.8 cm diameter quartz reactor tube, located within an electric furnace. Nitrogen gas was injected vertically through the reactor tube at a rate of 50 ml/min from a point below the sample. The TGA was purged for approximately 15 minutes at ambient temperature to reduce the concentration of oxygen below detectable limits. The sample was then heated at 20°C/min to 110°C and held at this temperature long enough to evaporate any moisture contained in the sample. Continuing the nitrogen flow, the sample was subjected to a programmed increase in temperature to achieve devolatilization. For the present study, the sample was heated to 900°C at 50°C/min. Once devolatilization was complete and the weight of the sample stabilized, oxygen was injected through the reactor tube, in proportion with nitrogen, to simulate a 50 ml/min flow of air. Burnout of any remaining char occurred at 900°C. Upon completion only the ash content in the sample holder remained.
Thermogravimetric Analysis of MSW Components
Samples of paper and plastic materials, including newspaper and consumer goods, made from polystyrene foam, polyethylene terepthalate, polypropylene, and high-density polyethylene were analyzed in the TGA. The assumption was made that a generic RDF sample would consist primarily of paper and plastic since these materials account for a sizeable Table I. Relative share of MSW for waste management strategies in 1988 and as expected by the fraction of the waste stream and are not year 20001. generally removed from MSW when RDF is produced. Dissection of RDF pellets from two different processing facilities revealed paper and plastic and virtually Amount Weight % Amount Weight % nothing else. However, this does not Strategy (millions of tons) (millions of tons) eliminate the possibility that RDF may 130.5 72.7 106.5 Landfills 49.3 contain small amounts of other materials 23.5 13,1 84.4 Recycling 25.2 like wood, leather, rubber, yard waste, 1.0 0.6 0.1 Incineration ) pressure gauge Oxygen
( T ) thermocouple
Nitrogen
Figure 1. Diagram of experimental facility.
Methodology Development Derivation of Kinetic Parameters from Thermogravimetric Data The first step in most methods that allow kinetic analysis of thermogravimetric data is to postulate a model for the reaction rate of the thermal decomposition process. For the thermal decomposition of homogeneous solids, the reaction rate can be written in the general form3-4-5 da = k f ( a ) dt
(1)
= Aexp(JL).
(2)
Vent a is the fraction of the solid decomposed at time t for a single decomposition region and is defined as W- - W
w,-w f Furnace
Reaction gas Figure 2. Detail of TGA assembly.
upon heating above 100°C. The weight then levels out to a lower equilibrium value; the weight loss up to this point is considered to be the moisture content of the sample. The second region of weight loss beginning at 30 minutes is due to devolatilization of the sample upon heating to 900°C at 50°C/min. The third region
(3)
where wL is the initial weight, wf is the final weight, w is the measured weight at time t. f(a) is a function of the reacted fraction that depends on the reaction mechanism and k is the temperature dependent rate where A is the preexponential or frequency factor (min1), E is the apparent activation energy (kcal/gmol), R is the universal gas constant (kcal/gmol-K), and T is the temperature (K). It has been found that many types of solids decompose in such a way that the rate of decomposition is proportional to some power of the unreacted fraction of the solid. For reactions of this type, f(a) = (1- a)* where n is called the order of the reaction. Equation 1 can now be written as (4)
The method of Coats and Redfern6 assumes that the observed thermal decomposition behavior of a solid is modeled by Equation 4. This equation, and all expanded and rearranged forms
1118 • September 1994 • Vol. 44 • Journal of Air & Waste Management Association
of it, will occasionally be referred to as the "model" on which the methodology is based. The model applies to a reactant that decomposes when it is heated at a linear rate, P, where
Performing the integration and taking logarithms of both sides of the result yields the following relation for all values of n except n=l
A * ft 2RTl
(5)
IT
The heating rate can now be introduced into the equation for the reaction rate (Equation 4) to eliminate time so that
where the Arrhenius form of the rate constant has been used. Upon separating variables, the following integral equation results:
23RT Substituting n-1 into Equation 7, integrating, and taking logs yields
AR f. 2RT
g
\
J "l0gpEL
T2
E j 2.3RT
Equations 8 and 9 are of the linear form y = mx + b where
I
da
A f
-E/RT
dT.
Jo (l-o)»
(7)
= log
1
y = log
0 .8 ight Fract:]
0 .6 -
(13)
-
0 .2
-
['•¥]•
•
,
A
,
,
C
y
,
i
200
,
i
.
i
,
i
,
-
,
400 600 Temperature, fC
800
The expression for b is virtually constant for most values of E and for the temperature range at which most solid-phase reactions i
•
11 ^ j
•
'
'
|
'
i
i
"
0 .8 -
\
0 .6 0 .4 0 .2
Weight Fraction
1
Weight Fract]
(14)
1000
Figure 4. Decomposition of three individual newspaper samples.
i
i
i
i
\
,
_ r._
0.8
C
200
.
i
i
|
i
i-v
•
«
i
1
i
' '\
,
,
C3
1000
1. ,
,
200
,
1 ,
400 600 Temperature, °C
1
0 .8
1
0 .8
-
0 .6
-
1
I
1
1
1
•
0 .2 ' , , , I.
0
20.0
,
400 600 Temperature, °C
i
800
Weight Fract:
0 .4
1
i
•
-
0 .2
1
Figures. Decomposition of three individual polyethylene terepthalate samples.
•
0 .4
,
1000
1000
• ' A\ ' ' '
0
-
800
Figure 7.. Decomposition of three individual polypropylene samples.
'
-
-i
[•
0.2 ,
Figure S. Decomposition of three individual polystyrene foam samples.
i
0.4
i—,—
800
400 600 Temperature, °C
L
|
0.6
0
0 .6
(M) (12)
1 1
0 .4
d)
Weight Fraction
Downloaded by [123.142.191.206] at 12:18 28 January 2016
(n=l)
-
0
§
(10)
T2(l-n)
0
c)
1
.
1
.
200
,
,
—i—t—i—-
400 600 Temperature, °C
800
.
i
,
1000
Figure S. Decomposition of three individual high-density polyethylene samples.
Journal of Air & Waste Management Association • Vol. 44 • September 1994 • 1119
Downloaded by [123.142.191.206] at 12:18 28 January 2016
TECHNICAL PAPER occur. Therefore, if the thermal decomposition process under consideration follows the kinetic model described by Equation 4, a plot of y versus x should result in a straight line of slope m and intercept b for a correct value of the reaction order n. The (x,y) data points in this plot, referred to here as kinetic data, are calculated from the thermogravimetric data (a,T) over a specified range of a. The Coats-Redfern method requires choosing a value for n based on the assumption that the reaction order remains constant throughout the decomposition process. The method suggests that this value be chosen such that the best straight-line fit through the kinetic data results. The activation energy is then computed from the slope of this line. In applying the Coats-Redfern method, the activation energy and the reaction order are determined empirically by fitting experimental data. These parameters do not describe the rate of individual reactions that occur competitively and sequentially to yield volatiles. The purpose of these parameters is to describe the combined or overall effect of these reactions by providing a good fit to the weight-loss versus temperature data. As a result, the activation energy and reaction order derived from thermogravimetric data are sometimes referred to as "apparent" kinetic parameters. These parameters serve to characterize the experimental weight loss curves so that quantitative comparisons among curves can be made.
ART2 l-a=10
10 -E/2.3 RT
(19)
Introducing the definition for a into Equation 19 and rearranging gives the equation for calculating a thermogram when n=l
w=
ART2 j - w f ) [1 -10 " PE
10 -E/2.3 RT
(20)
For the case when n>l, the derivation of the equation for calculating thermograms starts with Equation 15. Replacing the exponent (1-u) in the expression on the left-hand side of Equation 15 with the -(n-1) equivalent allows the following expression 1 (l-a)nl
ART* (n- 1) T PE
2RT1 1 0 -E/RT
Introducing the definition of a into Equation 21 and rearranging yields the following equation for calculating a thermogram when n>l = wr(wrwf) (22)
Derivation of Equations for Calculating Thermograms Thermograms may be calculated by solving equations derived from the model for reaction rate (Equation 4). Three equations can be derived depending on whether the reaction order is chosen to be less than one, equal to one, or greater than one. For the case where n< 1, Equation 6 is integrated (upon separating variables) to yield the following: l - ( l - « ) l n ^ ART2
(1-n)
pE
I
t
1
2RTI -H/RT
J
E '
(15)
Algebraic manipulation of the above equation leads to the following expression:
l . a J Vl AKPg-ipr 2RT]
-E/RT
(16)
Introducing the definition of a (Equation 3) and solving for the weight gives the equation for calculating a thermogram when n< 1 w=
.
Wf
The preexponential factor, A, is computed from the intercept term, b, of the linear equation used to plot the kinetic data according to the Coats-Redfern method. Solving this intercept term (Equation 14) for A gives A=
(18)
The preexponential factor is computed for several temperatures of the range covering the observed devolatilization region. These temperatures are also used in Equation 17 to calculate the thermogram. The equation for calculating thermograms when n= 1 is derived from the linear equation used to plot kinetic data according to the Coats-Redfern method (Equation 9). Taking the inverse logarithm of this equation twice in succession gives the following expression:
Using Equation 17 (if nl), one can calculate a thermogram for a given set of model parameters. The model parameters are of the following types: constant (R), experimentally derived (wj/Wj, E, b,n), and user-defined (wi( T, P). For a given material, the user selects values for sample size, heating rate, and temperature and "plugs in" these values along with the experimentally derived parameters for that material. The user may select sample size and heating rate values that differ from those associated with the TGA data from which the experimentally derived parameters were obtained. This difference, or "mismatch" in conditions, will introduce an inaccuracy in the calculated thermogram. In other words, the calculation will deviate from experimental data that would be obtained in the event a TGA experiment was conducted for the material-of-interest at the user-defined conditions. Such a deviation should be negligible if the mismatch in conditions is small; however, if the mismatch is large, the experimentally derived model parameters used in the calculation may need to be modified.
Application of the Coats-Redfern Method to TGA Data for Selected MSW Components As discussed in the experimental section, three thermograms were generated for each sample type: newspaper, polystyrene foam, polyethylene terepthalate, polypropylene, and high-density polyethylene. The Coats-Redfern method was applied to the devolatilization region of each thermogram to obtain the apparent activation energy, E, and the intercept term, b, for the case where the reaction order, n, equals one. For all sample types, letting n-1 gave the best straight-line fit through the kinetic data. In the case of the plastic samples, thermogravimetric data within the interval from a = 0.1 to a = 0.9 were used to carry out the kinetic analyses of the devolatilization regions. In other words, 80 percent of the weight loss as a result of the devolatilization, from a point where 10 percent of the volatile matter had evolved to a point where 90 percent of the volatile matter had evolved, was covered in the kinetic analysis. In the case of newspaper, the thermograms revealed a primary devolatilization region char-
1120 • September 1994 • Vol. 44 • Journal of Air & Waste Management Association
0 14
.
•
'
'
1
'
i
'
•
•
i
•
•
1
i
'
1
0.12
i
u en Weight,
acterized by significant weight loss followed by a secondary region starting at 350 to 400°C where the weight loss was small and the rate of devolatilization was much lower (see Figure 4). As a result, the Coats-Redfern method was applied twice: from a = 0.1 to a = 0.7 and from a = 0.8 to a = 0.9. For each of the four plastic materials, separate E and b values were computed, while for newspaper, two distinct E and b values, E,, ht (a : 0.1 - 0.7) and E2, b 2 (a : 0.8 - 0.9), were computed. For each material, a mean E value and an uncertainty were calculated. The uncertainty was expressed as the 95 percent confidence interval based on the t distribution. A mean b value was also calculated. Table III presents the mean activation energies and uncertainties, mean intercept values, and initial and final devolatilization temperatures.
-
0.1
%
0.08 \
0.06 0.04
'_
0.02
':
0
•
C)
V
-
,
,
i
.i i
200
1
I
1
1
1
,
1
,
1
400 600 Temperature, °C
i
1
>
800
u _ t _
1000
Methodology Evaluation
Downloaded by [123.142.191.206] at 12:18 28 January 2016
Comparison of Experimental and Calculated Therrnograms
Figure 9. Comparison of a calculated thermogram (dashed line) with thermogravimetric data for a newspaper sample (solid line).
In order to verify that the reaction-rate model accurately described devolatilization processes for the MSW components considered, thermograms were calculated and compared to TGA data. Equation 20 (for n=l) was used to calculate thermograms for all the components. Values for the model parameters corresponded to experimental data and conditions, ie. w{ and wf were obtained from the experiment, E and b were derived from the TGA data, and a was chosen to be 50°C/min to match the experimental heating rate. An illustration of how well the model reproduced experimental thermograms is presented in Figure 9. This figure compares calculated and experimental thermograms for newspaper. The calculated thermogram was constructed in two sections and connected near a point where the rate of devolatilization abruptly changed as observed from the TGA data. Using the mean E t and bj values of 30.1 kcal/gmol and 4.6 from Table III, respectively, the first section was generated by computing discrete weight values from discrete temperatures (in degrees Kelvin) inputted in IK increments over the temperature range corresponding to the region from a = 0 to a = 0.8. Using the mean E2 and b2 values of 1.95 kcal/gmol and -5.1, respectively, the second section of the calculated thermogram was generated in the same manner as the first over the range from a = 0.8 to a = 1. Figure 9 shows that the model
estimates the experimental data very accurately. This same level of agreement was observed for the other components.
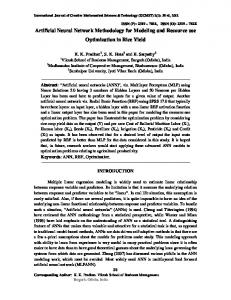
Prediction of the Devolatilization of a Surrogate RDF Sample RDF burned in future WTE plants will be a loose or densified collection of various materials consisting mostly of paper and plastics. It would be possible to estimate the types and amounts of component materials in a supply of RDF based on MSW composition data for a particular municipality and the operational characteristics and day-to-day experience of the RDF processing facility. If the composition of an RDF supply was known with a reasonable degree of certainty, would it be possible to predict the devolatilization characteristics of the RDF by superimposing known characteristics of the component materials? Could the calculated thermograms for the RDF components be summed to yield an accurate, composite thermogram for the RDF mixture? An experiment was performed to observe whether this intuitive theory of superposition would be supported. A TGA run was performed with a surrogate, five-component RDF sample containing 0.08 g of newspaper and equal amounts (0.02 g) of poly styrene foam, polyethylene terepthalate,
Table III. Devolatilization temperatures, activation energies, and intercept terms for select MSW components.
Temptnture^C) 304 419 466 484
«• 4.8;
461
48.3 ±1.8 82.0 ±6.2 63.2 ±0.9
10 percent of tiie xjrndteiy^pereflntolthe ifremtfteiOueruer
1. 2. 3.
-6.1
8.3 17.7 11.6 1S.4 matter has evolved.
4. 5,
ation wm$m component wa Journal of Air & Waste Management Association • Vol. 44 • September 1994 • 1121
TECHNICAL PAPER
200
400 600 Temperature, °C
800
1000
Downloaded by [123.142.191.206] at 12:18 28 January 2016
Figure 10. Comparison of a composite thermogram (dashed line) with thermogravimetric data for a five-component surrogate RDF sample (solid line).
polypropylene, and high-density polyethylene. These components were placed in the sample holder as a loose mixture of 6 mm x 6 mm fragments and heated in the TGA at a rate of 50°C/ min. Using Equation 20, thermograms were calculated for all five components. Values for the model parameters were substituted into this equation as follows: activation energies and intercept terms were obtained from Table III, a was set at 50°C/ min, and initial weights were known from weighing each component on an analytical balance. For the newspaper component, the initial weight was corrected by subtracting the weight lost as a result of the evaporation of moisture. This correction was estimated based on the TGA data for newspaper samples. No correction was necessary for the plastic components since weight loss from evaporation was not evident from the TGA data. For each component, the final weight was computed by multiplying the corrected initial weight by that component's volatile fraction (= Wf/Wj) which was estimated from TGA data. Thermograms were calculated for the components over a temperature range of the complete de volatilization of the surrogate RDF sample. The calculated thermograms for the five components were summed, creating a composite thermogram. In Figure 10 the composite thermogram is compared to the experimental thermogram for the surrogate RDF sample. The excellent agreement between the calculated and experimental results supports the superposition theory.
Conclusions A methodology was introduced for modeling the devolatilization characteristics of RDF in terms of temperature-dependent weight loss. The basic premise of the methodology is that RDF is modeled as a combination of select MSW components. Kinetic parameters are derived for each component from TGA data measured at a specific set of conditions. These experimentally derived parameters, along with userdefined parameters, are inputted to model equations for the purpose of calculating thermograms for the components. The component thermograms are summed to create a composite thermogram that is an estimate of the devolatilization for the as-modeled RDF. The methodology has several attractive features as a thermal analysis tool for waste fuels. First, it reduces the need for conducting costly TGA experiments once a comprehensive thermogravimetric and kinetic database is established for MSW components. Second, the methodology allows the user to quickly observe the effect of changes in RDF composition and heat-
ing rate on devolatilization. Also, the methodology can be integrated easily into a combustion kinetics model for RDF. The experimentally derived parameters presented in Table III may be used to model RDF devolatilization. These parameters correspond to the following set of conditions: 0.1 g sample size, 50°C/min heating rate, and first-order reaction kinetics (n=l). One must use caution, however, when using these parameters to calculate thermograms for a different set of conditions. This situation would arise when modeling RDF devolatilization within a practical combustion system with heating rates and sample sizes differing by several orders of magnitude from the experimental conditions achievable with commercial TGAs. In particular, the activation energy and intercept terms may change significantly for different conditions. For example, as a result of heat and mass transfer effects, E was shown to decrease significantly with an increase in heating rate from 10 to 100°C/min and an increase in sample size from 0.1 to 1.0 g7. In the case of modeling devolatilization in a practical combustion device, the sensitive parameters may be modified by extrapolating a limited set of data that quantifies the effect of heating rate and sample size on these parameters. Outside of this approach, one may choose to simply use the parameters in Table III and the corresponding conditions to model the RDF devolatilization process in practical combustors. This would be a less accurate yet reasonable "first cut" approach.
Nomenclature = preexponential factor (min1) = intercept term of the linear, integrated form of the reaction rate equation E = apparent activation energy (kcal/gmol) Ej = apparent activation energy associated with the primary devolatilization region for newspaper (kcal/gmol) E2 = apparent activation energy associated with the secondary devolatilization region for newspaper (kcal/gmol) f(a) = function of the reacted fraction of a solid that depends on the reaction mechanism k = temperature-dependent rate constant (min->) m = slope term of the linear, integrated form of the reaction rate equation (K) n = apparent reaction order R = universal gas constant (kcal/gmol-K) T = temperature (K) t = time (min) w = measured weight at time t (grams) = equilibrium weight of a solid after devolatilization Wf and prior to char burnout (grams) w; = equilibrium weight of a solid after evaporation and prior to devolatilization (grams) x = independent variable of the linear, integrated form of the reaction rate equation (K*1) , y = dependent variable of the linear, integrated form of the reaction rate equation a = fraction of a solid decomposed at time t P = heating rate (°C/min or K/min) ASTM- American Society for the Testing of Materials MSW - municipal solid waste RDF - refuse-derived fuel TGA - thermogravimetric analyzer WTE - waste-to-energy A b
1122 • September 1994 • Vol. 44 • Journal of Air & Waste Management Association
Acknowledgments This research was supported by the Pennsylvania Energy Development Authority under Grant No. 488-034.
7. K.J. Fritsky, "Devolatilization characteristics of refuse derived fuels and selected municipal solid waste components," M. S. Thesis, Drexel University, Philadelphia, PA (1991).
Downloaded by [123.142.191.206] at 12:18 28 January 2016
References 1. "At a Glance: Solid Waste Disposal Overview™ National Solid Wastes Management Association. Washington, D.C. (1991). 2. C.R. McGowin, E.M. Petrill, M.A. Perna, D.R. Rowley, "Fluidized bed combustion testing of coal/refuse-derived fuel mixtures," final report to the Electric Power Research Institute, Palo Alto, CA, Babcock & Wilcox (1989). 3. J.H. Sharp, S.A. Wentworth, "Kinetic analysis of thermogravimetric data," Analytical Chemistry, 41;2060 (1969). 4. J.M. Criado, "Kinetic analysis of DTG data from master curves," Thermochimica Acta, 24J186 (1978). 5. J.H. Flynn, R.E. Florin, "Degradation and pyrolysis mechanisms," in Pyrolysis and GC in Polymer Analysis (S.A. Liebman, E.J. Levy, E. J. eds.) Marcel Dekker, Inc., New York, (1985). 6. Coats, A. W.; Redfern, J. P. "Kinetic parameters from thermogravimetric data," Nature, 201 .'68 (1964).
About the Authors K. J. Fritsky is a research mechanical engineer, U. S. Environmental Protection Agency, Air and Energy Engineering Research Laboratory, Research Triangle Park, NC 27711. He is a graduate of Drexel University, Philadelphia, PA 19104 where work for this paper was completed. D. L Miller is associate professor, Mechanical Engineering and Mechanics at Drexel University. N. P. Cernansky is the Hess Professor of Combustion, Mechanical Engineering and Mechanics at Drexel University. This manuscript was submitted for peer review on April 1993.
Washington Issues Briefing \ /
Sponsored by
Air & Wast^l Management Association's U.S. Government Affairs Committee JThursday, November 1?^ 1994 parlton Hotel Washington, DC liiiliiili
Mark your calendar noWfiiPiSlim^.^nference like no other. Chock-full of inside inioxM&&m,; presented by senior governme|||.m.grj:|ge||..w;h^...^now the big-picture questions as well as J of developing requirements, ofj^^^llj^ii^^^^ljfhemes which cut across environment focussed on trends that will shage!^v|rormenitaj protection for the rest of this century, and set for the . pause right after the N o v e m b e r l ^ ^ P ^ ^ ^ ^ ^ ^ n s e seven-hour W a s h i n ^ ^ ^ ^ has been specially designed both to kick off the Association's expanded Washington focus aha provide unparalleled opportunities for o f f S | ^ ^ ^ H | | ^ ^ ^ d e d s i o n m a k e ^ f Thursday, November 17, at the CarTOTP* 0 4 *^^ ™~«#m feature unified sessions on legislative^ issues in air, water and waste programiP informal remarks by key Congressmen on thjkgH mandates movements on compliance and i n ^ f c ^ p i ^ ^ i d d r e s s "dealing with the regulatory avalanche" from company and state agency perspectives. For further information, contactidike Roy at A&WMA h e a d q ^ r t » ^ ^ ^ ^ ™ ^ i l 2 ) 232-3450.
Journal of Air & Waste Management Association • Vol. 44 • September 1994 • 1123