Available online at www.sciencedirect.com
Drug and Alcohol Dependence 95S (2008) S74–S104
Methods for testing theory and evaluating impact in randomized field trials: Intent-to-treat analyses for integrating the perspectives of person, place, and time C. Hendricks Brown a,∗ , Wei Wang a , Sheppard G. Kellam b,e , Bengt O. Muth´en c , Hanno Petras d , Peter Toyinbo a , Jeanne Poduska b , Nicholas Ialongo e , Peter A. Wyman f , Patricia Chamberlain g , Zili Sloboda h , David P. MacKinnon i , Amy Windham b , The Prevention Science and Methodology Group a
Department of Epidemiology and Biostatistics, College of Public Health, University of South Florida, 13201 Bruce B Downs Blvd., Tampa, FL 33612, United States b American Institutes for Research, 921 E. Fort Avenue, Suite 225, Baltimore, MD 21230, United States c Graduate School of Education & Information Studies, UCLA, Moore Hall, Box 951521, Los Angles, CA 90095, United States d University of Maryland, Department of Criminology and Criminal Justice, College Park, MD 20742, United States e Johns Hopkins University, Bloomberg School of Public Health, 624 N. Broadway, 8th Fl., Baltimore, MD 21205, United States f University of Rochester Medical Center, 300 Crittenden Blvd., Rochester, NY 14642, United States g Center for Research to Practice, 392 E. 3rd Avenue, Eugene, OR 97401, Oregon Social Learning Center, 10 Shelton McMurphy Blvd., Eugene, OR 97401, United States h Institute of Health and Social Policy, University of Akron, Akron, OH, 44325, United States i Department of Psychology, Arizona State University, Tempe, AZ 85287, United States Received 7 September 2007; received in revised form 16 November 2007; accepted 19 November 2007 Available online 22 January 2008
Abstract Randomized field trials provide unique opportunities to examine the effectiveness of an intervention in real world settings and to test and extend both theory of etiology and theory of intervention. These trials are designed not only to test for overall intervention impact but also to examine how impact varies as a function of individual level characteristics, context, and across time. Examination of such variation in impact requires analytical methods that take into account the trial’s multiple nested structure and the evolving changes in outcomes over time. The models that we describe here merge multilevel modeling with growth modeling, allowing for variation in impact to be represented through discrete mixtures—growth mixture models—and nonparametric smooth functions—generalized additive mixed models. These methods are part of an emerging class of multilevel growth mixture models, and we illustrate these with models that examine overall impact and variation in impact. In this paper, we define intent-totreat analyses in group-randomized multilevel field trials and discuss appropriate ways to identify, examine, and test for variation in impact without inflating the Type I error rate. We describe how to make causal inferences more robust to misspecification of covariates in such analyses and how to summarize and present these interactive intervention effects clearly. Practical strategies for reducing model complexity, checking model fit, and handling missing data are discussed using six randomized field trials to show how these methods may be used across trials randomized at different levels. © 2008 Published by Elsevier Ireland Ltd. Keywords: Intent-to-treat analysis; Group-randomized trials; Mediation; Moderation; Multilevel models; Growth models; Mixture models; Additive models; Random effect models; Developmental epidemiology; Prevention
1. Introduction
∗
Corresponding author. Tel.: +1 813 974 6672. E-mail address:
[email protected] (C.H. Brown).
0376-8716/$ – see front matter © 2008 Published by Elsevier Ireland Ltd. doi:10.1016/j.drugalcdep.2007.11.013
Randomized field trials (RFTs) provide a powerful means of testing a defined intervention under realistic conditions. Just as important as the empirical evidence of overall impact that a trial
C.H. Brown et al. / Drug and Alcohol Dependence 95S (2008) S74–S104
provides (Flay et al., 2005), an RFT can also refine and extend both etiologic theory and intervention theory. Etiologic theory examines the role of risk and protective factors in prevention, and an RFT formally tests whether changes in these hypothesized factors lead to the prevention of targeted outcomes. Theories of intervention characterize how change in risk or protective factors impact immediate and distal targets and how specific theory driven mediators produce such changes (Kellam and Rebok, 1992; Kellam et al., 1999). The elaborations in theory that can come from an RFT draw on understanding the interactive effects of individual level variation in response over time to different environmental influences. An adolescent drug abuse prevention program that addresses perceived norms, for example, may differentially affect those already using substances compared to nonusers. This intervention’s effect may also differ in schools that have norms favoring use compared to schools with norms favoring nonuse. Finally, the impact may differ in middle and high school as early benefits may wane or become stronger over time. This paper presents a general analytic framework and a range of analytic methods that characterize intervention impact in RFTs that may vary across individuals, contexts, and time. The framework begins by distinguishing the types of research questions that RFTs address, then continues by introducing a general three-level description of RFT designs. Six different RFTs are described briefly in terms of these three levels, and illustrations are used to show how to test theoretically driven hypotheses of impact variation across persons, place, and time. In this paper, we focus on intent-to-treat (ITT) analyses that examine the influence of baseline factors on impact, and leave all post-assignment analyses, such as mediation analysis, for discussions elsewhere. This separation into two parts is for pragmatic and space considerations only, as post-assignment analyses provide valuable insights into ITT results and are generally included in major evaluations of impact. For these intent-to-treat analyses, we present standards for determining which subjects should be included in analyses, how missing data and differences in intervention exposure should be handled, and what causal interpretations can be legitimately drawn from the statistical summaries. We present the full range of different modeling strategies available for examining variation in impact, and we emphasize those statistical models that are the most flexible in addressing individual level and contextual factors across time. Two underutilized methods for examining impact, generalized additive mixed models (GAMM) and growth mixture models (GMM), are presented in detail and applied to provide new findings on the impact of the Good Behavior Game (GBG) in the First Generation Baltimore Prevention Program trial. We first define a randomized field trial and then describe the research questions it answers. An RFT uses randomization to test two or more defined psychosocial or education intervention conditions against one another in the field or community under realistic training, supervision, program funding, implementation, and administration conditions. All these conditions are relevant to evaluating effectiveness or impact within real world settings (Flay, 1986). In contrast, there are other randomized trials that test the efficacy of preventive interventions in
S75
early phases of development. These efficacy trials are designed to examine the maximal effect under restricted, highly standardized conditions that often reduce individual or contextual variation as much as possible. Testing efficacy requires that the intervention be implemented as intended and delivered with full fidelity. The interventions in efficacy trials are delivered by intervention agents (Snyder et al., 2006) who are carefully screened and highly trained. In efficacy trials, they are generally professionals who are brought in by an external research team. By contrast, the intervention agents of RFTs are often parents, community leaders, teachers or other practitioners who come from within the indigenous community or institutional settings (Flay, 1986). The level of fidelity in RFTs is thus likely to vary considerably, and examining such variation in delivery can be important in evaluating impact (Brown and Liao, 1999). Both types of trials are part of a larger strategy to build new interventions and test their ultimate effects in target populations (Greenwald and Cullen, 1985). As a special class of experiments, RFTs have some unique features. Most importantly, they differ from efficacy trials on the degree of control placed on implementation of the intervention. They are designed to address questions other than those of pure efficacy, and they often assess both mediator and moderator effects (Krull and MacKinnon, 1999; MacKinnon and Dwyer, 1993; MacKinnon et al., 1989; Tein et al., 2004). Also, they often differ from many traditional trials by the level at which randomization occurs as well as the choice of target population. These differences are discussed below starting with comments on program implementation first. Program implementation is quite likely to vary in RFTs due to variation in the skills and other factors that may make some teachers or parents more able to carry out the intervention than others even when they receive the same amount of training. These trials are designed to test an intervention the way it would be implemented within its community, agency, institutional, or governmental home setting. In such settings, differences in early and continued training, support for the implementers, and differences in the aptitude of the implementers can lead to variation in implementation. The intervention implementers, who are typically not under the control of the research team the way they are in efficacy trials, are likely to deliver the program with varied fidelity, more adaptation, and less regularity than that which occurs in efficacy trials (Dane and Schneider, 1998; Domitrovich and Greenberg, 2000; Harachi et al., 1999). Traditional intentto-treat analyses which do not adjust for potential variations in implementation, fidelity, participation, or adherence, are often supplemented with “as-treated” analyses, mediation analysis, and other post-assignment analyses described elsewhere (Brown and Liao, 1999; Jo, 2002; MacKinnon, 2006). A second common difference between RFTs and controlled efficacy trials is that the intervention often occurs at a group rather than individual level; random assignment in an efficacy trial is frequently at the level of the individual while that for an RFT generally occurs at levels other than the individual, such as classroom, school, or community. Individuals assigned to the same intervention cluster are assessed prior to and after the intervention, and their characteristics, as well as characteris-
S76
Table 1 Design factors at the individual, group, and block level and covariates hypothesized to account for variation in intervention impact for six randomized field trials Level where intervention assignment occurs (trial name/sponsor)
Active intervention arms Goal
1. Individual Level Random Assignment (Rochester Resilience Program/NIMH (RRP))
3. Individual and classroom level random assignment (Third Generation Baltimore Prevention Program Whole Day /NIDA (Third Generation BPP Trial))
4. School level randomization (Georgia Gatekeeper Program/NIMH (GA Gatekeeper Trial))
6. County level randomization (California Multidimensional Treatment Foster Care (MTFC) Trial/NIMH (CA MTFC))
Level of blocking
470 1st–3rd graders with behavioral or learning problems
Individual level assignment within classroom to school-based mentor or control condition Impact predicted to vary by grade level, teacher, mentor, and school factors 41 classrooms
75 classrooms in 5 schools in 1 district
Promoting Resilient Children Initiative (PRCI) delivered by school-based mentors to 1st–3rd graders and their parents Goal: reduce internalizing and externalizing problems
Impact predicted to vary by level of child risk at baseline
Good behavior game, mastery learning classroom-based interventions
1196 1st graders who were present when initial assessments were made
Goal: promote behavior and learning, success in school, and long-term prevention of drug use and externalizing behavior
Impact predicted to vary by individual aggressive, disruptive behavior at beginning of first grade
Impact predicted to vary by average classroom aggressive, disruptive behavior at baseline
Impact predicted to vary by school and urban factors
Whole day classroom intervention aimed at teachers to improve reading instruction, classroom management, and parent involvement
First graders randomly assigned to classroom within school whenever they enter throughout year
One of two classrooms randomly assigned to intervention in each of 12 schools
12 elementary schools
Goal: improve achievement and reduce aggressive, disruptive behavior, and long-term impact on drug use and externalizing behaviors Training of all school staff in QPR citizen gatekeeper
Impact predicted to vary by child achievement and aggressive, disruptive behavior at baseline
Impact predicted to vary by baseline teaching performance and behavior management 20 middle and 12 high schools randomly assigned different times of training
Impact predicted to vary by school factors
Goal: increase identification of suicidal youth by school staff 5. School district randomization (Adolescent Substance Abuse Prevention Study/RW Johnson (ASAPS))
Level where intervention assignment occurs Predicted impact
50,000 Students who were enrolled in one of the 32 schools at the beginning of the year. A stratified random sample of school staff in these schools, assigned according to their placement at beginning of school year Impact predicted to vary by gender, grade level, race/ethnicity
19 schools in 5 geographic areas
One school district
Impact predicted to vary by staffs’ average referral behavior on baseline attitudes and behavior 84 school districts
Not applicable
New DARE Program in 7th and 9th Grades
18,000 7th Graders initially enrolled in one of the school districts
Goal: prevent adolescent substance use/abuse
Impact predicted to vary by baseline risk status
Impact predicted to vary by school norms and sociodemographics
Impact predicted to vary by geographic region
Community Development Team (CDT) vs. Standard Condition for Implementation
Family Mental Health Agencies and County Directors. Foster Care Families in these counties; none available for intent-to-treat analyses Impact predicted to vary by role in county implementation
40 Counties randomized to timing and type of implementation
1 State
Goal: increase full implementation of MTFC at the county level through peer-to-peer cross-county program
Impact predicted to vary by static county characteristics
6 geographic regions
C.H. Brown et al. / Drug and Alcohol Dependence 95S (2008) S74–S104
2. Classroom level random assignment (First Generation Baltimore Prevention Program/NIMH NIDA (First BPP Trial))
Individual level sample and intent-to-treat denominators Predicted impact
C.H. Brown et al. / Drug and Alcohol Dependence 95S (2008) S74–S104
tics of their intervention group may serve in multilevel analyses of mediation or moderation (Krull and MacKinnon, 1999). In addition, levels nested above the group level where intervention assignment occurs, such as the school in a classroom randomized trial, can also be used in assessing variation in intervention impact. Examples of six recent multilevel designs are presented in Table 1; these are chosen because random assignment occurs at different levels ranging from the individual level to the classroom, school, district, and county level. This table describes the different levels in each trial as well as the individual level denominators that are used in intent-to-treat analyses, a topic we present in detail in Section 2.2. We continue to refer to these trials in this paper to illustrate the general approach to analyzing variation in impact for intent-to-treat, as treated, and other analyses involving post-assignment outcomes. Finally, RFTs often target heterogeneous populations, whereas controlled experiments routinely use tight inclusion/exclusion criteria to test the intervention with a homogenous group. Because they are population-based, RFTs can be used to examine variation in impact across the population, for example to understand whether a drug prevention program in middle school has a different impact on those who are already using substances at baseline compared to those who have not yet used substances. This naturally offers an opportunity to examine the impact by baseline level of risk, and thereby examine whether changes in this risk affect outcomes in accord with etiologic theory. We are often just as interested in examining variation in impact in RFTs as we are in examining the main effect. For example, a universal, whole classroom intervention aimed proximally at reducing early aggressive, disruptive behavior and distally at preventing later drug abuse/dependence disorders may impact those children who were aggressive, disruptive at baseline but have little impact on low aggressive, disruptive children. It may work especially well in classes with high numbers of aggressive, disruptive children but show less impact in either classrooms with low numbers of aggressive, disruptive children or in classrooms that are already well managed. Incorporating these contextual factors in multilevel analyses should also increase our ability to generalize results to broader settings (Cronbach, 1972; Shadish et al., 2002). Prevention of or delay in later drug abuse/dependence disorders may also depend on continued reduction in aggressive, disruptive behavior through time. Thus our analytic modeling of intervention impact or RFTs will often require us to incorporate growth trajectories, as well as multilevel factors. RFTs, such as that of the Baltimore Prevention Program (BPP) described in this issue of Drug and Alcohol Dependence (Kellam et al., 2008), are designed to examine the three fundamental questions of a prevention program’s impact on a defined population: (1) who benefits; (2) for how long; (3) and under what conditions or contexts? Answering these three questions allows us to draw inferences and refine theories of intervention far beyond what we could do if we only address whether a significant overall program impact was found. The corresponding analytical approaches we use to answer these questions require greater sophistication and model checking than would
S77
ordinarily be required of analyses limited to addressing overall program impact. In this paper, we present integrative analytic strategies for addressing these three general questions from an RFT and illustrate how they test and build theory as well as lead to increased effectiveness at a population level. Appropriate uses of these methods to address specific research questions are given and illustrated on data related to the prevention of drug abuse/dependence disorders from the First Baltimore Prevention Program trial and other ongoing RFTs. The prevention science goal in understanding who benefits, for how long, and under what conditions or contexts draws on similar perspectives from both theories of human behavior and from methodology that characterize how behaviors change through time and context. In the developmental sciences, for example, the focus is on examining how individual behavior is shaped over time or stage of life by individual differences acting in environmental contexts (Weiss, 1949). In epidemiology, which seeks to identify the causes of a disorder in a population, we first start descriptively by identifying the person, place, and time factors that link those with the disorder to those without such a disorder (Lilienfeld and Lilienfeld, 1980). From the perspective of prevention methodology, these same person, place, and time considerations play a fundamental roles in trial design (Brown and Liao, 1999; Brown et al., 2006, 2007a,b) and analysis (Brown et al., 2008; Bryk and Raudenbush, 1987; Goldstein, 2003; Hedeker and Gibbons, 1994; Muth´en, 1997; Muth´en and Shedden, 1999; Muth´en et al., 2002; Raudenbush, 1997; Wang et al., 2005; Xu and Hedeker, 2001). Randomized trial designs have extended beyond those with individual level randomization to those that randomize at the level of the group or place (Brown and Liao, 1999; Brown et al., 2006; Donner and Klar, 2000; Murray, 1998; Raudenbush, 1997; Raudenbush and Liu, 2000; Seltzer, 2004). Randomization also can occur simultaneously in time and place as illustrated in dynamic wait-listed designs where schools are assigned to receive an intervention at randomly determined times (Brown et al., 2006). Finally, in a number of analytic approaches used by prevention methodologists that are derived from the fields of biostatistics, psychometrics, and the newly emerging ecometrics (Raudenbush and Sampson, 1999), there now exist ways to include characteristics of person and place in examining impact through time. There has been extensive methodologic work done to develop analytic models that focus on person, place, and time. For modeling variation across persons, we often use two broad classes of modeling. Regression modeling is used to assess the impact of observed covariates that are measured on individuals and contexts that are measured without error. Mixed effects modeling, random effects, latent variables, or latent classes are used when there is important measurement error, when there are unobserved variables or groupings, or when clustering in contexts produces intraclass correlation. For modeling the role of places or context, multilevel modeling or mixed modeling is commonly used. For models involving time, growth modeling is often used, although growth can be examined in a multilevel framework as well. While all these types of models—regression, random effects, latent variable, latent class, multilevel, mixed, and
S78
C.H. Brown et al. / Drug and Alcohol Dependence 95S (2008) S74–S104
growth modeling—have been developed somewhat separately from one another, the recent trend has been to integrate many of these perspectives. There is a growing overlap in the overall models that are available from these different perspectives (Brown et al., 2008; Gibbons et al., 1988), and direct correspondences between these approaches can often be made (Wang et al., 2005). Indeed, the newest versions of many well-known software packages in multilevel modeling (HLM, MLWin), mixed or random effect modeling (SAS, Splus, R, SuperMix), and latent variable and growth modeling (Mplus, Amos), provide routines that can replicate models from several of the other packages. Out of this new analytic integration come increased opportunities for examining complex research questions that are now being raised by our trials. In this paper, we provide a framework for carrying out such analyses with data from RFTs in the pursuit of answers to the three questions of who benefits, for how long, and under what conditions or contexts. In Section 2, we describe analytic and modeling issues to examine impact of individual and contextual effects on a single outcome measure. In this section, we deal with defining intent-to-treat analyses for multilevel trials, handling missing data, theoretical models of variation in impact, modeling and interpreting specific estimates as causal effects of the intervention, and methods for adjusting for different rates of assignment to the intervention. The first model we describe is a generalized linear mixed model (GLMM), which models a binary outcome using logistic regression and includes random effects as well. We conclude with a discussion of generalized additive mixed models, which represent the most integrative model in this class. Some of this section includes technical discussion of statistical issues; non-technical readers can skip these sections without losing the meaning by attending to the concluding sentences that describe the findings in less technical terms, as well as the examples and figures. In Section 3, we discuss methods to examine intervention impact on growth trajectories. We discuss representing intervention impact in our models with specific coefficients that can be tested. Because of their importance to examining the effects of prevention programs, growth mixture models are highlighted, and we provide a causal interpretation of these parameters as well as discuss a number of methods to examine model fit. Again, non-technical readers can skip the equations and attend to introductory statements that precede the technical discussions. Section 4 returns to the use of these analyses for testing impact and building theory. We also describe newer modeling techniques, called General Growth Mixture Models (GGMM), that are beginning to integrate the models described in Sections 2 and 3. 2. Using an RFT to determine who benefits from or is harmed by an intervention on a single outcome measure This question is centrally concerned with assessing intervention impact across a range of individual, group, and context level characteristics. We note first that population-based randomized preventive field trials have the flexibility of addressing this question much more broadly than do traditional clinicbased randomized trials where selection into the clinic makes
it hard to study variation in impact. With classic pharmaceutical randomized clinical trials (P-RCT’s), the most common type of controlled experiment in humans, there is a well accepted methodology for evaluating impact that began with the early pharmacotherapy trials conducted by A. B. Hill starting in the 1940s (Hill, 1962) and is now routinely used by pharmaceutical licensing agencies such as the U.S. Food and Drug Administration and similar agencies in Europe and elsewhere. The most important impact analysis for P-RCTs has been the so-called “intent-to-treat” (ITT) analysis, a set of rigid rules that determine (1) who is included in the analyses—the denominator—(2) how to classify subjects into intervention conditions, and (3) how to handle attrition. ITT is also intended to lead to a conservative estimate of intervention impact in the presence of partial adherence to a medication and partial dropout from the study during the follow-up period (Lachin, 2000; Lavori, 1992; Pocock, 1983; Tsiatis, 1990). These two sources of bias, called treatment dropout and study dropout (Kleinman et al., 1998), have direct analogues in RFTs as well (Brown and Liao, 1999). Detailed examination of how these two factors impact statistical inferences in RCTs have been done by others (Kleinman et al., 1998). In this paper, we use a minimum of technical language to examine first the accepted characteristics of ITT analyses for P-RCTs and then specify a new standard for multilevel RFTs directed at our interests in understanding variation of impact among individuals, places, and time. 2.1. Intent-to-treat analyses for pharmaceutical randomized controlled trials For standard clinic-based trials, ITT analyses define the denominator to include all those who have been randomly assigned, regardless of level of treatment received. ITT analyses specifically include those who agree to be randomized but then refuse to start on their assigned treatment. The often stated logic of making no exclusions based on post-assignment information, including treatment adherence, is that the alternative subgroup analyses that are formed by deleting subjects based on their adherence behavior after randomization could make the resulting treatment and control subjects unequal. Those who are failing to respond may leave treatment disproportionately more often compared to those who respond well or like the treatment (Kleinman et al., 1998; Tsiatis, 1990). Later, we will discuss this same principle in specifying ITT analysis of RFTs. Secondly, the denominator in ITT analyses in P-RCTs includes those who complete the study as well as those who drop out, cannot be located, or refuse to be interviewed at one or more follow-up times. This decision maintains the comparability of the treatment groups that were randomized at baseline. Other alternative choices of the denominator, e.g., limiting analyses to only those who have full follow-up, would lead to unequal treatment groups if, for example, those who died were excluded from the analysis. Indeed, if survival were higher in the treated group than in the control, then a comparison of the health status of survivors alone could easily lead to an erroneous conclusion
C.H. Brown et al. / Drug and Alcohol Dependence 95S (2008) S74–S104
that outcomes on a drug that saved lives were worse than those on placebo. The inclusion of all subjects in ITT analyses regardless of their follow-up status requires us to deal with the resulting missing data. For handling missing longitudinal data in ITT analyses, several approaches are used. The most common approach is the replacement of each subject’s missing data with his or her last non-missing observation, a method called last observation carried forward (LOCF). While LOCF is still the preferred method for handling longitudinal missing data when submitting drug studies to the FDA, this method is not only inefficient from a statistical point of view but also is known to introduce bias in estimates and their standard errors and at times to be misleadingly precise as well (Gibbons et al., 1988; Mazumdar et al., 1999). Most statisticians recommend against the use of LOCF (Little and Rubin, 1987; Little and Yau, 1996), and our recommendation for handling missing data in RFTs reflects this as well. A final specification about ITT analyses in P-RCTs is that treatment assignment is based on the originally assigned—intended—treatment, rather than the treatment actually received, regardless of whether the assigned medication or placebo actually was taken. There are both practical and statistical reasons for using this strict classification rule (Kleinman et al., 1998), which clearly attenuates the estimate of intervention impact when some subjects take little or no medication. The conservative nature of the ITT analysis is thought to be more in line with the effects one would actually see in a population that will not likely maintain perfect adherence. Alternative “as-treated” (AT) analyses that take into account actual treatment received, dosage, and selection factors are all subject to assumptions that often are not verifiable, and are thus used to supplement, not replace an ITT analysis (e.g., Jo, 2002; Jo and Muth´en, 2001; Wyman et al., in press). 2.2. Standards for intent-to-treat analyses for randomized field trials Intent-to-treat analyses in RFTs serve the same purpose as that for P-RCTs. They provide an objective method of conducting analyses of impact based on comparable groups of subjects across intervention condition without regard to post-assignment information such as the dosage actually received (see Kellam et al., 2008, for example). These ITT analyses are designed to provide conservative estimates of intervention impact and may be supplemented by other analyses that examine impact on individuals “as treated” or stratified by intervention adherence (e.g., Jo, 2002; Jo and Muth´en, 2001; Wyman et al., in press). In this section, we specify a new set of standards for conducting ITT analyses for multilevel RFTs. These standards address: (1) the denominator, or which subjects should be included or excluded in the ITT analysis; (2) how to assign subjects to the appropriate intervention group when there is mobility across intervention conditions; and (3) how to handle missing longitudinal data resulting from entrances, exits, and other reasons for missed assessments. Because an ITT analysis requires care in defining the appropriate individual level denominator, this has
S79
implications for trial design after the conclusion of the intervention period into the follow-up period (Brown and Liao, 1999; Brown et al., 2000). 2.2.1. Defining denominators for ITT analyses in grouprandomized field trials. In multilevel randomized trial designs, individuals are nested in contexts such as classrooms, schools, and/or neighborhoods. One or more of these higher levels also serve as units of assignment of the intervention. For example, the First Generation Baltimore Prevention Program trial, described in the second row of Table 1, involved 41 first-grade classrooms in 19 elementary schools (Brown et al., 2007a; Kellam et al., 2008). Thus, defining a denominator for an ITT analysis first requires defining which of these first-grade classrooms should be included in the analysis, then which students should be included based on their assignment to these classrooms. 2.2.1.1. Denominator at the level of randomization for ITT analyses. Because there will necessarily be a stated protocol for assigning units to intervention based on a randomization scheme, determining the appropriate denominator for groups where randomization occurs is relatively straight forward. The inclusion/exclusion criteria that are to be used for selecting units to be randomized and the procedure for randomization should be similar to the way a P-RCT would specify inclusion/exclusion criteria for individual subjects. We illustrate this using the First Generation BPP trial. In this trial, intervention assignment was at the level of the first-grade classroom, so we first review how classrooms and higher order nested units were selected prior to the initial randomization. Prior to starting this trial, we selected 19 elementary schools from five diverse urban areas in Baltimore City with the help of city planners and school administrators. Our goal was to ensure ethnic and social class diversity across schools, to ensure that we would have sufficient classrooms to permit balancing the intervention assignments in these schools, and to ensure that none of these schools would be closed, divided, or otherwise reorganized during the trial (Brown et al., 2007a; Kellam et al., 2008). Schools were also chosen so that they had either two or three first-grade classrooms. Inclusion-exclusion criteria for selecting the classrooms were specified in advance of the study. All classrooms in the selected schools were to be used unless a classroom was designated as a special education class. This exclusion was chosen since at most one such special education classroom per school would be available, and it would not be feasible to compare, say, an active intervention in one such classroom to a control non-special education classroom within the same school. In our group of 19 elementary schools, there happened to be no first-grade special education classrooms in any of these schools, so all of the available classrooms in these schools were used in our trial, a decision well suited to conducting ITT analyses. Children were assigned to classrooms/teachers using balanced assignment of first-grade students within school. Within designated schools, these classrooms/teachers were then randomly assigned to intervention condition or control condition. The design called for introducing at most one of the two interventions, either the Good Behavior Game or Mastery Learning (ML) within a school, because two
S80
C.H. Brown et al. / Drug and Alcohol Dependence 95S (2008) S74–S104
interventions in the same school would lead to logistics problems. Thus the 19 schools were randomly assigned to either test the GBG, to test ML, or to serve as a comparison school where neither of these interventions took place. We designated classrooms in these comparison schools, where no active intervention was to take place, as external control classrooms. Also, this design called for control classrooms within schools where each of the interventions was taking place, termed internal control classrooms. Thus, depending on the school, some classrooms received either the GBG or served as internal GBG controls, in other schools they either received ML or served as internal ML controls, and in some schools all first-grade classrooms served as external controls where no interventions took place (Kellam et al., 2008). The general ITT definition of denominator at the (classroom) level of intervention assignment is unequivocal. We include all units based on their intended assignment, regardless of whether the intervention ever took place in these classes. Thus if a classroom were assigned to the GBG but the teacher never performed the GBG or performed it poorly then the ITT analysis would still assign this classroom to the GBG condition. True to this definition, the GBG impact analyses in Kellam et al. (2008) and Poduska et al. (2008) were based on the combined GBG classrooms, the internal GBG control classrooms, all external control classrooms, and internal ML controls classrooms in the ML schools. Only the ML classrooms were excluded because they provided no information about the GBG impact nor could they be used as controls because of ML’s own potential impact. In Wilcox et al. (2008), ML classes were included since hypotheses about this intervention were also tested. In Petras et al. (2008) the GBG analyses were based on comparisons between the GBG classrooms and the internal GBG controls. 2.2.1.2. Denominator at the level of the individual in multilevel RFTs. Specifying the individual level denominator in an ITT analysis is more challenging due to individual level mobility and transfers. For example, multilevel RFTs often have late entrants to a school or other intervention setting whose entry occurs after the intervention period begins, and sometimes after the intervention period has ended. Thus a student who enters a classroom at the end of the school year will miss most of the intervention. Should all or some of these late entrants be included in ITT analyses? (This late entrance never occurs in PRCTs since treatment regimens all start upon entry.) Deciding which late entrants to include in an analysis can have an impact on the results of the trial (Mazumdar et al., 1999), as well as on the cost of the study during follow-up (Brown et al., 2000), so clarifying which individual level denominator to use is critically important. After classifying types of mobility, we present below two alternative choices for the individual level denominator in ITT analyses of RFTs, with different handling of late entrants into the study. The choice between these two methods should be determined by: (1) the risk that individuals who enter the study after the intervention begins may be assigned informatively to one of the interventions thereby causing nonequivalent intervention conditions and (2) consideration of whether to generalize
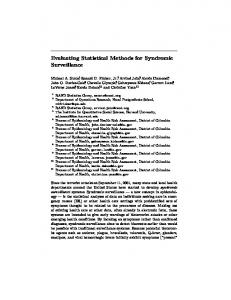
impact to include those who miss part of the intervention or have no baseline data. For some designs, the possibility of informative assignment of any participants to different interventions can be effectively ruled out. Consider, for example, a school-based randomized trial where public school enrollment is determined by a family’s residence in that school’s catchment area. Now consider evaluating a typical school-wide intervention for violence prevention in this district with schools randomly assigned to this intervention or control. Because school enrollment is determined by residence, there is likely to be minimal chance that a family would move into or out of a school’s catchment area due to the presence or absence of such a preventive intervention. Most often the families who migrate in after the school year begins would also not be aware of the school’s intervention status until they enrolled, therefore making their decision to enroll the child unrelated to the presence or absence of a particular intervention. By including in the analysis all students who were there at the beginning or soon after the intervention period began, we could be assured that random assignment of schools would lead to comparable student populations. It would not be appropriate, however, to include a student who enrolled on the last day of the school year, since this person has zero chance of receiving any useful amount of intervention. Thus a criterion should be established in advance to determine what minimal exposure period is acceptable. We note that it would typically not be appropriate to carry out an ITT analysis that excluded those who left the school or did not attend the intervention once the period of intervention began. Because these individuals had some exposure to their school’s intervention, it is conceivable that their non-attendance could be affected by the intervention itself, and therefore these individuals should be included in ITT analyses. This agrees with the traditional inclusion in ITT analyses of those who exit P-RCTs. Post-assignment analyses that do take into account exposure during the intervention period could, however, help understand intervention effects more fully than that provided by ITT analyses alone. The example above refers to school-based designs where neither the families’ nor the school system’s decisions regarding which students should attend which schools are based on what intervention conditions are available. However, for classroombased designs, there is a direct assignment of students into classrooms. Because some of these classrooms receive the intervention, it is possible that students could be assigned informatively in such designs. Important distinctions are presented in the general case and illustrated for the more complex classroombased design first, and then denominators for all of the six trials are presented in Section 2.2.2. For any multilevel trial, a schematic cross-classification of individuals based on their entrances and exits up to and during the intervention period, as well as any change in their intervention status, is provided in Fig. 1. We present five mutually exclusive entrance and exit categories consisting of completers, program dropouts, late entrants, program dropout/late entrants, and no shows. Table 2 describes these categories in the context of the First Generation Baltimore Prevention Program trial,
Any child who was registered to attend a study school during the summer before first grade, was assigned to a first-grade classroom but never attended the school.
Same definition through 1st Grade.
Same definition through 1st Grade.
Same definition through 1st Grade.
Same definition through 1st Grade.
Late entrant
Late entrant/program dropout No show
3
4
5
Program dropout 2
Any child who began attending first grade in one intervention condition and remained in one of the study classrooms to the end of second grade. Any child who began first grade in one intervention condition, was exposed to a portion of the intervention and moved outside the study’s classrooms prior to the end of the second year. Any child who transferred into one of the study’s first grade classrooms after intervention began and remained in one of the study classrooms through the end of the second year. A child who entered one of the study classrooms after the intervention began and moved outside the study’s classrooms prior to the end of the second year. No data available. Completer 1
1st Generation BPP Trial (intervention through 1st and 2nd Grades) Type
Table 2 Classification of individuals based on entrances and exits for the first and third Baltimore Prevention Program trials
3rd Generation BPP Whole Day (WD) Trial (intervention through 1st Grade)
C.H. Brown et al. / Drug and Alcohol Dependence 95S (2008) S74–S104
S81
Fig. 1. Classification of individuals based on entrances and exits.
which had a two-year intervention period (Kellam et al., 2008), as well as that for the ongoing Third Generation BPP trial with a one-year intervention period. In both of these Baltimore trials, program dropouts consist of those who enter at the beginning of the year but move out of their school before the end of the intervention period. Late entrants consist of those who come in to one of the study schools after the intervention period begins. Program dropouts/late entrants come in to a school after the intervention period has begun and move out before the end of the intervention period. In the Third BPP trial, no-shows are pre-registered in the previous summer to attend that school and randomly assigned to one of the classrooms prior to the start of the intervention but due to mobility never attend that school. Such children would provide no information about intervention impact. In this trial, it would be a complete waste of money and statistical efficiency to follow up these no-shows who had no exposure at all to the intervention. It would be important to check that the rate of no-show is similar across groups, something that would be quite likely given that this particular design randomly assigns children to intervention condition within schools. In the First Generation BPP trial, we have no information about no-shows since these records no longer exist. The First and Third BPP trials point out the two alternative definitions of which individuals to include in ITT analyses. In either case, our first priority with these denominator definitions is to make sure that there is equivalence across intervention conditions, in the face of potential treatment dropout as well as later in terms of study dropout (Kleinman et al., 1998). Successful random assignment of groups generally allows for balance across baseline covariates for those who are present prior to randomization (when significance testing accounts for intraclass correlation and group random assignment). However, as we will see below, it is possible with some designs for late entrants to be placed differentially in the intervention conditions, so their automatic inclusion in the denominator may lead to nonequivalence. The second priority is to include the largest number of subjects with baseline data in these definitions, since this increases power in discriminating both main effects and interactions involving baseline (Brown and Liao, 1999; Roy et al., 2007).
All subjects All subjects throughout intervention period
Larger sample size; generalizes to all subjects, including those who after intervention period begins
Impact likely attenuated by less intervention exposure of late entrants
When we do nothing in the design to assure late entrants will not be selected differently across intervention conditions When there is assurance that late entrants are not being selected differently across intervention conditions Limits sample size to those who enter at beginning of intervention period All subjects except those who are late entrants Prior to start of intervention period
Protects against subjects withdrawing differentially after being exposed to intervention
Weakness Strength Include in denominator Equivalent intervention arms
The two alternative denominator definitions are presented in Table 3. The first definition consists only of those individuals present at the beginning of the intervention period, in all those groups where random assignment to intervention is to take place. This automatically protects against late entrants being differentially placed in intervention or control conditions. Indeed, the data from the First Generation BPP trial suggest that principals were more likely to place late entrants in GBG classrooms, possibly because they felt that the late entrants would be more likely to be aggressive, disruptive and thereby would receive more intervention. To protect against this, in evaluating the Good Behavior Game in the First Generation BPP trial, the appropriate individual level denominator consists of all first graders who were assigned to any of the GBG classrooms and all controls, excluding late entrants and program dropouts/late entrants. Balance across intervention conditions is provided by randomization at the classroom level, as demonstrated by nonsignificant differences in baseline characteristics by intervention condition in multilevel models that account for the group level of randomization (i.e., Section 2.4 of Kellam et al., 2008). Because this denominator is formed from the population that is present before the intervention occurs, it is not subject to treatment dropout. Thus this denominator involving all those present at baseline is always appropriate for any trial in ITT analyses. In the First Generation BPP trial, this definition is used. The second definition of the individual level denominator, which is appropriate for some but not all trials, would include those entering the study during the intervention period. There are some RFT designs that do provide good assurance of no differential treatment drop-in, and therefore in these cases it would be appropriate to include late entrants and program dropouts/late entrants as well. We have already pointed out that in school-based designs late entrants are highly unlikely to be informatively choosing which school to attend. Thus it is possible to exclude or include late entrants in school-based trials and still maintain balance. It may be appropriate to include late entrants in some classroom and other designs as well. The Third Generation BPP trial is a good example of this. Unlike the first generation trial, this trial randomly allocates every child entering first grade in the 12 study schools to a classroom, using pre-sealed envelopes. A separate computer generated randomization is used to assign classrooms and their teacher to intervention condition. Our research protocol had us continue to assign children randomly to classrooms, even if they were late entrants, to ensure that the classes were balanced across the entire study. The only departure from this rule occurred if the classes within a school became too imbalanced due to differential rates of program dropout. Thus late entrant students were also balanced across intervention conditions, and they should therefore be included in the denominator, with a potential increase in statistical power. Comparing this case to the First BPP trial that was begun in 1985, in the earlier trial, we provided no protocol for incoming students, and therefore they were assigned by the principal in ways that may have used knowledge of which intervention was taking place in which classroom.
When to use
C.H. Brown et al. / Drug and Alcohol Dependence 95S (2008) S74–S104
Table 3 Comparison of two definitions of individual level denominators for ITT analyses in multilevel randomized field trials
S82
C.H. Brown et al. / Drug and Alcohol Dependence 95S (2008) S74–S104
For the other RFTs we have provided descriptions of denominators for ITT analyses in Table 1, Column 3. In the Rochester Resilience Program (RRP) (Row 1), which used individual level assignment of at-risk children blocked within schools, the ITT denominators consist of all children who were eligible, consented, and randomized, just as in a standard P-RCT. In the Georgia Gatekeeper Trial (GA Gatekeeper) (row 4 in Table 1), the most appropriate denominator to use consists of those present at the beginning of the school year. As with all school-based trials, the Georgia Gatekeeper research team had no influence over which students moved to different schools within the school year, and all these youth were exposed to that school’s intervention. Also, all schools in this study received the same gatekeeper training, with only the timing being randomly determined; therefore it was unlikely that any informative mobility occurred with regard to the intervention status. The denominators we used in our analyses were based on beginning year cross tabulations of numbers of subjects by gender, race/ethnicity, grade, and school because they were reported by the schools. Slightly more accurate denominators would have been based on population counts that had been averaged over the entire year, but such data were not available. In the Adolescent Substance Abuse Prevention Study (ASAPS) (row 5 in Table 1), the intervention was held in both seventh grade (middle school) and ninth grade during high school. In this design all middle schools that fed into the same high school received the same intervention as did the high school. High schools were also geographically separated from one another so there was relatively little chance that those who migrated out of one study school would enter another study school. Because this study randomized schools, and intervention status likely had no influence on entrance or exit from the schools, the choice of including or excluding late entrants would likely not affect the equivalency by intervention condition. The decision of who to include in ITT analyses was therefore made based on criteria other than balance. First, because of the importance of the seventh grade component to this intervention, the investigators’ primary interest was in examining impact on the population who were in study schools in seventh grade, not those who transferred in to schools by ninth grade. Secondly, because there was strong interest in understanding whether the intervention effect was different among those youth who were initially using or at high risk for using substances compared to those who were not, a decision was made to limit ITT analyses further to all those who had baseline data at the beginning of seventh grade. These priorities had the effect of excluding those late entrants who came in to the school after the start of the first intervention in seventh grade. Finally, in the California multidimensional treatment foster care (MTFC) trial (row 6 in Table 1), two different methods are being tested for implementing MTFC in California counties. Inclusion/exclusion criteria have been specified for determining which counties are to be randomized these two conditions. The primary outcomes relate to the time it takes for a county to begin placing families in MTFC. As for units lower in level than the county, system leaders, agency directors, and practitioners are assessed both prior to and through the intervention period.
S83
Changes in their responses on climate and attitudes are considered outcomes, and the composite is evaluated formally by intervention condition. These leaders, directors, and practioners are sampled systematically across the two conditions and across time. For ITT analyses, the late entrant individuals are included because of the high turnover in these positions over time, and these new individuals would need to be included to fully assess climate and culture. We also consider staff turnover as an outcome in its own right. Units in two other levels lower than county depend heavily on the success of program implementation, and are therefore evaluated in post-intervention analyses rather than ITT analyses. These include the selection of mental health agencies within counties to be trained to deliver MTFC, and the recruitment of new foster parents who are willing to be part of a treatment team to deliver a set of integrated services to youngsters with severe emotional and behavioral problems. Both of these selections occur as part of the implementation process. Because the recruitment of foster parents is different from that involving other types of foster care, and the primary focus is on the county and the agency, no formal ITT analyses of impact are likely to be done at the level of the foster care families; instead ITT analyses are being done at the level of the county and agency. 2.2.2. Defining individual level intervention condition and exposure in multilevel RFTs. In the previous section, we have specified ways to determine whether late entrant individuals should be included in the denominator of an ITT analysis. This section presents rules for assigning the intervention condition to subjects whose intervention exposure changes because of mobility. Along this second dimension of exposure to the intervention condition, each subject can be assessed on whether he or she received more or less intervention than planned, and whether the assignment of the child to an intervention adhered to the research protocol or not. These classifications are provided in Table 4, and we apply them to the Third Generation Baltimore Prevention Program Trial involving the Whole Day intervention. Children could have been exposed to less than the intended one year of intervention—which we have labeled intervention transfers, or more than the intended school year—which occurs if someone is a repeater, since sequential cohorts of children were given the same intervention in this study. In addition, we assessed whether the youth attended the intervention condition that was intended by the group-based randomization schedule or whether he or she received another condition, in which case we would identify this as a research protocol violation. Also, we identified the intervention of first exposure based on the first contact that child had with either of the intervention conditions. For ITT analyses, individual intervention assignment should be based on the intended assignment if the assignment of individuals is to the intervention or to a group that itself is randomly assigned to an intervention. Furthermore, no one should be excluded because they received less than, or greater than the intended amount of intervention. Therefore, in the Rochester Resilience Project, the designated random assignment of the intervention condition should be used even if this particular intervention is not delivered to that individual. For the two BPP
Intended intervention assignment
Intervention of first exposure
C.
D.
This is the intervention condition to which the child is initially exposed upon entry to the study.
Any child who is placed in or removed from an intervention condition that was not intended by the planned research design results in an assignment protocol violation, and these should be reported as part of the CONSORT report.
No protocol violation if done administratively by the school and the intervention condition is maintained. Repeater B.
Any child who began first grade in one classroom and then moved or was otherwise assigned to another classroom. With a different intervention. It may be advantageous for some analyses to calculate the timing and length of exposure to each of the interventions. Any child who began first grade in one of the study classrooms, then was held back or otherwise repeated first grade in one of the study schools—and therefore repeated exposure to the intervention. For repeaters, the intervention should be the same as in the previous year. The classroom assignment designed by the research staff. In this WD trial, all classroom assignments were to be based on a sealed, sequential list of classroom assignments within school as children entered first grade throughout the year. Intervention transfer A
Description Type
Table 4 Characteristics based on intervention exposure with examples from the third Baltimore Prevention Program whole day (WD) trial
No protocol violation if done for school administrative purposes.
C.H. Brown et al. / Drug and Alcohol Dependence 95S (2008) S74–S104
Research protocol violation
S84
trials, the intended intervention assignment is determined by the assigned first-grade classroom. If there is no formal assignment of individuals, the intervention of first exposure is used to define each individual’s intervention condition. Using this rule, repeaters should be classified by their first intervention condition, even if they happen to be re-randomized to an intervention in the following cohort. Another example of this first exposure rule occurs in the Adolescent Substance Abuse Prevention Study, a school-based intervention trial. Here the school first attended during seventh grade determines the intervention status, regardless of their intervention status during the ninth grade intervention. These definitions naturally avoid any possibilities that a good or bad intervention experience could affect how a subject’s intervention classification. This rule also corresponds closely to that used in P-RCTs. The Georgia Gatekeeper trial, which randomizes when schools get trained (Brown et al., 2006), deliberately changes intervention status at random times. As a consequence, we have had to adapt our ITT rule for classifying individual level intervention assignment accordingly. In this trial, the goal is to evaluate how many youths are referred for suicidality from schools where training has or has not occurred, over the three years when the trial took place. Schools were randomly assigned to when the training of the staff would occur. Because of confidentiality issues, we did not obtain any individual level identifiers; instead the referred youth were only identified by date of referral, school, grade, gender, and race/ethnicity. As we described above, the school district supplied overall numbers of youth at the beginning of each of the three years in each school’s grade, gender, and race/ethnicity cross-classification, and these were used to compute rates of referral for each, school, grade, gender, and race/ethnicity, and intervention status determined by the times that training of each school began. Without the ability to identify referred youth, we do not know if a referred youth had recently been in another school, so from a practical standpoint, all referrals for suicidality were assigned to the school where that referral took place, and assigned to condition depending on whether that school had already been trained or not as of that date. It is possible, although unlikely, that a referred youth in one school had recently moved from a school with a different training condition, and that a staff member from the former school had belatedly referred this student. If we had complete data, we would prefer to conduct ITT analyses by classifying where each child was at the beginning of each new training period, rather than the school attended at the time of referral. Thus our assignment of intervention status by current school, rather than initial school, for any mobile youth who was referred for suicidality, goes against our rule for classifying subjects to intervention condition in ITT analyses. In this way it is not a perfect ITT analysis, and this should be stated in publications. In the Georgia Gatekeeper trial, we also followed up a stratified random sample of school staff from these same schools in Georgia in order to assess how gatekeeper training affected their knowledge, attitudes, and behaviors related to referring suicidal youth (Wyman et al., in press). Some of the staff, just like the students, moved during the study from a school in one training arm to a school in the other training condition. For ITT analyses,
C.H. Brown et al. / Drug and Alcohol Dependence 95S (2008) S74–S104
we coded these mobile school staff as belonging to the school where they first worked, a definition that is completely defensible but ignores whether or not that particular staff member was in fact trained (approximately three-quarters of staff per school were trained). Results from these ITT analyses on changes in assessments of staff could then be compared to results from “as-treated” analyses. In these “as-treated” analyses, the intervention condition for staff was the actual training condition they received, and in multilevel analyses their assignment to school was based on the most recent school where they were employed, not the first one. As expected, the ITT impact analyses showed somewhat smaller training effects than those in the “as-treated” analyses. 2.2.3. Practical issues in determining individual level denominator. From a practical point of view, the exact definition of the denominator will need to be based on the available data; rarely will complete tracking data be available to identify each child’s full entrance and exit history. Besides the cost involved in tracking individuals, the cost of obtaining consent can lead to practical choices affecting the denominator. It is often impractical to continue obtaining parental informed consent and a minor’s assent to participate in the study once the intervention has begun, so late entrants may need to be excluded based on this lack of informed consent. In the First BPP trial, we selected as our denominator those on the up-to-date class lists at the time of the baseline teacher ratings, 8–10 weeks into first grade just prior to the start of the intervention. This criterion thus excluded those who came in after the intervention period began—the late entrants—but potentially could also have included a few individuals who entered after the baseline data were collected but before the intervention began. This definition of the denominator based on class lists at baseline also had the practical advantage of minimizing the amount of missing data at baseline. In the Third Generation BPP trial, it is illustrative to follow how we handled three students. Student 1 was enrolled in one of the twelve schools at the beginning of the school year and randomized to a classroom that would later receive the Whole Day (WD) intervention. The student transferred to another school before the intervention began, equivalent to a “no-show.” We thus excluded this individual from analyses. Student 2 enrolled into a study school in the final month of the school year and was randomly assigned to a treatment condition; however, she was exposed to that treatment condition for only three weeks. Because this trial continued to randomly assign children to classrooms, we chose to include this late entrant in our ITT analyses despite the limited intervention exposure. Finally, also in the final month of the school year, Student 3 was administratively moved from a standard setting classroom into the WD classroom in violation of random assignment, but in keeping with the school’s procedures for addressing student behavioral issues. This would be a research protocol violation even though it follows school protocol. We would include this subject and continue ITT analyses that assign this individual to control, the first intervention received.
S85
2.2.4. Handling missing data in ITT analyses in multilevel RFTs. Missing data can arise at any level of analysis, but it typically occurs at the individual level where the different entrances and exits, missed assessments in a longitudinal design, and refusals to answer certain questions create varying patterns of incomplete data. One simple method that has been used to handle incomplete data is to remove any cases with missing data on any variable used in an analysis; however, this method uses postintervention information to define who should be in the analysis, which is inappropriate for ITT analyses. It can also produce distorted inferences if subjects are attrited differentially based on the intervention condition. Two acceptable methods of handling missing data for ITT analyses are the full information maximum likelihood method (FIML); (Little and Rubin, 1987), and multiple imputation (Rubin, 1987, 1996; Schafer, 1997; Schafer and Graham, 2002). FIML estimates are computed by maximizing the likelihood based on the variables observed for each case, assuming that the data are missing at random (Rubin, 1976), sometimes averaging over covariates that predict missingness (Baker et al., 2006). Multiple imputation forms a set of complete datasets based on an imputation model, then uses an analytic model to assess intervention effects on each of the completed datasets. The imputation model used to replace the missing data should always be at least as complex as the analytic model used to examine intervention impact (Collins et al., 2001; Graham et al., 2006, 2007; Schafer, 1997, 1999; Schafer and Graham, 2002). For both the FIML and multiple imputation methods, the computations are based on an assumption of missing at random (Rubin, 1976; extensions for each method are, however, possible but less often used). This technical condition of missing at random holds either when the data are missing as if someone wiped off some data without regard to any of the values—or more generally when missingness of a datum is allowed to depend on other variables that are observed, but not allowed to depend on any of the unobserved variables. An illustrative example of this more general case of missing at random is a two-stage follow-up study. Often used in psychiatric epidemiologic studies to provide cost-effective prevalence estimates, this type of planned missingness design is also appropriate for evaluating intervention impact—as well as variation in impact—on a diagnostic measure. Such a two-stage design was used in the First Generation BPP trial, and here we demonstrate the use of FIML to assess two aspects of the GBG impact on DSM diagnosis of Conduct Disorder (CD) by sixth grade using the Diagnostic Interview Schedule for Children (DISC 2.3-C; Fisher et al., 1992). The entire sample of first graders who remained in Baltimore City schools by sixth grade was assessed with an inexpensive screening instrument that contained a short list of CD items. All of those children who said yes to three or more questions were considered screen positive. All of these screen positives, plus a random sample of screen negative children irrespective of intervention condition, were then given a full DISC assessment of CD. The number of screen negative children that were given this second level assessment was somewhat less than the number of screen positive children. Overall, well over half of children in the sample were missing on the more
S86
C.H. Brown et al. / Drug and Alcohol Dependence 95S (2008) S74–S104
Table 5 Estimates of screening status by DISC diagnosis of sixth grade males exposed to good behavior game or internal GBG control conditions Screen\DISC status
GBG (N = 53, 7 screened positive, 46 screened negative, 44 not assessed on DISC Internal GBG control (N = 30, 11 screened positive, 19 screened negative, 18 not assessed)
Received DISC assessment
Did not receive DISC assessment
DISC-CD positive
DISC-CD negative
DISC-CD positive
DISC-CD negative
Positive screen
1
6
0
0
Negative screen
0
2
44 × p0
44 × (1 − p0 )
Positive
5
6
0
0
Negative
0
1
18 × p0
18 × (1 − p0 )
Note: DISC = diagnostic interview schedule for children.
expensive DISC assessment, yet accurate estimates of DISC-CD diagnoses can still be made because the reasons for missingness are completely known. By dealing with these data that are missing by design, the population proportions of both the GBG and control exposed subjects meeting diagnostic criteria could be computed using FIML methods. What follows is a standard FIML analysis that compares the overall rates of DISC CD diagnoses for the GBG and internal GBG controls for males in the first cohort. Table 5 collapses the results of a four-way tabulation of individuals by intervention condition, screen status, status on a DISC-CD diagnosis, and whether or not the youth was selected to receive the DISC. The whole numbers in the table refer to the numbers of subjects observed in this cross classification. Thus in the first row of data, one GBG exposed male received a positive DISC diagnosis after being screened positive, and six received a negative DISC diagnosis after being screened positive. Also on this same row, there were no GBG screened positive males who were not assessed on the DISC. This is because all those who were screened positive are assessed on the DISC so there are no missing DISC data for these individuals. Note that the first two columns of cell counts correspond to the numbers of males who received both the screen and the DISC, while the remaining two columns correspond to both observed and estimated cell counts for those who were not chosen to receive the DISC. There were 44 (=53-1-6-0-2) GBG males who were screened negative who did not receive the DISC, and similarly there were 18 (=30-5-6-0-1) internal GBG controls who were both screened negative and not selected for the DISC. We expect the same proportion of these non-assessed, screened negative males (p0 ) to be DISC-CD positive for GBG and internal GBG control males, since the assessment was blind to intervention condition. Our best estimate of p0 based on both cohorts was 2/27 = 0.069; this is the observed proportion of screened positive males who were found to be DISC positive. This maximum likelihood value has been used in Table 5 to obtain the
expected number of DISC-CD positive males in each condition by collapsing across the two tables where the DISC was taken and where it was not taken. Standard errors (in parentheses in the last column) as well as the correlation among these estimates (not shown) are computed based on the Delta method. A formal test of equivalence in CD prevalence by intervention condition using these data above was rejected. There were significantly lower odds for GBG exposed males compared to the internal GBG control males (OR = 0.31, 95% CI = 0.10, 0.95). Thus overall reduction in CD in the GBG condition is evident by grade six, preceding the result we report on reduction in adult antisocial personality disorder diagnoses (ASPD) among the first grade aggressive, disruptive males (Petras et al., 2008). This makes sense because conduct disorder during adolescence is a requirement for an adult ASPD diagnosis. These findings were also similar to that for adult diagnostic outcomes (Kellam et al., 2008), where GBG exposed children in the first cohort had substantially reduced drug abuse/dependence disorder diagnoses. These findings on CD were not replicated in the second cohort where less impact was generally seen. Multiple imputation (MI) can also be used to handle missing data by replacing missing observations based on an imputation model with multiple versions of a complete dataset. These complete datasets are then analyzed using standard statistical methods, and inferences on such statistics as the odds ratio for GBG versus internal GBG control DISC diagnoses, are made by accounting for two sources of variation: the average standard errors of the odds ratios (within variation) and the variation in these odds ratios across the multiple imputations standard errors (between variation). Confidence intervals can also be formed according to Rubin (1987, 1996) and Schafer (1997, 1999). MI has some advantages over FIML since it can use this additional information to impute values from a large number of observed extra variables that never appear in the final analysis. FIML can also be used with a modest number of extra variables, collapsing over those not used in the final model as we did in Table 6.
Table 6 FIML estimates of the relation between intervention and DISC conduct disorder diagnoses in sixth grade Intervention
Estimated numbers with DISC-CD positive
Proportion DISC-CD positive (standard error)
GBG (N = 53) Internal GBG Control (N = 30)
1 + 0 + 0 + 44 × p0 = 4.03 5 + 0 + 0 + 18 × p0 = 6.24
0.076 (=4.03/53) (0.032) 0.208 (=6.24/30) (0.170)
C.H. Brown et al. / Drug and Alcohol Dependence 95S (2008) S74–S104
As an example of how MI can be used in ITT analyses, we refer back to the GBG impact analyses of on adult drug dependence/abuse diagnoses, taking into account the baseline levels of aggressive, disruptive behavior in first grade on this outcome (Kellam et al., 2008). There were some missing data on both the first grade aggressive, disruptive behavior measure as well as the distal outcome; intervention status was available for everyone. FIML analyses of intervention impact in this particular case would typically ignore any missing data on either baseline or outcome (Brown, 1993b). However, the imputation model can use additional information on other variables measured across the study to help assess intervention impact. In our analyses reported in Kellam et al. (2008), we included self-report measures of depressive symptoms in the imputation model and concluded that the effect was stronger using multiple imputation compared to the traditional FIML model. We also note that a small number of imputations, say three to five, can often provide enough complete datasets to provide good quality inferences about intervention impact (Rubin, 1987). Recently, there have been recommendations for using an order of magnitude more imputations in complex, large datasets with many variables used for imputation (Graham et al., 2007). The larger number of imputations is of direct value when making confidence intervals for examining variation in impact as well. As a final point of comparison, some individuals may be measured at baseline but may be completely lost to follow-up and have no measures taken beyond baseline. With FIML, such individuals contribute nothing to the likelihood and therefore are effectively excluded from analyses. With MI, these individuals contribute a small amount of information based on their baseline data; their effects on the final inferences are generally small. 2.3. Modeling strategies to examine who benefits or is harmed in ITT analyses With ITT procedures now defined, we can proceed to discuss analytic strategies for examining impact in such trials. Such methods have evolved from simple comparisons of proportions, as with the CD analyses above, to adjusted means in analysis of covariance, to methods that incorporate nonlinear modeling (Brown, 1993b; Hastie and Tibshirani, 1990), growth modeling (Muth´en, 1997, 2003, 2004; Muth´en and Curran, 1997; Muth´en and Shedden, 1999; Muth´en et al., 2002) and multilevel modeling (Gibbons et al., 1988; Goldstein, 2003; Hedeker and Gibbons, 1994; Raudenbush, 1997; Raudenbush and Bryk, 2002; Raudenbush and Liu, 2000). Since a recent listing of such methods and their use in the BPP First generation trial is available elsewhere (Brown et al., 2008), we highlight only a few novel applications for RFTs in this paper. Our presentation begins with examining impact for a single follow-up time and initially treats the multiple levels in the design as nuisance factors. We describe the use of such methods on the First BPP trial where we examine impact on drug abuse/dependence disorder diagnoses (Kellam et al., 2008). The five other trials that were described earlier (Table 1) are used to illustrate how generalizable these methods are across a wide set of trials.
S87
2.3.1. Theoretical models of variation in impact by baseline individual level risk characteristics. In P-RCTs the ITT analysis has traditionally been focused on examining main effects of the intervention (Friedman et al., 1998; see, however, Kraemer et al., 2002). Unless there is an a priori reason to hypothesize an intervention that interacts with baseline, the standard approach in P-RCTs has been to avoid testing for variation. This practice is conservative because one will never find any real or spurious variations in impact if one does not look for them. However, theoretically driven hypotheses can be examined through subgroup analyses in randomized trials. As an example, because of random assignment within a trial, control males and treated males should be equivalent at baseline, and their responses can be legitimately compared, as can those for females or other important subgroups. One reason to search for variation is to personalize or tailor treatments to maximize impact among different subgroups (Rush et al., 2006), but this is a relatively new development. For most P-RCTs trials, the sample is deliberately chosen to be homogeneous, leading to limited variance in baseline characteristics, and consequently there is often little statistical power available to examine such interactions between baseline and intervention. In RFTs, particularly those based on universal preventive interventions, there is almost always an a priori reason to examine interactions involving intervention and baseline level of risk. Many of these interventions are designed to modify one or more risk factor that is measured at baseline, and they are expected to be successful only through the modification of these risk factors. In addition, in group-based randomized trials, statistical power is much more heavily dependent on the number of groups rather than the individuals, so subgroup analyses and tests of interactions often do not suffer from poor statistical power the way they do in individually-based trials (Brown and Liao, 1999; Raudenbush and Liu, 2000). We take as our first example the variation in impact we would expect to see in the First Generation BPP trial. The Good Behavior Game was designed to reduce aggressive, disruptive behavior. Because roughly half the children have minimal levels of aggressive, disruptive behavior on entry into first grade and also throughout childhood (Muth´en et al., 2002), we predict that the GBG would have little or no effect on these children. For those with aggressive, disruptive behavior at baseline, many are expected to remain aggressive, disruptive in the absence of intervention (Moffitt, 1993; Moffitt and Caspi, 2001; Muth´en et al., 2002), so for these high risk aggressive, disruptive children, we would predict that an effective intervention would show high impact. In terms of ITT analyses, these predictions can be tested by measuring the significance of interactions involving baseline aggressive, disruptive behavior and intervention. There are other reasons for examining interactions between intervention condition and individual level baseline risk. For some individuals, an intervention may be harmful while it may be beneficial for others. In the Second Generation BPP trial, we tested a mathematics curriculum intervention for first graders. Overall it improved math achievement, but when we examined impact as a function of first grade baseline achievement, we
S88
C.H. Brown et al. / Drug and Alcohol Dependence 95S (2008) S74–S104
found that it worked well for those with initially high achievement and was actually harmful for those who began with low levels of achievement (Ialongo et al., 1999). Videotapes of the intervention pointed to lower engagement with lower achieving children compared to high achieving children. Because of this disadvantage to less achieving youth, this intervention was not continued. Variation by individual level risk is also important in selective and indicated interventions, especially as this can help determine an optimal cutoff in risk below which an intervention has limited effect (Tein et al., 2004). Alternatively, we may decide to modify an intervention so that its impact is improved over a wider range of risk. While we have so far emphasized interactions involving risk measured at the individual level, such interactions can and often do extend to systems or contexts that are unique to the individual in a trial. That is, in a classroom-based trial, family environments of the subjects will have minimal overlap, but school and neighborhood environments may be partially or completely shared. Clearly, our ability to detect variation in impact across family, school, and neighborhood environments will depend on the degree of overlap. If there is no overlap, or minimal overlap across subjects, then a contextual level variable can be included in an analysis as an individual level variable. Thus in the First Generation BPP trial, family poverty status, measured by reduced or free lunch, acts as an individual level variable. This poverty index was found to contribute to the course of aggressive, disruptive behavior in the First Generation BPP trial, but the GBG succeeded equally with children in impoverished families and those with somewhat higher incomes (Kellam et al., 1998). 2.3.2. Theorizing variation in impact involving levels that are partially or completely shared. Randomized field trials with multilevel designs provide opportunities to examine variation not only by individual baseline characteristics, but by characteristics at higher levels, including those where the intervention assignment occurs and higher levels as well. Returning to the classroom-based First Generation BPP trial, we would expect impact to be low if the classroom began the year with an overall low average aggressive, disruptive score. At the other end, we would expect the impact to be potentially high in classrooms that started with high classroom average levels of aggressive, disruptive behavior. Only in these classrooms where a teacher has difficulty managing her class would there be a strong potential for the intervention to make an impact. All students in the classroom would share these teacher characteristics, although some children may be affected more than others. Recall that in the First BPP trial children were balanced across classrooms within a school based on kindergarten performance. One might expect that this balanced assignment of children to classes within school that was carried out by this First BPP trial design (Kellam et al., 2008; Brown et al., 2006) would lead to nearly identical levels of classroom average aggressive, disruptive behavior within schools, and therefore we would have no ability to examine variation in impact by classroom average aggressive, disruptive behavior level once we blocked by school.
However, this is not the case. After adjusting for school, we found significant classroom level variation in the average aggressive, disruptive score within classrooms early on in the school year before the intervention began, but there were no differences in this contextual level of aggressive, disruptive behavior by intervention condition (Kellam et al., 2008). In contrast to this varying level of classroom average aggressive, disruptive behavior, there was no significant classroom variation in classroom averages of achievement or family poverty; an additional source of classroom variation was occurring that affected the levels of child aggressive, disruptive behavior. Our working hypothesis that came out of these baseline multilevel analyses was that we did successfully balance children into classrooms on achievement and a poverty index, but the level of aggressive, disruptive behavior seen in classrooms was heavily influenced by the teacher’s ability to manage his or her classroom. About half the teachers were successful in managing classroom aggressive, disruptive behavior at baseline, while the other half were unsuccessful (Kellam et al., 1991, 1998). We would therefore predict that the GBG would have its highest effect in classrooms where the baseline level of aggressive, disruptive behavior was high, strongly suggesting that the teacher had limited ability to manage his or her classroom. The GBG’s effect would be low in well managed classrooms. Furthermore, we would predict that the GBG’s highest impact would be for the most aggressive, disruptive children in the most aggressive, disruptive classrooms, a three-way interaction. We tested for this three-way effect in previous analyses, and found this estimated effect was in the expected direction, but was non-significant (Kellam et al., 1998). Not surprisingly, the power for this three-level interaction was rather modest. Intervention effects may vary as a function of neighborhood of residence and other contexts that are partly shared across these classrooms. While there have been several examinations of neighborhood effects on child development (Aber et al., 1997; Brooks-Gunn et al., 1993; Pickett and Pearl, 2001; Plybon and Kliewer, 2001), to date little attention has been placed on its moderating effect on a preventive intervention. The methodology is available, however, to address such questions. Interactions between baseline and intervention conditions have been hypothesized for the other trials that we have included in Table 1 as well. For the Rochester Resilience Project (Row 1), we hypothesized that the intervention effect would vary as a function of classroom context, with higher impact when the proportion of children in the classroom were maladapting. In the Third Generation BPP trial (Row 3), we elaborated on the model developed for the First Generation trial. The prediction is that intervention impact would be expected to be greatest on children who were aggressive, disruptive or poor learners at baseline in classrooms where the teacher had low management skills and had limited effectiveness in teaching reading. In the Georgia Gatekeeper Project (row 4), we hypothesized that QPR training would be more effective in referring suicidal youth in middle school compared to high school, both because of elevated suicidality in middle school but also closer contact with school staff for these younger children. In the ASAPS school-based trial to prevent drug use (row 5), we anticipated variation in impact by
C.H. Brown et al. / Drug and Alcohol Dependence 95S (2008) S74–S104
individual level of risk regarding attitudes and usage of drugs as well as low bonding to school in seventh grade. We also predicted that in schools where the school-level norms regarding use of drugs were high at baseline, the intervention effect would be larger since that was one of the targets of the intervention. Finally, in the California MTFC trial (row 6), we anticipate there may be differences in impact for rural versus urban counties, as well as those counties that have a history of interagency collaboration. We have specified important baseline by intervention interactions in each of these trials based on theory. In the next section we examine how inferences about overall intervention impact as well as variation in impact can be drawn from analytic models that may be imperfectly specified. 2.4. Causal inferences regarding overall impact and variation in impact for RFTs All ITT analyses of intervention impact involve a comparison of responses among those assigned to the intervention compared to those assigned to another (control) condition. This comparison may be simple, for example, a difference in observed means for each group. The comparison could also involve complex, sophisticated models with random effects, covariates, and interaction terms that are linearly or nonparametrically related to outcomes, whose outcomes themselves may have normal, binomial, count, or time to event distributions (Brown et al., 2007d; Kellam et al., 2008). Statistical inferences derived from these models are then used to infer causal effects due to the intervention. Random assignment helps considerably in strengthening these causal inferences about the intervention, but most trials use random assignment at only one level. It is not immediately clear whether statistical inferences about parameters measuring variation in impact across different levels of a trial have causal interpretations, nor is it clear whether our causal inferences remain valid if we fail to specify all the appropriate covariates in our model. Such fundamental questions of causal inference have been partially answered through advances in causal modeling. These advances include the Neyman, Rubin, Holland (NRH) approach involving potential outcomes or counterfactuals of the primary outcome (Holland, 1986; Neyman, 1923; Rubin, 1974, 1978) and a principal stratification approach involving intermediary outcomes, such as participation or adherence as well (Angrist et al., 1996; Frangakis and Rubin, 1999, 2002; Jo, 2002; Jo and Muth´en, 2001). In this paper involving ITT analyses, the NRH approach allows us to obtain some general rules on when the statistical models provide valid causal inferences. For postassignment analyses that we have not included in this ITT paper, we would need to rely on principal stratification as well. 2.5. Assignment adjusted analyses to improve inferences of intervention impact Making correct inferences about intervention impact requires us to include in our model the right covariate terms involving the intervention. Thus if the intervention effect varies by baseline levels of risk, the model should include an intervention by base-
S89
line covariate along with intervention itself. Without these terms in the model, we cannot expect to make correct inferences about the intervention’s full impact. A more troubling issue, however, is whether our conclusions about an intervention’s variation in impact depend on whether we build a model that includes all important covariates, even ones at the individual level that do not include intervention condition. If our inferences about intervention impact did require us to include all important individual level covariates in our analysis, then our inferences from a best-fitting model could be suspect. This section describes a general procedure called assignment adjusted analysis that automatically protects our inferences in RFTs against some missing covariates. For trials that randomize at the individual level, it is well known that randomization protects inferences of overall intervention impact in case we have an incomplete model. We may be missing an important individual level covariate, but randomization provides balance across this missing covariate. The situation is not exactly the same in trials that are randomized at the group rather than individual level, but there is a relatively simple method that can provide this additional stability in these estimates of intervention impact even if we ignore or do not have available some important predictors. In this section we provide a method that produces accurate estimates of intervention impact even if the underlying model is not specified completely. To study the properties of these estimates, we distinguish between a NRH causal model involving possible outcomes that describes how each subject’s outcome, if assigned to the control condition, would depend on individual level and higher level covariates (Brown et al., 2007b). The causal model would further specify how each individual’s outcome, if assigned to the active intervention condition, would depend on additional individual level and higher level covariates as well. The causal effect for each individual is then defined as the difference in the outcome under active intervention and control conditions. These causal effects contain the true parameters that represent intervention impact. If the causal effect is just a simple constant difference between intervention and control, then the only intervention effect is a main effect. If the causal effects vary as a function of a covariate, then the intervention effect interacts with that covariate. Because we can never know the true causal model for the data, we can only evaluate intervention impact on a hypothesized multilevel model that specifies how each subject’s outcome depends on their intervention status, covariates, and interactions, as well as error terms accounting for individual and shared variances. There are three important possibilities to study; this hypothesized model, evaluated for those who are included in the study and under the random assignment mechanisms, may be: (1) exactly correct; (2) it may be overly inclusive by containing more covariates than the true model; or (3) it may be under inclusive of the true covariates or interactions affecting outcomes. Theoretical developments have shown that under mild assumptions about the models and the ways that individuals and higher level units are selected and assigned to the intervention conditions, hypothesized models that are exactly correct or over specified will yield unbiased estimates of all the intervention effects. If the hypoth-
S90
C.H. Brown et al. / Drug and Alcohol Dependence 95S (2008) S74–S104
esized model is underspecified, inferences about intervention effect can be erroneous. Some estimates of intervention effect perform well when subjects are weighted inversely in proportion to the probability of intervention assignment (Rosenbaum, 1987), but this is not necessarily the best approach when examining variation in impact. It is always possible, however, to add some simple covariates in an underspecified model and thereby produce an asymptotically unbiased estimation of intervention impact, even when some of the covariate predictors are not in the hypothesized model. We call this procedure assignment adjusted analyses (Brown et al., 2007b). Specifically, we first calculate the proportion of groups in each block that are randomly chosen to receive the intervention. If this block level “propensity” measure is constant, that is, the proportion of groups in each block receiving the intervention is the same, then the model is robust against under specifying the covariates. That is, even when important covariates at any level that do not involve the intervention condition are not included in the analysis, the overall impact estimates remain unbiased. Only in the case where these propensities are not constant is there any benefit to making an adjustment. The adjustment is straightforward (Brown et al., 2007b): simply add new covariates to the model corresponding to the propensity score variable itself and the product of any covariate that interacts with intervention assignment. Thus if only a main effect of intervention is being examined (Tx = 1 if active intervention, Tx = 0 for control) for its effect on a continuous outcome, one would include in a linear mixed model (LMM) analysis a new covariate π, corresponding to the proportion of the groups assigned to active intervention within each block. For example, in a classroombased randomized trial, if two of the three classes in a school (that is, the blocking factor) were assigned to active intervention, then π = 2/3 for every individual subject in this school. This covariate π is a true propensity score, but unlike traditional propensity score analyses (Rosenbaum, 1987), it need not be estimated from a model but rather it is obtained from the numbers of units that are actually assigned to the active intervention within each block. We now describe the assignment adjusted model that is necessary when more complex baseline by intervention interactions are added to the model. If a main effect of intervention Tx is
included as well as an interaction of this intervention condition times a covariate X, Tx × X, then we would add into our analysis both the propensity score covariate π and the interaction term π × X. Two examples from the First Generation BPP trial are presented below followed by a more general rule for incorporating model robustness. In this RFT trial, level one corresponds to individuals, level two corresponds to classrooms, and level three corresponds to schools (which were further nested into geographic areas of the city). Furthermore, the two outcomes we examine are binary, so generalized linear mixed models, which is logistic regression with random effects, is used instead of LMM. First, we present the impact of the Good Behavior Game on lifetime drug abuse/dependence disorders by age 19–21 as described in Kellam et al. (2008). In the generalized linear mixed effects model analysis presented in Table 7 for males, which adjusts for classroom variation and baseline aggressive, disruptive behavior ratings from first-grade teachers, the reduction in lifetime drug abuse/dependence disorders for GBG compared with internal GBG controls was large and significant, with a log odds ratio (OR) of 0.999 (p = 0.035) as shown in the third row of Table 7. This magnitude corresponds to an approximately 2.7 times greater risk of drug abuse/dependence disorders in the internal GBG controls compared with the GBG. In contrast to this significant difference between the GBG and internal GBG controls, there was no indication of differences in rates of disorders among the three control groups (internal GBG, internal ML, and external controls); see contrasts in rows 4 and 5 of this table. In this best fit model, there were no significant interactions between intervention and baseline aggressive, disruptive behavior. To further ensure the unbiasedness of the estimated treatment effect, we added assignment adjustment by including the probability of GBG assignment (π) as a main effect. For all individuals in the same school, the value of this covariate π was the same, simply the proportion of the classes that were assigned to the GBG. These propensities varied from 1/2 in schools that had two classrooms to 2/3 for schools that had three classrooms with two assigned to the intervention. In the assignment adjusted GLMM analysis summarized in Table 8, we have carried out the same analysis by now adding the propensity covariate to the analysis (row 3). The reduction in lifetime drug abuse/dependence disorders for the GBG compared with internal GBG controls
Table 7 Generalized linear mixed model (GLMM) results for lifetime drug abuse/dependence disorders among males with no assignment adjustment (N = 269 students, 31 classrooms)
Fixed effects Intercept Baseline aggressive, disruptive behavior GBG vs. internal GBG control (Tx1) External control vs. internal GBG control (Tx2) Internal ML control vs. internal GBG control (Tx3)
Random effects Classroom a
For testing zero variance.
Coefficient (S.E.)
d.f.
t-value
p-value
−1.442 (0.396) 1.200 (0.299) −0.999 (0.450) −0.211 (0.403) −0.130 (0.448)
237 237 27 27 27
−3.642 4.019 −2.221 −0.525 −0.291