JOURNAL OF APPLIED PHYSICS
VOLUME 96, NUMBER 3
1 AUGUST 2004
Microstructure and electrical characterizations of yttrium oxide and yttrium silicate thin films deposited by pulsed liquid-injection plasma-enhanced metal-organic chemical vapor deposition C. Duranda) Laboratoire des Technologies de la Microélectronique (LTM/CNRS), 17 Avenue des Martyrs (CEA-LETI), 38054 Grenoble Cedex 9, France
C. Dubourdieu Laboratoire des Matériaux et du Génie Physique, UMR-CNRS 5628, ENSPG, Boîte Postale 46, 38402 Saint Martin d’Hères Cedex, France
C. Vallée, V. Loup, M. Bonvalot, and O. Joubert Laboratoire des Technologies de la Microélectronique (LTM/CNRS), 17 Avenue de Martyrs (CEA-LETI), 38054 Grenoble Cedex 9, France
H. Roussel Laboratoire des Matériaux et du Génie Physique, UMR-CNRS 5628, ENSPG, Boîte Postale 46, 38402 Saint Martin d’Hères Cedex, France
O. Renault CEA-DRT-LETI/DPTS, CEA-Grenoble, 17 Avenue Des Martyrs, 38054 Grenoble Cedex 9, France
(Received 10 February 2004; accepted 5 May 2004) Results on yttrium oxide and yttrium silicate films elaborated by an innovative metal-organic chemical vapor deposition process combining plasma assistance and a liquid precursor supply setup are presented. Plasma assistance enables deposition at a much lower substrate temperature and the pulsed-liquid precursor source allows an accurate control of the injected reactive species. According to x-ray photoelectron spectroscopy 共XPS兲 analyses, we show that ultrathin yttrium oxide deposition can be performed at temperature less than 380 ° C. Yttrium oxide films contain carbon contamination that can be reduced by increasing the deposition temperature. The plasma plays a key role in the deposition mechanisms and thus in the chemical structure of the films and of the interface. It is shown that the injection frequency, i.e., the reactive species incoming frequency, plays a significant role in the silicate and interface formation. A detailed study is presented using angle-resolved XPS. A high injection frequency limits the formation of SiO2 interfacial layer and also of the silicate and favors the growth of yttrium oxide. In addition, silicate formation also depends on the deposition temperature. Electrical results show that as-deposited film at 350° C has a low leakage current 共J ⬍ 10−7 A / cm2兲 and a high breakdown field 共⬃8 MV/ cm兲. © 2004 American Institute of Physics. [DOI: 10.1063/1.1766412] and MIM capacitors are tested rather with “medium ” [such as HfO2,5 Al2O3,6 and Y2O37 or with “very high ” dielectrics (such as SrTiO3 or BaTiO3). On the other hand, the aggressive scaling of CMOS devices beyond the 0.1 m generation is driving the SiO2 gate dielectrics to its physical limits, due to excessive direct tunneling leakage current. High dielectric constant (high-k) materials are attracting candidates for SiO2 replacement. Indeed, they allow an increase of the physical thickness of the dielectric layer in the device wile preserving the capacitance value.8 Most high-k studied materials are based on metal oxides 共MOx兲 and their silicates 共MxSiyOz兲. For instance, currently several dielectric materials such as Al2O3, ZrO2, and HfO2, as well as mixed oxides containing SiO2 (silicates) or Al2O3 (aluminates) are being studied extensively. Y2O3 and rare earth oxides such as La2O3 , Pr2O3, and Gd2O3 are also proposed as good candidates to replace SiO2 thanks to their reasonably high permittivity 共10⬍ ⬍ 30兲, compatibility when in direct contact with Si,9 good thermal stability, and relatively large conduc-
I. INTRODUCTION
Materials with high dielectric constant have been introduced in integrated circuits as stated in the International Technology Roadmap for Semiconductors1 for applications such as CMOS (complementary metal oxide semiconductor) gate dielectrics and MIM (metal-insulator-metal) capacitors. On the one hand, integration of MIM structure for the next generation of radio frequency chips is needed. Increasing the dielectric constant of the dielectric used in MIM structures allows an increase of the capacitance density. In addition to a high dielectric constant, the material must satisfy a large number of requirements different to CMOS gate oxide specifications such as a high degree of capacitance linearity, a high dielectric breakdown 共Ebd ⬎ 5 MV cm−1兲, and a low thermal budget 共⬍450° C兲 specific to back-end processes. Efforts were first engaged to obtain MIM structures using Ta2O5. However, large leakage current has been observed2–4 a)
Electronic mail:
[email protected]
0021-8979/2004/96(3)/1719/11/$20.00
1719
© 2004 American Institute of Physics
Downloaded 28 Jul 2004 to 132.168.25.56. Redistribution subject to AIP license or copyright, see http://jap.aip.org/jap/copyright.jsp
1720
Durand et al.
J. Appl. Phys., Vol. 96, No. 3, 1 August 2004
tion band offset (2.3 eV for Y2O3).10 Although previous studies have revealed that these oxide films absorb water11–13 and present significant charge density responsible for deteriorated electrical characteristics, interesting results have been found on Y2O3 and Y-based silicate. For instance, Chambers and Parsons pointed out that yttrium has a very high affinity for oxygen and showed that an annealing results in the thickness reduction of SiO2 to form a silicate layer.14,15 Copel et al. take advantage of the high stability of Y-O bondings to accurately control the silicate formation by developing a solid-state technique: the unwanted interfacial SiO2 is consumed by yttrium oxide to form a silicate layer, which seems to be thermodynamically favorable.16,17 In spite of a lower permittivity than metal oxides, silicates are expected to have beneficial properties with lower charge densities compared to metal oxides thanks to similarities with SiO2. To avoid interfacial reaction, the high-k layer can be capped to protect the film from water ambient absorption (OH species favor the interface formation), as proposed by Stemmer et al.,18 or a prenitrided sample can also be used to prevent Si diffusion from the substrate to form a silicate.15 Concerning deposition methods, physical vapor deposition (PVD) processes were traditionally used to deposit metal oxides. Y2O3 has been deposited by sputtering,19–22 by ionized cluster beam deposition,23–25 by ion beam sputtering,26–28 by pulsed laser deposition,29 by electron beam evaporation,30–33 and by molecular beam epitaxy.34,35 However, most of PVD techniques may not be suited in large scale CMOS processing on 200 or 300 mm Si wafers. Sputtering processes may not be suitable because of possible electrical damages induced in the extremely sensitive channel region of CMOS devices. Chemical vapor deposition (CVD) methods are usually preferred. However, a key point of CVD processes (named MOCVD when precursors are metal-organic compounds) deals with how to provide a stable and reproducible precursor supply to ensure a perfectly controlled growth of thin metal-oxide films. The use of a pulsed-liquid-injection source has been proposed to overcome this difficulty.36–39 The use of plasma assistance has been also reported for MOCVD process on HfO2,40,41 ZrO2,42 Y2O3,43 Hf, or Zr-based silicate44 and for atomic layer deposition 共ALD兲 process on ZrO245,46 and SrTiO3.47 Even if processes using plasma assistance are not well understood and optimized in terms of parameter adjustments, it looks very attractive. For instance, Kim et al. showed that the oxygen plasma use in an ALD process improved ZrO2 film quality with a low carbon incorporation, a low leakage current, and negligible hysteresis compared to films deposited by conventional ALD.46 Niu et al. achieved deposited yttrium oxide with oxygen plasma assistance and showed the presence of a three-layer structure Y2O3 / silicate/ SiO2 after annealing at 900° C under N2.43 Advantages of plasma assistance are, first, a decrease of the deposition temperature for low thermal budget applications as MIM capacitors and, second, a possible use of plasma effects as predeposition or postdeposition treatments. In this paper, we investigate the formation of yttrium oxide and yttrium silicate films by plasma-enhanced MOCVD 共PE-MOCVD兲 using a pulsed-liquid-injection
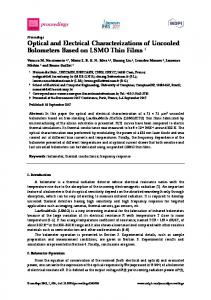
FIG. 1. Schematic of the PE-MOCVD experimental setup used to deposit yttrium oxide with the pulsed liquid-injection precursor source connected to the plasma chamber.
source. This type of source is hooked up to a plasma assisted MOCVD chamber. The role of plasma is to enable a lowering of the deposition temperature, which is particularly interesting for the deposition of dielectric films compatible with back-end thermal budget constraints 共⬍450° C兲. We will indeed show that yttrium oxide deposition at below 380° C can be performed. The films chemical structure is analyzed by x-ray photoelectron spectroscopy 共XPS兲 and by Fouriertransform infrared spectroscopy 共FTIR兲 in the transmission mode. X-ray diffraction 共XRD兲 is also used for the study of thick crystallized films. Results on thick 共⬃40 nm兲 and ultrathin 共⬃4 nm兲 films are presented. The interface nature and formation are analyzed and the influence of deposition parameters such as the reactive species incoming frequency is discussed. It is shown that the injection frequency plays an important role in the formation of the silicate and of the interfacial layer. The role of temperature is also investigated. Finally, electrical results are shown for as-deposited and annealed films. II. EXPERIMENTAL PROCEDURE A. The deposition process
Yttrium oxide films were grown by pulsed-injection plasma-assisted MOCVD. The experimental setup is shown in Fig. 1. The gas phase is generated using a pulsed-liquidinjection source. The liquid precursor is maintained at room temperature in a closed vessel pressurized under an inert gas (N2 at 2 bars). The liquid reservoir is connected to a highspeed electrovalve (a car injector) driven by an electrical pulse, which is controlled by computer. Microamounts of liquid solution are injected into an evaporator held at 190° C and are “flash” evaporated. The precise amount of reactive species in the reactor is controlled accurately by the injection opening time and injection frequency. With this innovative delivery scheme, reasonable vapor pressures of thermally unstable precursors can be obtained and kept stable over the deposition run and thus complex oxides can be reproducibly grown.37,39 For the time, this delivery scheme was combined, in this study, to a plasma-assisted CVD chamber. The plasma is driven by a 380 kHz power supply and pressure in the
Downloaded 28 Jul 2004 to 132.168.25.56. Redistribution subject to AIP license or copyright, see http://jap.aip.org/jap/copyright.jsp
Durand et al.
J. Appl. Phys., Vol. 96, No. 3, 1 August 2004 TABLE I. The standard process conditions of the plasma chamber and of the pulsed-liquid precursor source, respectively. Standard plasma chamber parameters
Standard injection parameters
Pressure
Gas
0.27 kPa 共2 Torr兲 Dilution
O2 250 SCCM Injection number 0.02 mol/ l 1–5000
Input plasma power 70 W
Wafer temperature 350° C
Frequency
Opening time
1 – 10 Hz
2 ms
chamber can be adjusted between 27 and 670 Pa (0.2 and 5 Torr). A showerhead ensures a uniform distribution of gas stream over the heated wafer substrate (resistive heating). For the present study, tri(2,2,6,6-tetramethyl-3,5heptanedionate) yttrium [abbreviated as Y共tmhd兲3] was used as a precursor. The metal-organic precursor, which is a solid powder, was dissolved in a solvent (cyclohexane). The gaseous reactive species in the evaporator were transferred via a heated line 共195° C兲 to the reaction chamber using a neutral carrier gas [Ar at 30 SCCM (SCCM denotes cubic centimeter per minute at STP)]. The plasma gases were formed from Ar and O2. The reaction chamber was maintained at low pressure, typically 0.27 kPa 共2 Torr兲. The films were deposited on p-type 8 in. Si共100兲 substrates with 0.8 nm thermally grown SiO2. The standard deposition conditions are given in Table I. Postdeposition annealing were performed on selected samples to investigate their electrical properties.
B. Characterization techniques
XPS, FTIR, and XRD were used to identify the bulk as well as the interface chemistry and structure of the films. The XPS spectra were collected with an Al K␣ x-ray source 共hv = 1486.6 eV兲 and an electron energy analyzer operating in a constant pass energy mode (50 and 20 eV for the survey and core level spectra, respectively). All studies were done at 45° as takeoff angle except for the angle-resolved studies. Spectral deconvolution was performed to extract the Si 2p, O 1s, C 1s, and Y 3d peak intensities. Chemical compositions were derived from the areas of the different XPS spectra weighted by corresponding sensitivity factors available from the database of the acquisition software. To check the XPS quantification, both XPS an RBS (Rutherford backscattering spectroscopy) were done on an Y2O3 layer, which was elaborated on silicon by thermal MOCVD at 700° C. The [O]/[Y] ratio was found identical in RBS and XPS analyses using the Y 3d and O 1s sensitivity factors from XPS database. For the interfacial oxide thickness, we used a SiO2 escape depth model from Si 2p spectra. Si 2p spectra were fitted with a Shirley background and five chemical states (Si0, Si1+, Si2+, Si3+, Si4+), which are separated by approximately 1 eV each, with an increasing FWHM (the full width at half maximum). The fitting peak characteristics are presented in Table II. The peak from the substrate is located at 99.3 eV and is denoted Si0. The interfacial layer thickness of oxidized silicon tox is usually calculated using Eq. (1),48
1721
TABLE II. Binding energy, FWHM (full width at half maximum) and peak shape (Lorentzian-Gaussian percentage) for each Si oxidation state to fit the Si 2p XPS region.
Oxidation state 0
Si Si1+ Si2+ Si3+ Si4+ a
Binding energy (eV)
FWHM
Lorentzian (L) Gaussian (G) percentage (%) (L:100 and G:0)
99.3 100.3 101.1 102.1⫺102.3a 103.3
0.9 1.0 1.2 1.3⫺1.5a 1.4
25 0 0 0 0
Variable values, which depend on fitting results.
冉 冊
tox = ox sin共兲ln
R +1 , R⬁
共1兲
where is the photoelectron takeoff angle, R is the ratio Aox / ASi of the sample 共ASi being the relative areas of the Si0 component and Aox the sum of the relative area of the Sin+ components兲, R⬁ is the ratio Aox / ASi in the case of a thick thermal SiO2 and bulk Si sample. The photoelectron inelastic mean-free path ox is difficult to estimate for our interface. Nevertheless, the ratio R evolution gives a good qualitative image of the interface thickness because ox , and R⬁ can be considered constant. Therefore, the ratio R will be used to describe the oxidized Si-based compounds’ thickness evolution. High-k compounds are insulating, which leads to charging effects as evidenced by a shift to higher binding energies of XPS peak positions. This effect has been systematically corrected by positioning, when detectable, the Si 2p peak from the substrate at 99.3 eV. This correction leads to C 1s peak position from surface contamination at 285.7 eV. When no Si 2p contribution from the substrate could be detected by XPS, the charging correction was carried out relative to this surface C 1s peak position. The samples’ surfaces were treated by an Ar+ ion beam 共1.5 keV @ 10 A during 30 s兲 only for thick layers before XPS analysis to remove the organic surface contamination. We initially determined Y2O3 peak positions with a ceramic Y2O3 sample 共sintered Y2O3 powder annealed at 1500° C during 24 h兲. The Y 3d共3/2兲-共5/2兲 doublet is located at 156.7 and 158.7 eV in agreement with literature data on Y2O3 reference compounds.49 Also, the solid precursor powder of Y共tmhd兲3 was analyzed by XPS with a monochromatic source at 35° takeoff angle in order to locate the Y energy binding in the precursor molecule environment. A Study of the bonding environments in the grown material and at the interface was also carried out using FTIR. A Bruker IFS 55 Fourier-transform infrared spectrometer was used. The resolution and number of scans were set at 4 cm−1 and 500, respectively. Capacitance-voltage 共C-V兲 and currentvoltage 共I-V兲 measurements were conducted on a HP 4284 A precision LCR meter and HP 4156 A meter, respectively. The structure was metal-oxide semiconductor formed by evaporating gold on the films through shadow masks. Four different surfaces 共0.354⫻ 10−2, 0.694⫻ 10−2, 1.71⫻ 10−2, 2.78⫻ 10−2 mm2兲 were defined. The equiva-
Downloaded 28 Jul 2004 to 132.168.25.56. Redistribution subject to AIP license or copyright, see http://jap.aip.org/jap/copyright.jsp
1722
Durand et al.
J. Appl. Phys., Vol. 96, No. 3, 1 August 2004
FIG. 2. XPS survey scans for (a) process with only plasma enhanced at 70 W (as PECVD), (b) process with only substrate heating at 350° C (as MOCVD), and (c) process with both plasma and substrate heating at 70 W and 350° C, respectively 共PE-MOCVD兲. This graph shows the synergy between the plasma and the substrate heating to deposit Y2O3 layers using the PE-MOCVD technique.
lent oxide thickness 共EOT兲 was extracted from the accumulation region 共no quantum mechanical correction was applied兲. III. RESULTS AND DISCUSSION A. Plasma enhanced MOCVD: Plasma effects
In order to work out the influence of the plasma and of the substrate temperature on the process, we performed three different experiments: (a) deposition using plasma assistance 共70 W兲 but without heating the substrate, (b) deposition at 350° C without plasma, and finally (c) deposition using both thermal 共350° C兲 and plasma assistance 共70 W兲. The XPS analyses of the three samples are shown in Fig. 2. As expected, there is no deposited yttrium for the run performed without heating the substrate chuck (the actual substrate temperature is estimated to be lower than 150° C) [Fig. 2(a)]. At 350° C, when no plasma is used, yttrium is not detected as well [Fig. 2(b)]. Clearly the plasma is needed to form an yttrium oxide film from the -diketonate Y共tmhd兲3 precursor at such a low temperature [Fig. 2(c)]. Indeed, the Y 3d, 3p, and 3s signatures are only observed in this case. A study of several key parameters (pressure, O2 partial pressure and flux, plasma power) was carried out to understand deposition mechanisms and to optimize the process. Apparently, the plasma promotes the precursor decomposition but also induces two other opposite effects: (i) carbon deposition from the solvent and from the precursor organic chains dissociation and (ii) carbon etching. For several sets of deposition conditions, we determined threshold values beyond which a thick carbon layer is deposited instead of yttrium oxide. When the plasma density is high, it strongly decomposes carbon chains from the solvent and the precursor. If the O2 partial pressure is too low, all carbon groups on the substrate surface cannot be etched and thus carbon species are incorporated during the growth. The use of oxygen in the plasma gas phase ensures minimum carbon contamination and oxygen stoichiometric adjustment of the deposited layer. However, a too high oxygen partial pressure in the plasma and a too high plasma power can also lead to an undue increase of deleterious SiO2 at the interface. Therefore, optimization of
FIG. 3. XPS analysis [(a) Y 3d, (b) O 1s, and (c) C 1s regions] for a thick yttrium oxide layer 共⬃40 nm兲 processed in the standard deposition conditions. Spectrum of an Y2O3 crystal is also presented for comparison on Y 3d and O 1s regions. Furthermore, Y 3d region of the precursor Y共tmhd兲3 powder analysis is inserted. The C 1s region is presented before and after surface sputtering.
the deposition conditions should take these different points into account (Table I). The plasma power was fixed to 70 W in order to limit the solvent decomposition and wafer oxidation. The working pressure was fixed at 0.27 kPa 共2 Torr兲 in order to maintain a reasonable thermal exchange for the substrate heating, while, at the same time, to decrease energetic ion bombardment at the surface of the growing film, which may induce a high interfacial state density. Indeed, the plasma is localized near the showerhead and the sheaths are collisional. In this case, the plasma is similar to a “remote plasma.” B. Properties of thick yttrium oxide films
Figure 3 presents the Y 3d, O 1s, and C 1s XPS spectra for a thick 共⬃40 nm兲 film deposited in the standard condition (Table I) using an injection frequency of 5 Hz. The corresponding Y 3d and O 1s spectra for an yttrium oxide reference ceramic are also shown, after surface sputtering. In
Downloaded 28 Jul 2004 to 132.168.25.56. Redistribution subject to AIP license or copyright, see http://jap.aip.org/jap/copyright.jsp
J. Appl. Phys., Vol. 96, No. 3, 1 August 2004
FIG. 4. The graph shows FTIR spectra for the thick sample and three annealing post-treatments. The as-deposited film is denoted by curve with squares (䊏), the H2 annealed at 450° C for 30 min by the curves with circles 共쎲兲, the O2 annealed at 700° C for 30 min by the curves with up triangles 共䉱兲, and finally the Ar annealed at 700° C for 30 min by curves with down triangles (䉲).
the reference material, the Y 3d5/2-3/2 doublet position (respectively, 156.7 and 158.7 eV) and O 1s peak 共529.5 eV兲 are consistent with literature data for Y2O3. The peak shoulder around 531.8 eV has also been observed by several authors and has been attributed to O-H bonding14 or oxygen trapping.29 Before sputtering the reference ceramic, this peak was higher relatively to the main one at 529.5 eV, indicating that surface bonds are involved. For the PE-MOCVD film grown at 350° C, the Y 3d共5/2兲-共3/2兲 doublet is located at 158.5– 160.5 eV [Fig. 3(a)]. This could correspond to Y-O-Si bonds, however, as we do not observe any peak in the Si 2p region, it is attributed to Y-O-C bonding and H contamination. The Y-O-H bond has already been reported to explain the shifted Y 3d doublet.50 However, in our case, FTIR analysis (Fig. 4) does not show any O-H signature 共3000– 3700 cm−1兲. The carbon bonding to oxygen is expected to shift the Y 3d peak toward higher binding energies as compared to Y-O binding in Y2O3 by considering the electronegativity of carbon. The shift of Y-O-C bonding should also be larger than for Y-O-Si because C has a higher electronegativity compared to the Si one (respectively, 2.5 and 1.8 eV). For the organic precursor Y共tmhd兲3, the shift is indeed quite important as yttrium is bonded to three tmhd ligands as shown in the insert of the Y 3d region, Fig. 3(a) (165.0 eV for the main component, the smaller one probably correspond to additional yttrium bindings due to air exposure). If a constant splitting of 2.0 eV is assumed for the Y 3d doublet, the fitting of the Y 3d spectrum requires at least two components for each peak, which indicates a multiple yttrium bonding environment (C and H presumably). Consistent with this, the O 1s peak at 530.6 eV can be attributed to Y-O-C bonds with H contamination [Fig. 3(b)]. The second peak at 533.0 eV comes from O-C bonds in the deposited layer and also from organic surface contamination. Indeed, after sputtering the surface, this peak decreases to the same level as the 530.6 eV one. The C 1s region [Fig. 3(c)] exhibits two distinct contributions located, respectively, at 285.7 and 291 eV. The first one comes only from organic surface contamination, because this peak disappears after sputtering the surface. On the contrary, the second peak corresponds to carbon in the film. As a conclusion, the thick films grown at 350° C using an injection frequency of 5 Hz
Durand et al.
1723
FIG. 5. XRD diagrams for (1) as-deposited sample, (2) H2 annealed at 450° C, (3) Ar annealed at 700° C, and (4) O2 annealed at 700° C.
contain Y-O bonds with no indication of silicate-type bonds but rather C and H environments. Incorporation of organic residue in the film is likely to occur during deposition at low temperature due to incomplete decomposition of the precursor. This is confirmed by the FTIR spectrum (Fig. 4) that shows a band at 840 cm−1 and two other broad bands centered on 1520 and 1400 cm−1. These bands are assigned to C-O and C-H stretching modes. The previous film was annealed under Ar or O2 flow at 700° C or under H2 flow at 450° C for 30 min. The / 2 x-ray diffraction diagrams (Fig. 5) indicate crystallization of the film at 700° C, whereas it is still amorphous (or nanocrystallized) at 450° C. XPS spectra are shown in Fig. 6 (after Ar sputtering). The formation of Y2O3 upon Ar or O2 annealing at 700° C is confirmed by the Y 3d and O 1s peaks’ positions [Figs. 6(a) and 6(b)]. The Y 3d5/2 peak is located at 156.7 eV with a lower FWHM corresponding to Y-O bonds in an Y2O3 crystal. Likewise, the O 1s peak at lower binding energy becomes the main contribution and is
FIG. 6. XPS spectra [(a) Y 3d and (b) O 1s regions] for as-deposited thick sample and three annealing post-treatments after Ar sputtering for surface contamination removal (same symbols as in Fig. 4).
Downloaded 28 Jul 2004 to 132.168.25.56. Redistribution subject to AIP license or copyright, see http://jap.aip.org/jap/copyright.jsp
1724
J. Appl. Phys., Vol. 96, No. 3, 1 August 2004
Durand et al.
shifted to 529.5 eV as in Y2O3 crystal. Moreover, the 700° C annealings reduce the C impurities in the layer, since the intensity of broadbands around 1520 and 1400 cm−1 and band at 840 cm−1 are considerably attenuated on the FTIR spectra (Fig. 4). This effect is also visible with XPS analysis on the O 1s region [Fig. 6(b)] where the contribution attributed to O-C bonds (at 533 eV) is reduced compared to O -Y peak near 530 eV. We note on FTIR spectra a significant increase of the peak at 1080 cm−1 corresponding to transversal optical mode of Si-O bond in silicon dioxide for 700° C O2 annealing. To conclude, a high temperature annealing leads to the crystallization of the as-deposited films and to a decrease in carbon content. C. Analysis of thin films: Effects of injection frequency on the interface layer and silicate formation
1. XPS analysis
By varying the injection frequency (from 1 up to 10 Hz), we intended to vary the reactive species supply rate at the substrate surface, which might influence the interface layer growth. The standard conditions were used for all other parameters (Table I). For each experiment, the injected volume was the same (1000 injections), which corresponds to a layer thickness thin enough 共⬍10 nm兲 to detect the silicon substrate by XPS, except for the 10 Hz film. The thickness was found to increase with increasing injection frequency. XPS was used to study both the film and the interface (no Ar sputtering was used prior to measurements in order to prevent film or interface degradation). Figure 7 presents the Si 2p, Y 3d, and O 1s XPS regions of layers grown at increasing injection frequency. The Si 2p spectra [Fig. 7(a)] are normalized to the Si0 peak area (the substrate peak Si0 is at 99.3 eV). If not normalized, the Si0 peak decreases with increasing injection frequency, indicating an increase of the film thickness. A bare SiO2 共0.8 nm兲 / Si substrate is also shown for comparison. The corresponding Si-O peak is located at 103.3 eV, which is the expected binding energy for SiO2. Clearly from Fig. 7(a), the Si-O peak for the different films is shifted towards lower energies than the binding energy of SiO2, which can be assigned to Y-O-Si type of bonds. The expected range of Si 2p in Y-O-Si binding is indeed in the 101.5– 103 eV range, depending on the exact silicate composition.51 Also the FWHM of the Si-O Si 2p peak, which is of 1.6 eV for SiO2 in the bare substrate, is strongly, increased for the films (to 2.2 eV), which indicates a wide range of Si-O bonding in the films. Finally, the normalization to the silicon substrate Si 2p peak area clearly emphasizes the increasing content of silicate-based compounds in the films with decreasing injection frequency. This point will be specified later (Sec. III C 2). In the Y 3d region [Fig. 7(b)], the Y 3d5/2 and Y 3d3/2 peaks are located at, respectively, 158.7 and 160.7 eV for the 1 Hz film. These positions are coherent with Y-O-Si bonds, which have been evidenced also on the Si 2p region. However, Y-O-C bindings cannot be precluded at this point as we showed that the corresponding Y 3d doublet appears for similar energies [Fig. 3(a)]. The Y 3d splitting is progressively less pronounced with increasing injection frequency (whereas its lo-
FIG. 7. XPS spectra [(a) Si 2p, (b) Y 3d, and (c) O 1s regions] for samples with increasing injection frequency [1 Hz (쎲), 2 Hz (•), 5 Hz 共䉱兲, and 10 Hz (䉲)]. Si 2p spectra are normalized on Si0 peak area (peak from substrate) in order to estimate the oxidized Si-based compound thickness, since the well-known method for measuring the thickness of oxide film by XPS is based on the area ratio between the oxidized silicon ASi-O and substrate silicon ASi. The spectrum of initial substrate 关Si/ SiO2 共0.8 nm兲兴 is also done for comparison.
cation is only slightly changed), indicating a much wider Y-O bonding environment, probably arising from both Y-O-Si and Y-O-C type of bonds. On the other hand, the 1 Hz sample consists of a well-defined bonding (presumably a silicate compound with no secondary yttrium carbonate phase as shown hereafter in the following section). No evidence for Y-Si bonds from silicides was found on the Y 3d or Si 2p regions (expected at ⬃156.5 and 98.7 eV, respectively). On the O 1s region [Fig. 7(c)], the peak shape also changes progressively with the injection frequency. For high frequencies (5 or 10 Hz), two separated peaks appear. One is at 533 eV 共FHWM= 2.0 eV兲, which corresponds to the binding energy in SiO2 and, as we showed it previously [Fig. 3(b)] to the binding energy in O-C chains of organic residues and surface contamination. The second peak at 530.6 eV is attributed to Y-O-C and also to Y-O-Si bindings. For the 1 Hz sample, a broad peak is observed. The significant peak
Downloaded 28 Jul 2004 to 132.168.25.56. Redistribution subject to AIP license or copyright, see http://jap.aip.org/jap/copyright.jsp
J. Appl. Phys., Vol. 96, No. 3, 1 August 2004
Durand et al.
1725
FIG. 8. Angle-resolved XPS analyses (Si 2p, Y 3d, and O 1s regions) at three takeoff angles [90° (䊏), 30° 共쎲兲 and 15° 共䉱兲] of the 5 Hz sample [(a), (b), and (c)] and the 1 Hz sample [(d), (e), and (f)]. Note that the intensity of Si 2p spectra is normalized on the Si-O peak. The relative intensity of each Sin+ contribution for the different takeoff angle analyses extracted from the Si 2p fit model is plot in the insert of Si 2p regions [(a) and (d) corresponding to the 5 and 1 Hz samples, respectively].
contribution around 531.5 eV is consistent with a silicate compound14 and confirms the observation made on the Y 3d and Si 2p regions. 2. Angle-resolved XPS analysis
In order to get some insight on the nature and chemical structure of both the interface (in contact with the silicon substrate) and film, we performed angle-resolved XPS (AR-XPS) on the 1 and 5 Hz films. Three different takeoff angles were studied (90° and two grazing incidence anges: 30° and 15°). Note that, when the takeoff angle decreases, the probed depth decreases as well, so that surface contributions are enhanced. Figure 8 shows the Si 2p, Y 3d, and O 1s XPS regions for both samples. The Si 2p spectra intensity is normalized on the Si-O peak area. Thus, the substrate Si0 peak clearly decreases with decreasing takeoff angle as expected (for the 5 Hz sample, the substrate is even not probed at 15°). A quantitative analysis of the Si-O Si 2p peak was carried out by considering four Si oxidized states (Si1+, Si2+, Si3+, and Si4+, see Table II). The result of the fitting procedure is given in the inserts on the Si 2p regions [Figs. 8(a) and 8(b)] by a relative intensities bar graph of each Sin+ (n = 1 – 4) contribution. The Si3+ contribution is shifted by 2.8– 3.0 eV compared to Si0. This value is larger
than the common value reported for the Si3+ suboxide 共2.6 eV兲 in a conventional SiO2 / Si interface.52 The fitting using a imposed 2.6 eV shift position value for the Si3+ component was clearly not adapted. The presence of such a component of oxidized Si, abnormally shifted relative to Si3+ in Si/ SiO2, is attributed mainly to silicate-type bondings Si-O-Y (this does not mean that we exclude the presence of substoichiometric SiOx, but the corresponding contribution is overlapped by the silicate one due to our limited energy resolution). Other reasons support the Si3+ assignment to mainly silicate bonds. First, the Y 3d peak position at 158.7 eV is consistent with silicate Y-O-Si bonds. Second, the Si3+ intensity from substoichiometric SiOx compared to the other oxidized contributions (i.e., Si1+, Si2+, and Si4+) is limited, since it represents only 11.3% of the Si-O signal for the initial SiO2共8 Å兲 / Si substrate. Even when the initial substrate is exposed under O2 plasma during 1500 s (under the standard plasma chamber parameters presented in Table I) without injection, an increase of contribution from substiochiometric SiOx (i.e., Si1+, Si2+, and Si3+) is not observed and the Si3+ peak represents 8.2% of the Si-O signal. On the contrary, when the yttrium precursor is injected, the Si3+ is strongly enhanced, since the Si3+ signal represents 46.5% and 39.8% of the Si-O peak on the 5 and 1 Hz sample,
Downloaded 28 Jul 2004 to 132.168.25.56. Redistribution subject to AIP license or copyright, see http://jap.aip.org/jap/copyright.jsp
1726
Durand et al.
J. Appl. Phys., Vol. 96, No. 3, 1 August 2004
respectively. Such an increase is likely to arise mainly from a silicate contribution. Electron energy-loss spectroscopy measurements have been done and confirmed the presence of silicate (not shown here). It is worth noting that a similar fitting procedure was employed to study Al2O3 / Si interface in Ref. 53. As the deposited film is amorphous, silicate-type bindings is most likely in multiple bonding environment. Therefore, a part of the Si2+ contribution is certainly assigned to silicate-type bondings. As the O2 plasma under the standard conditions is not energetic, the incompletely oxidized silicate presence is a reasonable hypothesis. For the 5 Hz sample, no shift of the Si-O peak is observed when the incidence angle changes from 90° to 30°. No significant change is also observed in the relative intensity of the Si3+ and Si4+ contributions between 90° and 30° [insert of Fig. 8(a)]. Hence, the 5 Hz film is composed of an yttrium silicate, which is probably present at the interface (or on top of a very thin SiO2 layer that cannot be resolved by changing the takeoff angle), Since the Si 2p peak disappears at 30°, no silicon atom is present at the top surface. Thus, the silicate film does not extend up to the top surface and the top layer consists of YxOyCz film. Indeed, the Y 3d angleresolved peak exhibits a slight shift towards higher energies (+0.5 eV from 158.5 to 159.0 eV) with decreasing takeoff angle that corresponds to an Y-carbonate signature enhancement compared to the Y-silicate signal, since at 15° no silicate is involved in the measured response (accordingly to the Si 2p region). These observations are consistent with the presence of two kinds of bindings distributed differently in the sample: Y-O-C (top surface) and Y-O-Si (interface). As we already mentioned it for the thick sample analysis (Fig. 3), the binding energies of Y-O-Si and Y-O-C are quite close. The peak located at 532.8 eV, which does not shift with decreasing angle, indicates that the C contamination is uniformly distributed in the film. For the 1 Hz sample, the Si-O peak from the Si 2p region is significantly shifted 共−0.5 eV兲 towards lower binding energies for decreasing takeoff angle, which clearly indicates a distribution of different silicon-oxide based compounds within the depth of the film. The quantitative analysis [insert of Fig. 8(d)] shows a strong increase of silicate signals (Si2+ and Si3+) and a clear decrease of the SiO2 contribution 共Si4+兲 at grazing angles. The sample appears composed of a SiO2 interface with the silicon substrate and of a silicate layer on top of it. The increasing contribution at 531.5 eV [Fig. 8(f)] with decreasing takeoff angle is consistent with this picture. Since no shift is observed on the Y 3d peak [Fig. 8(e)], there is no YxOyCz layer. These characterizations lead us to propose two different microstructures for the 1 and 5 Hz films, which are depicted in Fig. 9. At low injection frequency 共1 Hz兲, the film is composed of an yttrium silicate layer with an interfacial SiO2 layer in contact with silicon 共Si/ SiO2 共⬃4 nm兲 / SixOyYz兲. At higher frequencies, the interfacial layer is rather an yttrium silicate (silicon rich) with an yttrium oxide layer on top of it with carbon impurities 共Si/ SixOyYx 共⬃2 nm兲 / YxOyCz兲. This picture was confirmed by transmission electron microscopy
FIG. 9. Diagram illustrating the difference between the 5 and 1 Hz structure consistent with AR-XPS.
and electron energy-loss spectroscopy investigations. However, if the 1 Hz sample is grown thicker 共⬃40 nm兲, a top YxOyCz film is grown too. 3. Discussion
The injection frequency (i.e., the flux of reactive species) has a strong effect on the plasma density and composition, which may influence the growth mechanisms. We propose the schematic reactions (shown below) during the deposition. These reactions are inspired by those proposed by Niu et al.,43 Si + O* + R → SiO2 + R,
共2兲
Y-O-R⬘ + O* → Y-O-C + R⬙ ,
共3兲
Y-O-R⬘ + Si + O* → Si-O-Y + R⬙ .
共4兲
The reactions are written schematically, and are not balanced. Reaction (2) is the silicon oxidation by the energetic oxygen species (denoted O*) from the oxygen plasma that is enhanced by volatile organic compounds, denoted R. Indeed, oxidation rate is strongly limited 共0.03 nm/ min兲 when experiments are carried out without injection under standard process conditions (Table I), whereas it is strongly increased when solvent (cyclohexane) is injected into the oxygen plasma (0.12 nm/ min at 5 Hz).54 Reaction (3) is the formation of yttrium oxide carbonate by decomposition and oxidation reaction of the organic Y共tmhd兲3 precursor molecule thanks to the oxygen plasma. The precursor molecule is represented by Y-O-R⬘, where R⬘ is the organic ligand [reactions (3) and (4)]. Only a schematic reaction is proposed here since decomposition paths of precursor molecules such as Y共tmhd兲3 is far too complicated to be described and is not known in detail. R⬙ denotes compounds resulting from the precursor decomposition, i.e., the organic ligand R⬘ itself and oxidation by-products of the organic ligand. Indeed, the analysis of the light emitted by plasma using optical emission spectroscopy (not shown here) indicates clearly the CO, CO2, and H2O signatures in the plasma phase. Reaction (4) describes the silicate formation by decomposition of the precursor and reaction with Si, which is enhanced by the O2 plasma. Silicate films can contain a slight carbon contamination. Reaction (2) and (4) occur at the substrate interface, whereas reaction (3) is the main deposition mechanism far from the interface. For a high reactant flow, i.e., at 5 Hz injection frequency, a high reactive species quantity is present on the substrate surface and reactions that consume precursor molecules are favored, i.e., reactions (3) and (4). The interface mainly results in silicate compounds, since re-
Downloaded 28 Jul 2004 to 132.168.25.56. Redistribution subject to AIP license or copyright, see http://jap.aip.org/jap/copyright.jsp
Durand et al.
J. Appl. Phys., Vol. 96, No. 3, 1 August 2004
1727
action (4) is enhanced compared to reaction (2). Since the deposition rate increasing frequency as found previously by XPS (because the precursor quantity on the surface is higher), the interface reaction (4) is rapidly stopped because Si atoms diffusion is limited due to the rapid formation of the YOC layer and reaction (3) that leads to the formation of yttrium oxide carbonates becomes the only deposition mechanism. On the contrary, at 1 Hz, i.e., with a low reactant flux, the growth rate is lower (because the precusor quantity on the surface is lower) and reaction (4) will occur for a longer time than during the 5 Hz process because here the YOC layer growth is slower and the Si diffusion is less limited. In this case, reactions that consume silicon near the interface are more likely to occur, i.e., reaction (2), which leads to the formation of a thick SiO2 layer, and reaction (4), which gives a silicate layer (on top of SiO2). Beyond a critical thickness, the deposited layer at 1 Hz will be yttrium oxide (with carbon contamination) without silicon (as found for 40 nm thick layers deposited at 1 Hz), since reaction (4) is limited by the presence of Si atoms. Beyond a critical distance from the substrate, no silicon is available and only reaction (3) occurs. From this study, it appears that a high reactive species flux should be preferred to limit the formation of the interfacial SiO2 layer. D. Effect of substrate temperature
Five different substrate temperatures (in the range 200– 380° C) were investigated for films grown at 1 Hz in the standard conditions given in Table I. A same precursor liquid volume was injected (1000 injections). The films were investigated by XPS (no Ar sputtering was performed prior to measurements since the films were very thin 共⬍10 nm兲). Figure 10 shows the XPS spectra of the Si 2p, Y 3d, and O 1s lines (Si 2p spectra are normalized on Si0). The XPS quantification from C 1s spectra (not shown here) shows that the C content increases with decreasing substrate temperature, as it is expected due to incomplete precursor decomposition. First, it appears that deposition can occur at temperature as low as 200° C. However, the sample grown at 200° C is significantly different with high carbon content with limited yttrium content (mainly in the form of Y-O-C and limited silicate). In the range 250– 380° C, the Y 3d spectra are unchanged. The binding environment of Y is mainly Y-O-Si, as shown previously for the film grown at 350° C 共158.8 eV兲. The O 1s and Si 2p regions indicate that the yttrium silicate thickness increases as compared to the SiO2 one, when the deposition temperature increases (O 1s and Si 2p contributions around, respectively, ⬃531.5 and ⬃102.4 eV increase with increasing temperature). The quantitative analysis of the Si 2p region was done, as previously described (Table II), and the peak area of each Sin+ component (n = 1–4), normalized to the Si0 one, is plotted as a function of temperature in Fig. 11(a). The graph shows that the Si4+ ratio stays roughly constant, which indicates that the SiO2 thickness is not significantly modified in the studied temperature range. On the contrary, the Si2+ and especially the Si3+ components increase with increasing temperature. These two contributions arise from a wide range of silicon
FIG. 10. XPS spectra [(a) Si 2p, (b) Y 3d, and (c) O 1s regions] for samples with increasing deposition temperature [380° C (䊏), 350° C 共쎲兲, 300° C 共䉱兲, 250° C (䉲), and 200° C (〫)]. As Fig. 7, Si 2p spectra are normalized on Si0 peak area (peak from substrate) in order to estimate the oxidized Si-based compound thickness evolution. The spectrum of initial substrate 关Si/ SiO2共0.8 nm兲兴 is also done for comparison.
bonding environments available in Y-O-Si. Such an increase is related to the increase of the yttrium thickness with increasing temperature. In Fig. 11(b), the area ratio ASi-O / ASi component (ASi-O is the sum of all area silicon oxidized components: Si1+, Si2+, Si3+, and Si4+) is represented in an Arrhenius-type plot, which shows the extent of the yttrium silicate thickness versus the inverse of the deposition temperature. The activation energy 共Ea兲 for the silicate formation during deposition is equal to 12.5 kJ/ mol. This value is rather low, which indicates that thermal activation is not significant in this temperature range, as could be expected (precursor’s decomposition requires higher temperatures). E. Electrical characterizations
A typical C-V curve measured with an electrode surface of 0.694⫻ 10−2 mm2 is shown in the insert of Fig. 12 for a film grown at 5 Hz 共⬃40 nm兲. The EOT was extracted from the accumulation capacitance and is plotted in Fig. 12 for three film thicknesses (estimated by x-ray reflectometry). The intercept of the linear fit is equal to 1.7 nm 共±1.3 nm兲.
Downloaded 28 Jul 2004 to 132.168.25.56. Redistribution subject to AIP license or copyright, see http://jap.aip.org/jap/copyright.jsp
1728
Durand et al.
J. Appl. Phys., Vol. 96, No. 3, 1 August 2004
FIG. 13. Leakage current density vs voltage for thick Y2O3 film 共⬃35 nm兲: as-deposited film (䊏), 450° C annealed films under H2 共쎲兲, and 700° C annealed films under Ar 共䉱兲 and O2 (䉲).
FIG. 11. Graph (a). Area ratios determined from the Si 2p fitting model vs the deposition temperature. The graph gives the area ratio Si-O / Si and also area ratio of each oxidation state. Graph (b). Arrhenius diagram of Si-O / Si area ratio vs 1000/T. The activation energy is extracted from the slope.
The effective permittivity of the films extracted from the slope of the linear fit is of 7.5共±1.2兲. This depressed value compared to Y2O3 is consistent with the presence of carbonate and silicate. Annealing of the thick films does not change significantly the EOT. For example, the EOT values extracted from the 1 kHz C-V measurements are 18.8, 17.2, 18.2 and, 16.9 nm for, respectively, as-deposited, 450° C H2 annealed, Ar and O2 700° C annealed samples. Although the 700° C thermal post-treatment significantly reduces the organic contamination and leads to the crystallization of the Y2O3 phase, the EOT value stays constant probably due to the increase of the interfacial layer. The current density measured as a function of applied voltage is plotted in Fig. 13 for a 40 nm thick film (grown at 5 Hz) and annealed samples. Electrical breakdown for the as-deposited film occurs at ⬃34 V (which corresponds to an electrical breakdown field Ebd of the order of 8 MV/ cm) and the film exhibits a low leakage current density (below 10−7 A / cm2 for a bias volt-
age ranging from −20 to 0 V). The dielectric breakdown field values are in good agreement with those expected from the relationship proposed by McPherson et al. that links Ebd and the dielectric constant 关Ebd ⬃ 共兲−1/2兴.55 No significant change is observed on the J(V) curve for the 450° C H2 annealed film. The 700° C annealed films present a lower Ebd and a higher leakage current density, which are attributed to the film crystallization. To conclude, the as-deposited and 450° C-annealed films exhibit promising electrical properties, especially for MIM devices, which requires a low thermal budget.7 IV. CONCLUSION
Yttrium oxide and yttrium thin films were grown by pulsed-liquid-injection PE-MOCVD from Y共tmhd兲3 precursor. The plasma allows a significant reduction of the thermal budget as compared to conventional thermal MOCVD and yttrium silicate films can be grown at temperatures as low as 250° C. Depending on the incoming reactive species flow rate (which is tuned by the injection frequency), a SiO2 or an yttrium silicate interface layer is favored. Beyond a critical thickness, yttrium oxide is formed but the low deposition temperature implies carbon contamination, which can, however, be reduced upon annealing at 700° C. The SiO2 interfacial layer can be limited by increasing the injection frequency (i.e., at 5 Hz). Finally, the as-deposited films exhibit a high electrical breakdown field 共Ebd = 8 MV/ cm兲 and a low leakage current density 共I ⬍ 10−7 A / cm2兲, which is a very promising result for MIM applications. ACKNOWLEDGMENTS
The authors would like to thank warmly N. Rochat for helpful expertise on IR-analysis (FTIR), D. Muyard, G. Rolland, and M. Burdin for XRD analyses. F. Ducroquet is also thanked for helpful discussion on electrical characterizations. L. Vallier is also gratefully thanked for XPS expertise and deposition equipment support. 1
FIG. 12. EOT (equivalent oxide thickness) of films elaborated at 5 Hz using standard conditions (Table I) as a function of the film physical thickness estimated by x-ray reflectivity. The insert shows a C-V curve obtained for the ⬃40 nm yttrium oxide layer.
The International Technology Roadmap for Semiconductors, Semiconductors Industry Association, see also http://public.itrs.net/ for the most recent updates. 2 P. C. Joshi and N. W. Cole, J. Appl. Phys. 86, 871 (1999). 3 S. Blonkowski, M. Regache, and A. Halimaoui, J. Appl. Phys. 90, 1501 (2001). 4 T. Yoshitomi et al., IEEE Bipolar/BiCMOS Circuits Tech. Meet. 1999, 133.
Downloaded 28 Jul 2004 to 132.168.25.56. Redistribution subject to AIP license or copyright, see http://jap.aip.org/jap/copyright.jsp
Durand et al.
J. Appl. Phys., Vol. 96, No. 3, 1 August 2004 5
H. Hu, C. Zhu, Y. F. Lu, M. F. Li, and B. J. Cho, IEEE Electron Device Lett. 23, 514 (2002). 6 S. B. Chen, C. H. Lai, and A. Chin, IEEE Electron Device Lett. 23, 185 (2002). 7 C. Durand et al., J. Vac. Sci. Technol. A 22, 655 (2004). 8 G. D. Wilk, R. M. Wallace, and J. M. Anthony, J. Appl. Phys. 89, 5243 (2001). 9 K. J. Hubbard and D. G. Schlom, J. Mater. Res. 11, 2757 (1996). 10 J. Robertson, J. Vac. Sci. Technol. B 18, 1785 (2000). 11 B. W. Busch, J. Kwo, M. Hong, J. P. Mannaerts, B. J. Sapjeta, W. H. Schulte, E. Garfunkel, and T. Gustafsson, Appl. Phys. Lett. 79, 2447 (2001). 12 T. Gongousi, M. Jason Kelly, and G. N. Parsons, Appl. Phys. Lett. 80, 4419 (2002). 13 D. Niu, R. W. Ashcraft, and G. N. Parsons, Appl. Phys. Lett. 80, 3575 (2002). 14 J. J. Chambers and G. N. Parsons, J. Appl. Phys. 90, 918 (2001). 15 J. J. Chambers and G. N. Parsons, Appl. Phys. Lett. 77, 2385 (2000). 16 M. Copel, E. Cartier, V. Narayanan, M. C. Reuter, S. Guha, and N. Bojarczuk, Appl. Phys. Lett. 81, 4227 (2002). 17 M. Copel, Appl. Phys. Lett. 82, 1580 (2003). 18 S. Stemmer, D. O. Klenov, Z. Chen, D. Niu, W. Ashcraft, and G. N. Parsons, Appl. Phys. Lett. 81, 712 (2002). 19 W. M. Cranton, D. M. Spink, R. Stevens, and C. B. Thomas, Thin Solid Films 226, 156 (1993). 20 R. H. Horng, D. S. Wuu, J. W. Yu, and C. Y. Kung, Thin Solid Films 289, 234 (1996). 21 J. J. Araiza, M. A. Aguilar-Frutis, and C. Falcony, J. Vac. Sci. Technol. B 19, 2206 (2001). 22 E. K. Evangelou, C. Wiemer, M. Fanciulli, M. Sethu, and W. Cranton, J. Appl. Phys. 94, 318 (2003). 23 S. C. Choi, M. H. Cho, S. W. Whangbo, C. N. Whang, S. B. Kang, S. I. Lee, and Y. Lee, Appl. Phys. Lett. 71, 903 (1997). 24 M.-H. Cho, D.-H. Ko, K. Jeong, S. W. Whangbo, C. N. Whang, S. C. Choi, and S. J. Cho, J. Appl. Phys. 85, 2909 (1999). 25 S.-K. Kang, D.-H. Ko, E.-H. Kim, M. H. Cho, and C. N. Whang, Thin Solid Films 353, 8 (1999). 26 R. J. Gaboriaud, F. Pailloux, P. Guerin, and F. Paumier, Thin Solid Films 400, 106 (2001). 27 F. Paumier and R. J. Gaboriaud, Thin Solid Films 441, 307 (2003). 28 M.-H. Cho, D.-H Ko, Y. G. Choi, K. Jeong, I. W. Lyo, D. Y. Noh, H. J. Kim, and C. N. Whang, J. Vac. Sci. Technol. A 19, 192 (2001); M.-H. Cho, D.-H. Ko, Y. G. Choi, I. W. Lyo, K. Jeong, C. N. Whang, H. J. Kim, and D. Y. Noh, ibid. 19, 200 (2001). 29 N. Bassim, V. Cracium, J. Howard, and R. K. Singh, Appl. Surf. Sci. 205, 267 (2003). 30 J. Kwo et al., Appl. Phys. Lett. 77, 130 (2000). 31 J. Kwo et al., J. Appl. Phys. 89, 3920 (2001). 32 T. S. Lay, Y. Y. Liao, W. D. Liu, Y. H. Lai, W. H. Hung, J. Kwo, M. Hong, and J. P. Mannaerts, Solid-State Electron. 47, 1021 (2003).
1729
33
A. C. Rastogi and R. N. Sharma, Appl. Phys. A: Mater. Sci. Process. 77, 93 (2003). 34 S. Guha, E. Cartier, M. A. Gribelyuk, N. A. Bojarczuk, and M. C. Copel, Appl. Phys. Lett. 77, 2710 (2000). 35 G. Apostolopoulos, G. Vellianitis, A. Dimoulas, M. Alexe, R. Scholz, M. Fanciulli, D. T. Dekadjevi, and C. Wiemer, Appl. Phys. Lett. 81, 3549 (2002). 36 Y. Tsuchiya, M. Endoh, M. Kurosawa, R. T. Tung, T. Hattori, and S. Oda, Jpn. J. Appl. Phys., Part 1 42, 1957 (2003). 37 J. P. Sénateur, R. Madar, F. Weiss, O. Thomas, and A. Abrutis, French Patent No. FR 2707671 (1993), European Patent No. EP 730671 (1994), U.S. Patent No. US 945162 (1999). 38 F. Felten, J. P. Sénateur, F. Weiss, R. Madar, and A. Abrutis, J. Phys. IV 5, C5-1079 (1995). 39 C. Dubourdieu, J. P. Sénateur, and F. Weiss, Crystal Growth in Thin Solid Films: Control of Epitaxy, edited by M. Guilloux-Viry and A. Perrin (Research Signpost, Kerala, 2002), ISBN 81-7736-095-7, p. 169. 40 K.-J. Choi, W.-C. Shin, and S.-G. Yoon, J. Electrochem. Soc. 149, F18 (2002). 41 K.-J. Choi, J.-B. Park, and S.-G. Yoon, J. Electrochem. Soc. 150, F75 (2003). 42 B.-O. Cho, J. Wang, and J. P. Chang, J. Appl. Phys. 92, 4238 (2002). 43 D. Niu, R. W. Ashcraft, Z. Chen, S. Stemmer, and G. N. Parsons, J. Electrochem. Soc. 150, F102 (2003). 44 H. Kato, T. Nango, T. Miyagawa, T. Katagiri, K. S. Seol, and Y. Ohki, J. Appl. Phys. 92, 1106 (2002). 45 J. Koo, Y. Kim, and H. Jeon, Jpn. J. Appl. Phys., Part 1 41, 3043 (2002). 46 Y. Kim, J. Koo, J. Han, S. Choi, H. Jeon, and C.-G. Park, J. Appl. Phys. 92, 5443 (2002). 47 J. H. Lee, Y. J. Cho, Y. S. Min, D. Kim, and S. W. Rhee, J. Vac. Sci. Technol. A 20, 1828 (2002). 48 Z. H. Lu, J. P. McCaffrey, B. Brar, G. D. Wilk, R. M. Wallace, L. C. Feldman, and S. P. Tay, Appl. Phys. Lett. 71, 2764 (1997). 49 Handbook of x-ray Photoelectron Spectroscopy, edited by J. Chastain (Perkin-Elmer Corporation, Eden Prairie, MN, 1992). 50 M. D. Ulrich, J. E. Rowe, D. Niu, and G. N. Parsons, J. Vac. Sci. Technol. B 21, 1792 (2003). 51 J. F. Moulder, W. F. Stickle, P. E. Sobol, and K. D. Bomben, Handbook of x-ray Photoelectron Spectrocopy (Perkin-Elmer Corporation, Eden Prairie, MN, 1992). 52 M. L. Green, E. P. Gusev, R. Degraeve, and E. L. Garfunkel, J. Appl. Phys. 90, 2057 (2001). 53 O. Renault, L. G. Gosset, D. Rouchon, and A. Ermolieff, J. Vac. Sci. Technol. A 20, 1867 (2002). 54 C. Durand, C. Vallée, C. Dubourdieu, M. Bonvalot, E. Gautier, and O. Joubert, Mater. Res. Soc. Symp. Proc. 786, E6.15 (2003). 55 J. McPherson, J. Kim, A. Shanware, H. Mogul, and J. Rodriguez, Tech. Dig. - Int. Electron Devices Meet. 2002, 26, 633; J. McPherson, J.-Y. Kim, A. Shanware, and H. Mogul, Appl. Phys. Lett. 82, 2121 (2003).
Downloaded 28 Jul 2004 to 132.168.25.56. Redistribution subject to AIP license or copyright, see http://jap.aip.org/jap/copyright.jsp