nications graphs of emails between Enron executives. .... in the case of star(n), all (nontrivial) induced subgraphs are star(j)'s, for some ..... the Enron scandal.
Minimal Free Resolutions of Enron Graphs David J. Marchette∗
David A. Johannsen∗
Abstract This paper describes initial work investigating the use of computational commutative algebra to study graphs. In particular, the question of whether the minimal free resolution can provide useful insight into the structure of graphs. We review the basic definitions and theorems of edge ideals, and provide an example of a practical application to the communications graphs of emails between Enron executives.
1
Graph Theory
A graph is a pair G = (V, E), where V is a finite set {v1 , . . . , vn }, the vertices, and E is a set of pairs of vertices, the edges. If the pairs in E are ordered, the graph is called a directed graph, or digraph, and the ordering determines the direction of the edge. We will be concerned in this paper with undirected graphs, so the edge pairs in our graphs are unordered. We will usually write vw for the edge {v, w}. The number of vertices of a graph is called the order of the graph. The number of edges is called the size. An induced subgraph of a set of vertices W = {vi1 , . . . , vik } is the graph (W, E 0 ), where E 0 is the subset of E consisting of those pairs containing only elements of W : E 0 = {wi wj ∈ E|wi , wj ∈ W }. Thus, the induced subgraph contains all the edges between its vertices that exist in the original graph. Definition 1.1. The open neighborhood of a vertex v, denoted N (v), is the induced subgraph of {w ∈ V |vw ∈ E}. That is, it consists of all neighbors of v and the edges between them. Note that v 6∈ N (v). The closed neighborhood of v, denoted N [v] is the induced subgraph of {w ∈ V |vw ∈ E} ∪ {v}. Definition 1.2. Given a graph G, define star(G) to be the graph defined by adding a single vertex v to G, with edges from v to each vertex of G. We will denote by star(n) the star on the trivial graph on n vertices. Thus star(n) has order n + 1 and contains one vertex of degree n and n vertices of degree 1. It is worth noting that N [v] is isomorphic to star(N (v)), and we may treat these as equal by the convention that the added vertex is v. Thus, if we know everything about N (v), then we also know N [v]. ∗ Naval Surface Warfare Center, Code {david.marchette,david.johannsen}@navy.mil
1
Q21,
Dahlgren,
VA
22448.
2
Commutative Algebra
Suppose we have a graph G on n vertices {v1 , . . . , vn }. Let k be a field (we may assume for the purposes of this paper that k = C). Let S = k[x1 , . . . , xn ], the ring of polynomials in n variables with coefficients in k. Our notation for edges, vi vj is evocative of monomials, and we make use of this observation in the definition of the edge ideal of a graph. Definition 2.1. The edge ideal of G is the ideal of S generated by the monomials {xi xj |vi vj ∈ E}. Although there is a one-to-one correspondence between the vertices vi and the variables xi , we will keep to the usual naming convention so that it is clear when we are referring to elements of the graph and when we are referring to elements of the ring. For more information on edge ideals see Jacques [2004], Jacques and Katzman [2005], Stanley [1996], Villarreal [2001], Miller and Sturmfels [2005]. We can now use the tools of commutative and algebraic geometry to learn about a graph by studying its edge ideal. One such tool, the one we will be focused on in this paper, is the minimal free resolution. Definition 2.2. An augmented free resolution of an S-module M is an exact sequence of the form 0 ←− M ←− F0 ←− F1 ←− · · · ←− Fm ←− 0 where each Fi is a free S-module (a direct sum of βi copies of S). The image of Fi in the sequence is called the ith syzygy module. Such a resolution is minimal if m is minimal over all such, and each βi is minimal. We define the minimal free resolution of the edge ideal to be the minimal free resolution of S/I, in which case the free resolution becomes: φ0
φ1
φ2
φm
0 ←− S/I ←− S ←− S β1 ←− S β2 · · · ←− S βm ←− 0. The βi are called the Betti numbers. The length of such a resolution is defined to be m. (This is slightly different than the usual definition, which would define the length to be m + 1.) Definition 2.3. The projective dimension of an edge ideal is the length of the minimal resolution. Note that β1 = size(G), and that β0 = 1. We will always report all the Betti numbers, even though the first one will always be 1 for edge ideals. Also, we use the convention that the Betti numbers for the trivial graph are all 0, and it has a length and projective dimension of 0. Note that the Betti numbers contain a lot of information about the graph. As noted above, the first Betti number is the number of edges. It is well known
2
(Jacques and Katzman [2005]) that the second Betti number can be computed by counting the number of induced subgraphs of certain types: β2 = #G (star(2)) + 2#G (K(3)) + #G (star(1) ∪ star(1)),
(1)
where #G (H) is the number of induced subgraphs isomorphic to H in G. Here, K(3) is the complete graph on three vertices (a triangle); see Figure 1 for pictures of the other subgraphs (G1 and G2 in the figure). We will refer to G1 as an “angle” and G2 as “bars” below. The following theorem gives the Betti numbers for star(n). Essentially, all Betti numbers are a weighted sum of certain types of induced subgraphs, and in the case of star(n), all �(nontrivial) induced subgraphs are star(j)’s, for some j ≤ n. Since there are nj of these, and the weights in the sum are 1 (because star(j) is contractible), the result follows. We give a sketch of a constructive proof. Theorem 2.1. The Betti numbers βj for star(n) are � � n βj = j for j = 0, . . . , n. Proof. Sketch of Constructive Proof: Let the vertices be labeled {v, x1 , . . . , xn }, where the degree of v is n. Start at the left end of the exact sequence: φ0
φ1
φ2
φm
0 ←− S/I ←− S ←− S β1 ←− S β2 · · · ←− S βm ←− 0. φ0 is the quotient map. It’s kernel is I. By exactness, the image of φ1 : S β1 → S is I. Thus, β1 = n, and φ1 (ej ) = vxj . We can write this as: (vx1 , . . . , vxn ). The basic idea of the construction is as follows. For each j, the basis for S βj is in one-to-one correspondence with the nontrivial subgraphs of G containing j + 1 vertices: ejI ←→ Ω({v, xi1 , . . . , xij }), where Ω(A) is the induced subgraph of the set A ⊂ V , and I is the index associated to the ordering chosen for the subgraphs. The map φj maps the corresponding basis element to j−1 j−1 j−1 xi1 ej−1 i1 − x i2 e i2 + x i3 e i3 ∓ . . . ± x ij e ij .
ei−1 ik is the basis element corresponding to the subgraph associated with Ω({v, x i1 , . . . , xij }) with the vertex xik removed. By keeping careful track of the notation, one can show that this is in the kernel of φj−1 , and an induction argument can be used to finish the proof. The details are left to the reader. For a more standard proof, we need some machinery. 3
Definition 2.4. A simplicial complex ∆ with vertex set V = {1, 2, . . . , n} is a collection of subsets of V which are closed under the taking of subsets. We also need the definition of a restriction of a simplicial complex to a subset of its vertex set. Definition 2.5. Let ∆ be a simplicial complex with vertex set {1, 2, . . . , n} and let V ⊆ {1, 2, . . . , n}. The restriction of ∆ to V is the subcomplex of ∆ ∆V = {F ∈ ∆|F ⊆ V }. If b ∈ {0, 1}n then the restriction of ∆ to b is ∆b = ∆V where V is the subset of {1, 2, . . . , n} identified with b, i.e., if b = (b1 , b2 , . . . , bn ) then j ∈ V if and only if bj = 1. In the setting of the edge ideal of a graph, recall that we have associated a variable in a polynomial ring for each vertex. Thus, for star(n), we have b = (b1 , b2 , . . . , bn+1 ) := (b1 , b2 , . . . , bn , vδ ), where vδ indicates whether the the vertex v is present in the restriction. That is, for a monomial m(X) ∈ bn+1 C[x1 , x2 , . . . , xn+1 ], say m(X) = xb11 xb22 · · · xn+1 , we say that m(X) has multidegree b = (b1 , b2 , . . . , bn+1 ). Theorem 2.2 (Hochster’s Formula (multi-graded version)). Let k[∆] = R(∆)/I(∆) be the Stanley-Reisner ring of the simplicial complex ∆. The nonzero Betti numbers of k[∆] are only in the squarefree degrees b and may be expressed as ˜ |b|−i−1 (∆b ; k). βi,b = dimk H (2) Of course, if we are not interested in the multi-graded Betti numbers given above (equation (2)), we have the obvious version X ˜ |b|−i−1 (∆b ; k). (3) dimk H βi = |b|
Proof. of Thm. 2.1: Let’s now consider equation (3) in the setting of interest, namely star(n). We first remark that Hochster’s formula simplifies considerably when considering graphs, as they are 1-dimensional simplicial complexes (i.e., ˜ i (∆) = 0, i > 1. However, in the case of star(n), the situation we must have H couldn’t be nicer, star(n) is contractible. Note further, that any restriction that includes v is also contractible, and any restriction not containing v is a disjoint ˜ 0 for various restrictions. collection of points. Thus, we only need to determine H th That is, to compute the i Betti number, βi , we need only consider the case |b| = i + 1 in equation (3). Of course, this amounts to counting the number of subgraphs of given cardinality. One could also use the results on forests in Jacques and Katzman [2005]. The proof sketched above gives explicit description of how the maps are defined, which is sometimes useful. 4
We can use this� theorem to hypothesize the existence of graphs containing star(n): if βj ≥ nj for a given n and all 0 ≤ j ≤ n, then we suspect that the graph contains a copy of star(n) (here we are not assuming that the copy is an induced subgraph; this is equivalent to assuming a vertex of degree n). This is not guaranteed: As seen in Figure 1 below, the Betti numbers for star(2) : 1 2 1 do not guarantee a copy of star(2). We can say some things about how the minimal free resolution of components of a graph relate to the minimal free resolution of the graph. Given G and H graphs, write G ∪ H for the graph which is the disjoint union of G and H. Theorem 2.3. For any graphs G and H: 1. β1 (G ∪ H) = β1 (G) + β1 (H). 2. β2 (G ∪ H) = β2 (G) + β2 (H) + β1 (G)β1 (H). Proof. The first is obvious, since β1 is the size of the graph. The second comes from Equation (1), and is seen by counting the angles, triangles and bars of the resulting graph, and noting that for each pair of edges, one from G and one from H is generated a new “bars” subgraph.
3
Enron Graphs
In 2005, the emails between executives at Enron were made public and were the subject of a workshop on Link Analysis (see www.cs.queensu.ca/home/ skill/siamworkshop.html, Priebe et al. [2005]). The data consist of emails from about 1998 to 2002, and are presented in the mailboxes of 150 executives at Enron. In Priebe et al. [2005], these data were processed into 185 directed graphs, one for each (non-overlapping) week in the data set, with each graph representing the emails between 184 distinct email addresses used by the executives. Each directed edge between nodes represented the fact that an email had been sent; the actual counts of the emails sent within a week were not retained. In this paper we further reduce the information contained in the digraphs by removing the direction: an edge indicates that at least one email was sent from one of the nodes to the other within the week. All count and directional information is removed. Thus we are analyzing 185 graphs. In Priebe et al. [2005] a scan statistic on graphs was defined, and various detections of unusual patterns of communications were illustrated. In this paper we will use the minimal free resolution of open neighborhood graphs to illustrate other types of interesting structure in these graphs. An alternative approach to using neighborhoods would be to compute minimal free resolutions on the full graphs, and use these to analyze the time series of graphs. Unfortunately with the algorithms currently available to us, this is impractical. We will be using the minimal free resolutions of the open neighborhoods in our analysis, so it is worth noting that knowing this is not enough to tell
5
G1
G2
star(G1)
star(G2)
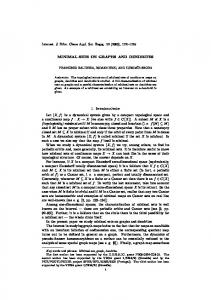
Figure 1: Two graphs (G1 and G2 ) with the same minimal free resolution, where star(G1 ) and star(G2 ) have very different minimal free resolutions. us the minimal free resolution of N [v]. A trivial example will show this. Let G1 = star(2) and G2 = star(1) ∪ star(1) (see Figure 1). Here the minimal free resolutions of G1 and G2 are the same, with Betti numbers: 1 2 1, but their stars have very different minimal free resolutions: star(G1 ) has Betti numbers: 1 5 6 2, while star(G2 ) has Betti numbers: 1 6 9 5 1. Note that these don’t even have the same projective dimension. The β1 values are easy to see by counting edges. The two graphs do not have the same number of edges, so they cannot be isomorphic, and their free resolutions cannot be equal either. Thus, one cannot simply use the minimal free resolution of the open neighborhood to infer the minimal free resolution of the closed neighborhood. More information about the structure of the one neighborhood is required. However, in this paper we will operate on N (v) partly for computational reasons. Existing software (Singular (Greuel and Pfister [2002], Macaulay2 (Eisenbud et al. [2002])), have difficulty computing the minimal free resolutions for graphs of order much larger than 20, yet for the Enron graphs there are no problems with computing the resolutions for the open neighborhoods of all the vertices in all the weeks (with the exception of six, as discussed below). Figure 2 shows the size and order of the graph compared with the maximum projective dimension of the open neighborhoods. A smooth of these dimensions is shown in red. Figure 3 shows the same plot, only using the maximum neighborhood size in place of graph size. Note that in both cases, with a few exceptions, two of which we will discuss in some detail below, the projective 6
150
10 8 6
50
Projective Dimension
100 Graph Order
10 8 6
Projective Dimension
12
12
14
14
300 250 200 150
Graph Size
4
4
100
50
100
150
0
0
0
2
2
50 0 0
0
Week
50
100
150
Week
Figure 2: Sizes (left) and orders (right) and maximum projective dimensions of the weekly graphs of the Enron email data. The red curve in each plot is a smooth fit to the projective dimensions. dimensions track these sizes to some extent. In order to avoid extensive computational time, we only ran the minimal free resolutions code for those open neighborhoods with 21 or fewer nodes. There were six nodes whose open neighborhoods were larger than this, after removing isolated vertices. They occurred in weeks 126, 129, 143, 149, and 166 (two such in the latter). We plot the (log of the) maximum Betti numbers in Figure 4, compared to the sizes of the graphs. The “+1” in the log is an artifice to handle the case where the open neighborhood is trivial. It has no effect on the interpretation of the plots. It is interesting that the two red curves in Figures 2 and 4 appear so similar. It turns out, for these graphs, the maximum projective dimension is linearly related to the log of the maximum Betti number, as shown in Figure 5 (the regression line has a slope of 0.62349). The individual subgraphs that were too large for the software to compute the resolutions in a reasonable amount of time are plotted in Figures 6-8. Clearly faster algorithms, specifically designed to handle edge ideals rather than general ideals, are needed. Running on the open neighborhood rather than the closed neighborhood helps (the complexity of the algorithm is dependent both on the order and the size of the graph), but one would prefer to not have to. The central figures in these graphs will be well known to those familiar with the Enron scandal. This provides some evidence that the use of neighborhoods to analyze the communications network may be justified for more than purely computational reasons. The projective dimension gives a crude measurement of how “complex” the induced subgraph of the open neighborhood is. As can be seen by the plot in Figure 3, the projective dimension is highly correlated with the size of the
7
25
14 12 10 6
8
Projective Dimension
20 15 10
Neighborhood Size
0
2
4
5 0 0
50
100
150
Week
6 4
log(max β + 1)
200 150
0
0
50
2
100
Graph Size
250
8
300
Figure 3: Maximum neighborhood sizes and maximum projective dimensions of the weekly graphs of the Enron email data.
0
50
100
150
Week
Figure 4: Graph sizes and the log of the maximum Betti numbers for the open neighborhoods of the weekly graphs of the Enron email data. The red curve is a smooth on the Betti numbers.
8
8 0
2
4
log(β)
6
8 6 log(β) 4 2 0
5
10
15
5
Projective Dimension
10
15
Projective Dimension
Figure 5: Projective dimension versus the log of the maximum Betti numbers for the open neighborhoods of the weekly graphs of the Enron email data. A linear regression line is shown. The sunflower plot on the right shows the amount of overplotting in the figure. Only those graphs for which the maximum Betti number is greater than 0 are plotted.
hunter.shively frank.ermis geoff.storey fletcher.sturm harry.arora f..keavey h..lewis f..brawner hunter.shively eric.saibi james.steffes eric.bass jane.tholt don.baughman jay.reitmeyer diana.scholtes jeff.king david.delainey jim.schwieger dana.davis joannie.williamson clint.dean joe.parks chris.germany joe.quenet chris.dorland john.arnold brad.mckay john.forney bill.williams andy.zipper john.zufferli andrew.lewis jonathan.mckay andrea.ring juan.hernandez a..martin john.lavorato judy.townsend k..allen w..pereira keith.holst vladi.pimenov kevin.presto tori.kuykendall kevin.ruscitti tom.donohoe larry.may thomas.martin l..gay susan.pereira liz.taylor steven.south l..mims s..shively martin.cuilla scott.neal matthew.lenhart scott.hendrickson matt.motley sandra.brawner mike.carson robert.benson mike.grigsby robert.badeer mike.maggi richard.shapiro mike.swerzbin randall.gay monique.sanchez phillip.allen m..tholt peter.keavey patrice.mims
james.derrick harry.arora jeffrey.shankman greg.whalley jeff.skilling fletcher.sturm jim.schwieger david.delainey joannie.williamson
danny.mccarty
john.arnold
dana.davis
john.zufferli
barry.tycholiz
jonathan.mckay kenneth.lay kevin.presto
andy.zipper a..martin
john.lavorato
thomas.martin
liz.taylor
steven.kean
louise.kitchen
stanley.horton
mark.haedicke
s..shively
mike.grigsby scott.neal mike.mcconnell richard.shapiro sally.beck mike.swerzbin rod.hayslett phillip.allen rick.buy
Figure 6: Subgraphs of week 126, vertex 83 and week 129, vertex 83.
9
frank.ermis f..keavey geoff.storey f..brawner greg.whalley errol.mclaughlin harry.arora eric.saibi h..lewis eric.bass james.derrick e..haedicke jason.wolfe dutch.quigley jay.reitmeyer don.baughman jeff.king david.delainey j..farmer dana.davis jim.schwieger clint.dean j..kean brad.mckay joannie.williamson benjamin.rogers joe.parks a..shankman joe.quenet andy.zipper sally.beck joe.stepenovitch a..martin w..white john.arnold tom.donohoe john.griffith stanley.horton john.lavorato s..shively j..sturm scott.neal juan.hernandez scott.hendrickson k..allen kam.keiser rod.hayslett keith.holst robert.benson kenneth.lay rick.buy larry.campbell paul.thomas larry.may m..love l..gay mike.mcconnell l..mims mike.maggi louise.kitchen mike.carson martin.cuilla m..forney
errol.mclaughlin dutch.quigley e.taylore..haedicke d..steffes greg.whalley don.baughman harry.arora david.delainey james.derrick danny.mccarty jason.wolfe dana.davis jay.reitmeyer cooper.richey j.harris charles.weldon j.kaminski benjamin.rogers j..kean barry.tycholiz john.arnold a..shankman john.lavorato andy.zipper john.zufferli a..martin kenneth.lay j..sturm w..white juan.hernandez vladi.pimenov k..allen stanley.horton kam.keiser s..shively l..gay scott.neal louise.kitchen sally.beck mark.whitt rod.hayslett matthew.lenhart rick.buy matt.smith richard.shapiro mike.grigsby m..scott mike.mcconnell m..presto mike.swerzbin monique.sanchez m..love monika.causholli
Figure 7: Subgraphs of week 143, vertex 95 and week 149, vertex 154.
greg.whalley john.lavorato elizabeth.sager john.zufferli e..haedicke
e..haedicke d..thomas elizabeth.sager d..steffes eric.bass don.baughman eric.saibi diana.scholtes f..brawner dana.davis frank.ermis craig.dean geir.solberg cooper.richey geoff.storey chris.dorland greg.whalley charles.weldon h..lewis barry.tycholiz jason.wolfe
andrea.ring
jay.reitmeyer
a..martin
jeff.king
d..steffes dana.davis
andy.zipper
holden.salisbury
john.griffith
j..sturm k..allen
liz.taylor
liz.taylor
albert.meyers
barry.tycholiz
marie.heard
louise.kitchen
a..martin
vladi.pimenov
john.lavorato
t..hodge
john.zufferli
tana.jones
michelle.cash
s..shively jonathan.mckay scott.neal j..sturm ryan.slinger judy.townsend robert.benson k..allen m..tholt keith.holst m..presto larry.may l..mims mike.swerzbin louise.kitchen mike.maggi marie.heard mike.grigsby matthew.lenhart mike.carson
w..white
mike.carson mike.grigsby
t..hodge tana.jones
mike.swerzbin s..shively m..prestosally.beckscott.neal
Figure 8: Subgraphs of week 166, vertex 106 and vertex 108.
10
Figure 9: Resolutions for each node in time. The resolutions are color coded, so that the first 9 Betti numbers are different colors, and all subsequent Betti numbers are colored red. neighborhood. Note, however, that for the graph in week 41 (and to a lesser extent, that in week 113) the projective dimension is higher than would be accounted for by the number of edges, and hence contains more information. Obviously, even more information is contained in the resolution itself. In Figure 9 we provide a view of the resolutions for all nodes in all times. There is obviously considerable overplotting in this plot, but one can see certain obvious patterns, such as the increasing projective dimension and the increasing maximal total Betti numbers up until around 2001-2002. Figure 10 shows the graph for week 41, the first obvious outlier in the data. (In all such plots we will remove any isolated vertices in the open neighborhoods, besides the central vertex, since they do not contribute to the minimal free resolution.) This is one of the two open neighborhoods for which the projective dimension attains the maximum for that week. This has Betti numbers: 1 11 39 95 126 126 84 36 9 1. Note that the Betti numbers for star(9) are 1 9 36 84 126 126 84 36 9 1, leading us (without cheating and looking at Figure 10) to hypothesize a subgraph of the open neighborhood isomorphic to star(9), and in fact there is one. The difference between these two resolutions tell us that there are two extra edges, (β1 = 11 instead of 9) resulting in a number (84 − 36 = 48 extra contributions of the angle, triangle, bars subgraphs discussed above. We posit no higher order structures, and upon viewing the figure, we see that in this case our hypothesis is born out. Figure 11 shows all the nontrivial open neighborhoods in this graph. As
11
jeffrey.hodge
elizabeth.sager
louise.kitchen
marie.heard
debra.perlingiere
mark.taylor
sara.shackleton
dan.hyvl
tana.jones
stacy.dickson
susan.bailey
Figure 10: The neighborhood for week 41. The edges from the central vertex are gray, the darker edges indicating the edges between the vertices in the open neighborhood of the center vertex. one might guess, there is a second copy of the graph we found, due to the fact that Mark Taylor and Tana Jones have the same open neighborhoods. (Note that we could not have known this from only the plot in Figure 10, but the fact that this neighborhood attains the maximal projective dimension supports the hypothesis that the open neighborhood of Tana Jones is no more complex than that of Mark Taylor, as in fact is the case.) Figure 12 shows the other outlier in the projective dimension plot, which has Betti numbers: 1 18 112 365 727 971 905 589 262 76 13 1. The largest star this could contain, is star(11), with Betti numbers: 1 11 55 165 330 462 462 330 165 55 11 1. In this case the graph does not contain this maximal star graph. The large Betti numbers (and large projective dimension) come from the fact that there are several vertices with degree larger than 1, and hence there is quite a bit of structure to this subgraph. The graph is connected, and the largest degree of a vertex is 5, hence the largest star it contains is star(5). This illustrates the fact that more work must be done in understanding the information provided by the minimal free resolution. There are a number of other weeks we could investigate. In Figure 3 there are a number of high values of the projective dimension between weeks 139 (the first major spike) and week 149 (the spike just before the mode of the red curve). There are 5 weeks with projective dimension above 10, while the rest of 12
11
11
11
11
11
132
1 11 39 85 126 126 84 36 9 1
1562
11
132
1 11 39 85 126 126 84 36 9 1
Figure 11: The nontrivial neighborhoods for week 41. The Betti numbers for each graph are displayed. The gray edges are the edges from the central vertex v of N (v).
13
jane.tholt
frank.ermis errol.mclaughlin
jason.wolfe
eric.bass
jay.reitmeyer
dutch.quigley
kam.keiser
darron.giron
monique.sanchez
keith.holst
andrew.lewis
matthew.lenhart
tori.kuykendall
matt.smith
susan.scott
mike.grigsby
steven.south
phillip.allen randall.gay phillip.love
Figure 12: The neighborhood for week 113. The edges from the central vertex are gray, the darker edges indicating the edges between the vertices in the open neighborhood of the center vertex. the maximal projective dimensions in this range average just under 6. There are other such “detections” of interesting deviations from the “norm” that could be investigated.
4
Future Work
It is clear from the above discussion that faster algorithms are needed. To be practical for many real-world applications, one must be able to operate on graphs with many hundreds to thousands of vertices. Even using neighborhood subgraphs such as we have investigated in this work, it is not uncommon to have neighborhoods with many tens of vertices in many problems. Even fast algorithms that provided only approximate values for the Betti numbers would be of value here. This work has been exploratory and to a large degree ad hoc. A better understanding of the information contained in the minimal free resolution would allow a tailoring of the statistic to the detection of particular structures of interest. This is one of the main areas of future research. The meaning of the first Betti number is clear (the size of the graph) and we have indicated above one way of thinking about the second, in terms of the numbers of triangles, angles and bars. Other characterizations have been made, for instance Villarreal [2001] shows a relationship between the second Betti number and the number
14
121
11
15741
11
11
11
121
11
132
1331
121
11
11
1 9 32 59 62 38 13 2
11
11
11
11
15741
121
121
121
132
121
1562
11
11
15851
15741
11
1 8 15 12 5 1
*
1562
16951
11
132
11
11
11
16951
1562
132
132
1331
1 8 18 17 7 1
121
121
Figure 13: The nontrivial neighborhoods for week 113. The Betti numbers for each graph are displayed. The maximum projective dimension subgraph, indicated by the “*”, has Betti numbers: 1 18 112 365 727 971 905 589 262 76 13 1. 15
of triangles in the graph plus the number of edges in a derived graph (the line graph). Clearly the Betti numbers provide a lot of interesting information about the graphs, and it would be useful if this could be exploited. We have ignored the time-series nature of the graphs in this paper. It would be trivial to incorporate the projective dimension within the scan statistic framework of Priebe et al. [2005]. Similarly, one could select a (fixed) number of Betti numbers, and develop a multivariate version of the scan statistic. A more difficult problem would be to incorporate the full minimal free resolution into the scan statistic framework. To do this, one would need a way of comparing minimal free resolutions which may have different lengths. Such a comparison should be designed with a particular purpose in mind. Thus, a better understanding of how the minimal free resolution can be linked to specific problems is needed. This is an area of active research.
Acknowledgments This work was funded in part by the Office of Naval Research under the In-House Laboratory Independent Research program.
References David Eisenbud, Daniel R. Grayson, Michael Stillman, and Bernd Sturmfels, editors. Computations in Algebraic Geometry with Macaulay 2, volume 8 of Algorithms and Computation in Mathematics. Springer, New York, 2002. Gert-Martin Greuel and Gerhardt Pfister. A Singular Introduction to Commutative Algebra. Springer, Berlin, 2002. Sean Jacques. Betti numbers of graph ideals. PhD thesis, 2004. Sean Jacques and Mordechai Katzman. The betti numbers of forests, 2005. URL http://arxiv.org/pdf/math.AC/0501226.pdf. Ezra Miller and Bernd Sturmfels. Combinatorial Commutative Algebra, volume 227 of Graduate Texts in Mathematics. Springer, New York, 2005. C. E. Priebe, J. M. Conroy, D. J. Marchette, and Y. Park. Scan statistics on enron graphs. Computational and Mathematical Organization Theory, 11: 229–247, 2005. Richard P. Stanley. Combinatorics and Commutative Algebra. Birkhuser, Basel, second edition, 1996. Rafeal H. Villarreal. Monomial Algebras, volume 238 of Monographs and Textbooks in Pure and Applied Mathematics. Marcel Dekker, Inc., New York, 2001.
16