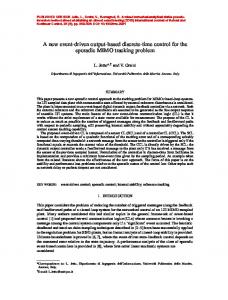
Author manuscript, published in "31st IEEE International Conference on Local Computer Networks (2006)"
Minimizing Cache Misses in an Event-driven Network Server: A Case Study of TUX Sapan Bhatia Georgia Institute of Technology Atlanta, Georgia
[email protected]
Charles Consel Phoenix group, INRIA Talence, France
[email protected]
inria-00353573, version 1 - 15 Jan 2009
Abstract
ability of such servers. Event-driven programming with some degree of explicit support to make for scalable I/O operations [2, 3] has emerged as the paradigm believed to be the most robust to heavy loads because of its low OS overhead and offering of flexible scheduling. With the increase in the size of the main memory available on server systems, the contribution of I/O operations to the request processing overhead of servers has diminished considerably. This phenomenon has led to the emergence of a second category of servers with distinct performance characteristics. Specifically, workloads on such servers involve resources that fit completely in the main memory of the server. These servers are referred to as CPU-bound network servers. In this paper, we consider the performance of CPUbound network servers, in which the contribution of I/O operations to the average processing time of requests can be neglected. In practice, many common configurations of web, telephony and other servers fall into this category. A common feature of such servers is fact that the request traffic they receive is non-uniform, with marked load spikes triggered by specific real-world events. 1 Heavy workloads on such servers refer to data that not only remain in core, but is often very small in size, consisting of a small set of highly solicited files or records. Also, some categories of servers such as telephony servers [5] inherently access relatively small amounts of data to perform their function. To be scalable and efficiently handle heavy loads, CPUbound network servers must effectively exploit data locality. This is becoming especially important with the increasing disparity between processor speeds and memory access times. Although this importance has been emphasized in the past [6], little is done in present-day network servers to expressly avoid memory accesses. Set-associative caches and compiler-enabled cache optimizations [7] reduce cache collisions in contemporaneously accessed data to a certain extent. However, under heavy loads, these optimizations are often rendered ineffectual. Increasing the number of concurrent requests also increases the amount of data treated
We analyze the performance of CPU-bound network servers and demonstrate experimentally that the degradation in the performance of these servers under highconcurrency workloads is largely due to inefficient use of the hardware caches. We then describe an approach to speeding up event-driven network servers by optimizing their use of the L2 CPU cache in the context of the TUX web server, known for its robustness to heavy load. Our approach is based on a novel cache-aware memory allocator and a specific scheduling strategy that together ensure that the total working data set of the server stays in the L2 cache. Experiments show that under high concurrency, our optimizations improve the throughput of TUX by up to 40% and the number of requests serviced at the time of failure by 21%.
1
Julia Lawall DIKU, University of Copenhagen Copenhagen, Denmark
[email protected]
Introduction
To make information services readily available at the scale at which they are sought on the Internet, network servers need to be scalable. Two main factors contribute to this requirement. First, server loads are known to be highly variable, and can increase manifold with a sudden increase in the popularity of the served resources, stressing servers unexpectedly. The Slashdot effect [1] on web servers is a well-known example of this phenomenon. Second, recent advances in signal transmission media have achieved high data-transmission rates with low error rates, shifting the performance bottleneck from the physical media to the network server itself. This makes it essential for servers to be optimized for performance, and programmed so as to leverage the increasing computational bandwidth of the underlying hardware to achieve scalability. When the amount of data manipulated by the server is large, its throughput is limited by I/O activity such as disk reads. Even though such servers often perform aggressive caching, the amount of data requested concurrently is so large and varied that some amount of disk activity is inevitable. Much research has been done to improve the scal-
1 As an example, we found out that the information site of the Sydney Olympic Games, which was served entirely out of RAM [4]
1
inria-00353573, version 1 - 15 Jan 2009
2
Cache-Related Slowdowns
Cache usage is said to be poor when cached items are evicted regularly prior to being used, resulting in frequent memory accesses. Poor cache usage is observed in two main situations that result in data and instruction cache misses respectively. These situations are discussed below. Data-cache misses due to an explosion in total perrequest data. When the amount of per-request data exceeds a certain threshold, the total live data set at certain stages can no longer be accommodated in the hardware caches, causing the eviction of live cache items. Such situations are most commonly observed in high-concurrency workloads, which increase the volume of per-request data by virtue of an increased number of concurrent requests. Figure 1 illustrates this behavior for an unmodified TUX web server running on Linux 2.6.7.3 We find that through-
10000
Req/s
8000 6000 4000 2000 1
40000
10
100 1000 Concurrency
(a) Throughput
L2 cache misses L2 i-cache misses 30000 Samples
by the server at a time, generating a high rate of data-cache misses. We perform a workload-oriented optimization of CPUbound network servers, favoring in-core workloads. Using a cache-aware memory allocator and a specific scheduling strategy, we try to ensure that the current working set of the server remains in the L2 cache. If it overflows, then we ensure that it does so gracefully. Our approach does not impact the behavior of the server with respect to I/Obound workloads. Furthermore, since increasing the size of the served resources moves the bottleneck of operation towards the underlying transport layer and the network, the throughput benefits of our approach are best observed for workloads requiring access to small amounts of data. The cache optimizations described in this paper are optimistic, and are guided by code annotations provided by the server programmer. The annotations guide a kit of program analysis and transformation tools that we have developed. These tools parse and analyze event-driven servers written in the C language, and modify their memory management behavior to use our optimization strategy. They also generate program-specific library functions that can be used to modify the scheduling behavior of the application. We have used these tools to optimize the TUX web server.2 TUX is widely regarded to be a high-performing Web server [8], and thus, speedups in TUX are a strong indication of the effectiveness of our approach. The design and implementation of the TUX web server is used to describe caching problems in servers as well as to illustrate our approach in detail in the rest of the paper. The remaining sections of the paper are organized as follows: Section 2 explains slow-downs in servers caused due to cache inefficiencies. Section 3 gives an overview of our optimization approach. Section 4 presents a case-study in which we apply our approach to TUX. Section 5 evaluates our approach experimentally. Section 6 presents related work, and finally, Section 7 concludes.
20000
3500 3000 2500 2000 1500
10000 0
10000
1000 1
500 10 100 1000 10000 Concurrency
(b) L2 Cache misses
Fig. 1. (a) Throughput degradation in the TUX web server with increasing concurrency (b) Corresponding increase in L2 cache misses (d-cache on the left and i-cache on the right)
put degrades and L2 data cache misses increase steadily as concurrency increases, up to about 4000 concurrent connections. From here on, performance continues to degrade even though L2 cache misses decrease sharply. We attribute the former effect to an explosion in the amount of per-request data and the latter to the fact that the server is close to overload. When the server is overloaded, it does not have sufficient resources to accept new incoming connections, causing incoming connections to either remain incomplete or be rejected [9]. This reduces the number of concurrent requests and hence the amount of per-request data as well. Instruction-cache misses due to request scattering. Servers inherently benefit from the instruction cache by virtue of executing the same instructions repetitively in different request contexts. When a batch of instructions is applied to consecutive incoming requests, the second and consecutive applications can be expected to yield instruction cache hits. Very often, though, batches are received at intervals of time that are shorter than the time of treatment of a single request but longer than that of individual stages. This causes requests to be scattered in the processing graph of the server, resulting in competition amongst the stages involved for the instruction cache. Such an increase in the number of i-cache misses being used can be observed in the leftmost part of Figure 1(b). As concurrency decreases below 40, we find that throughput drops (and response time increases), as low overall concurrency implies low stage concurrency. One prominent indi-
2 TUX 3 Our
is commercially distributed as the Redhat content accelerator experiments with other servers (e.g. thttpd, boa, mathopd and
Apache) have yielded results that are comparable to those in TUX.
inria-00353573, version 1 - 15 Jan 2009
cation of this effect is the decreasing number of bus transactions required for instruction fetches (i.e., L2 instruction cache misses), as concurrency increases. Thus, although the total L2 cache misses increase, the decrease in L2 i-cache misses for concurrency less than 40 compensates for them, and there is an improvement in throughput. Exceptionally, for concurrency less than 10, we observe low performance in spite of few cache misses. The apparently low performance during this phase results from the fact that the CPU and caches are under-utilized, and the load is far too low to exercise the full computational bandwidth of the server. We conclude from these two contradicting considerations, that the strategy used to manage requests in a server must make a tradeoff between these two effects. In particular, throttling the number of requests treated at various stages to avoid an explosion in per-request data must be balanced with accumulating requests to favor the instruction cache. Since the degradation in performance due to the former effect is the dominant one, our strategy revolves around trying to eliminate data-cache misses, while at the same time reconciling the instruction-cache criterion.
methodology in the context of static workloads. Our optimizations are applied to an event-driven server through automated tools. These tools include an analysis stage and a transformation stage. The analysis determines the amount of stack, global and per-request data used by the server. The transformations then generate a customized memory allocator that maintains the memory objects discovered by the analysis in a cache-aligned memory region, and modify the server to request these objects from the allocator. Specifically, for each object allocated as part of the perrequest data, the allocator maintains a pool of pre-allocated objects that are initialized and handed out when the server requests them. Since it is inefficient to have the allocator make the decision as to whether a free object is available for every allocation separately, we propagate part of this effort into the scheduler, which applies it to batches of requests. The scheduling strategy also includes a criterion to try to exploit instruction cache locality by accumulating requests. These aspects are described in more detail in the following sections.
3
3.2
Cache Optimizing CPU-Bound Servers
In this section, we present our approach to use a cacheaware memory allocator, Stingy, in coordination with a specific scheduling strategy to optimize an event-driven network server. We will describe its application to TUX in much greater detail and with concrete examples in the following section. A presentation of this methodology from the programming-language point of view, focusing on the program analyses involved can be found elsewhere [10]. 3.1
In a nutshell
Although servers manipulate very specific data, typical global optimizations [11, 12] performed to organize them in a cache-friendly way are ad-hoc and do not necessarily lead to efficiency. Our approach is to deploy a memory allocator that allocates memory objects from a region that is laid out with a knowledge of the underlying cache. This layout ensures that every location in the region maps into a unique region in the L2 cache. The result is that the objects allocated are also guaranteed not to conflict with one another. This strategy is much more aggressive than the current approaches for cache-friendly allocation in OSes such as the Slab allocator [11], and exploits the flexibility of scheduling of the application and the knowledge of its structure, as they permit one to predict the lifetime properties of the various data manipulated. Currently, only the data manipulated by the server are managed by the allocator. Library functionalities on which the application depends use their default allocation strategy. The same applies to dynamic services. We set aside these extensions for future work. For dynamic services, we envisage specific interfaces to the server that enable them to manipulate memory objects in a cache-aware way. In this work, however, we provide the basis for our optimization
From the implementer’s point of view
The approach to optimizing an existing server consists of four steps, each performed with the help of a specific tool. The steps to be performed are: (i) Analyzing memory usage, (ii) Generating a customized memory allocator, (iii) Modifying the server to use the customized allocator (iv) Modifying the server’s scheduler. The first three steps are automated, subject to a preparatory step to bring the server into a format that can be analyzed by the tools. The fourth step must be carried out manually, but can use certain library functions generated by the first three.
4
Case Study: TUX
In this section, we describe the effort of applying our approach by explaining the steps listed in the previous section in the context of TUX. However, first, we give an overview of how to prepare the server for our tools. 4.1
Preparatory step
The tools that are used to apply our approach operate on event-driven programs whose scheduling and memory management activities can be summarized using the constructs specified in Figure 2. Figure 2 also gives the names of the concrete functions in TUX implementing these constructs. If certain statements bypass these constructs by accessing low-level data structures directly, then wrapper functions must be introduced. This may happen, for instance, if a stage is queued in the context of a request by directly manipulating the data structure defining the request context instead of doing so by invoking Schedule Stage. In TUX, we did not require any such rewriting. The above interface is described through source-code annotations such as the ones illustrated in Figure 3. The add tux atom function is identified as the interface construct QueueStage. Its first argument is labeled with “T”, indicating that it represents
Construct Queue Stage : S × T → void Schedule Stage : S × T → void Scheduler : void → void M alloc : int → O
Description A function that queues a request to be executed at a particular stage. A function to execute a stage in the context of a request. Entry point into the implementation of the scheduler. A function to allocate a block of memory for object O.
Implementation in TUX add tux atom tux schedule atom event loop kmalloc,kmalloc req,get abuf, sock alloc,kmem cache alloc kfree, kfree req,sock release, kmem cache free,free abuf
F ree : O → void
A function that frees the memory allocated for object O.
Where, S ⊂ [0, ∞) T ⊂ [0, ∞) O
is the set of stages. is the set of request. is the set of objects used by various stages in the course of processing requests.
Fig. 2. Set of abstractions supplied as input to the analysis tools.
inria-00353573, version 1 - 15 Jan 2009
v o i d a d d t u x a t o m ( t u x r e q t ∗r e q , a t o m f u n c t ∗atom ) attribute ( ( QueueStage ( ”T” ,” S ” ) ) ) ; v o i d ∗t u x m a l l o c ( i n t s i z e ) attribute ( ( Malloc ( ” i n t ” ) ) ) ; v o i d k f r e e ( v o i d ∗mem) attribute ( ( F r e e ( ”O ” ) ) ; s t a t i c int event loop ( threadinfo t ∗t i ) attribute (( Scheduler ) ) ; t u x r e q t ∗t u x m a l l o c r e q ( ) ; t u x r e q t ∗t u x m a l l o c r e q w r a p ( i n t s i z e ) { return ( tux malloc req ( ) ) ; }
parse_request [nf=47,sc=846]
http_lookup_vhost [nf=6,sc=413]
http_process_message [nf=45,sc=234]
http_post_header [nf=1,sc=20]
http_dirlist_head [nf=6,sc=72]
list_directory [nf=2,sc=642]
Fig. 3. Example annotations and wrappers for TUX.
do_dir_line [nf=3,sc=1140]
http_send_body [nf=7,sc=72]
http_dirlist_tail [nf=9,sc=80]
do_send_abuf [nf=71,sc=56]
flush_request [nf=1,sc=0]
the task context, and the second with “S”, indicating that it represents the stage to be queued. Similarly, the functions tux malloc and tux free are identified as the Malloc and Free constructs respectively. The tux malloc req function, used to allocate a request data structure, cannot be labeled directly as it does not accept any argument corresponding to the size of the allocated data. This function must hence be wrapped in a new function that accepts as argument the object size. 4.2
Memory analysis with memwalk
The tool memwalk provides conservative approximations of three quantities: (i) The amount of stack used by the program (ii) The amount of per-task state allocated and deallocated, categorized for the various objects. (iii) The amount of global state used by the program. It does so by first discovering the overall control-flow of the server and summarizing it in a data structure called a Stage Call Graph (SCG), which contains the stages of an event-driven server at its nodes and events at the edges. The SCG extracted for TUX is shown in Figure 4 (edge labels omitted). 4.3
Generating a customized allocator using stingygen
The tool stingygen accepts the output of the tool memwalk and generates a memory map that contains an area dedicated to each region of memory identified by memwalk. The region corresponding to per-request data contains a sub-region for each object type. Two objects
Fig. 4. Memory usage analysis of TUX.
that may not be live at the same time can share such a subregion. The schema of this memory map is shown in Figure 5. The memory map consists of three parts: (i) the cache slab, which overlaps with the L2 cache, (ii) the low slab, which lies below the cache slab (iii) the high slab, which lies above the cache slab. The cache slab contains all the data of the server under normal circumstances, and is the part in which the stack, global data and per-request data are arranged. It is laid out in such a way that distinct locations in it map into distinct locations in the L2 cache. On the x86 architecture, this amounts to using a range of physically contiguous memory. The role of the low and high slabs is described later in this section. The remainder of the section provides details on the arrangement of the specific regions: The stack is maintained at the lowest addresses of the cache slab, with the low slab to back it up. Since the stack grows downwards, a stack overflow causes data on the stack to spill into the upper part of the low slab. This situation can result if the estimation of stack utilization is too optimistic, underestimating the amount of stack memory required. Although this spill of data into the low slab may cause cache misses, this arrangement ensures that such a misestimation does not overwrite other program data or cause a memory access violation.
inria-00353573, version 1 - 15 Jan 2009
Fig. 5. Layout of the Stingy allocator’s memory pool.
Global data are maintained in the region just above the stack area. This choice is motivated by the fact that the size of globals is known before-hand and fixed, and so we are assured that they will not need to be spilled into the regions above or below. Per-request data are maintained in the upper (dominant) region of the cache slab. Each object is allocated a portion of this region, with the size as calculated in the analyses described in the previous section. The reason we choose the uppermost region of the cache is to be able to spill data into the high slab in case it is infeasible to store it all in the cache slab. Such situations arise particularly when the size of an object allocated is workload-specific, in which case, a conservatively approximated amount of space can be reserved in the cache slab, and the worst-case amount in the high slab.
then iterates through this set of active requests, scheduling each request in the context of the request’s current stage. A high-level view of the scheduler of TUX is shown in Figure 6(b). This scheduler is similar, but not identical. The key difference between the scheduler of TUX and the one shown in Figure 6(a) is that the former considers the requests with I/O completed as a part of the total set of active requests to be treated. A stage may terminate at an arbitrary point, and the request made eligible to be scheduled in the next stage. All requests waiting to be processed are thus considered by the scheduler. Requests that have just completed an I/O action are added to the set of active requests asynchronously by the helper processes. The scheduler orders requests on the basis of their priority. Accepting new requests is given the highest priority by treating all incoming requests before considering requests at other stages. 4.5.2
Our scheduling strategy
The last step in enabling the Stingy allocator is to modify the scheduler to support it. Before we describe the concrete modifications to make and propose strategies to best go about the process, we will describe the usual implementation of schedulers in event-driven programs.
Our scheduling strategy requires the inclusion of two criteria in the scheduler. The first is support for the Stingy allocator. The scheduler must check if enough per-request memory is available for a request before it is elected. This is done by invoking the query function generated by the tool stingygen. The second criterion is to favor the instruction cache by bringing requests in early stages of processing up to the mark with requests in advanced stages. These criteria can be handled by defining additional request priorities. We first change the scheduler of TUX to iterate through stages instead of individual requests, considering the entire lot of requests active at a particular stage. Once we have done so, we sort requests on the basis of three new priorities: (i) Requests that have attained maximal flow at a particular stage by using up all the per-request memory allocated for them at that stage are given the highest priority, as no more requests can be accumulated with them. (ii) Requests for which the amount of per-request memory available is insufficient are given the lowest priority, as they will likely cause cache misses. (iii) The remaining requests are given a medium priority that is lower than the priority of the first class of requests, as it is possible that requests in early stages of processing may eventually come to the level of these requests, increasing the size of the batch. This priority is weighted, with more favorable weights given to requests that are earlier in the course of treatment, as compared to those that are advanced. This final scheduler is illustrated at the bottom of Figure 6.
4.5.1
5
4.4
Modifying the server to use the customized allocator
The tool stingify replaces all the old allocations and deallocations of per-request data with invocations to the Stingy allocator. The size and other parameters are replaced with the identifier of the per-request object retrieved by the tool memwalk. The per-request data in TUX is aggregated into a relatively small number of structures, limiting the benefits of a tool for this activity. However, when the number of objects is large, the utility of stingify is greater, as manual replacements require effort and are prone to errors. Furthermore, it can be used to perform quick replacements when experimenting with different configurations of the server. 4.5
Modifying the scheduler
Schedulers in event-driven programs
Figure 6(a) illustrates a typical scheduler in a server limited by I/O. The scheduler consists of a loop that starts by handling global activities like updating stats, updating timers and checking for time-outs, handling signals etc. Next, it polls for requests that have just completed a read or write to or from an I/O device, and are waiting to be serviced. It
Benchmarks
We now describe an evaluation of our optimizations by comparing the performance of unmodified and optimized versions of TUX. We first discuss our benchmarking methodology, focusing on the characteristics of the server we wish to measure, the tools used to measure them and finally describe our results.
while (1) { while (1) / / Update synchronous t i m e r s , s t a t i s t i c s e t c . DoUpdates ( ) ; / / Handle n o t i f i c a t i o n s r e c e i v e d t h r o u g h s i g n a l s HandleSignals ( ) ; / / E x t r a c t s e t of r e q u e s t s with I /O completed r e q u e s t s w a i t i n g = PollIO ( c u r r e n t r e q u e s t s ) ; / / Treat waiting requests foreach req in r e q u e s t s w a i t i n g { / / Look up c u r r e n t s t a g e o f t h e r e q u e s t c u r s t a g e f n = GetCurrentStage ( req ) ; S c h e d u l e S t a g e ( req , c u r s t a g e f n ) ; } } }
{ / / A c c e p t any new i n c o m i n g r e q u e s t s i f ( NewRequestsWaiting ( ) ) AcceptNewRequests ( ) ; i f ( ! Empty ( a c t i v e r e q u e s t s ) ) { foreach req in a c t i v e r e q u e s t s { c u r s t a g e f n = GetCurrentStage ( req ) ; S c h e d u l e S t a g e ( req , c u r s t a g e f n ) ; } } if ( nothing to do ) Sleep ( ) ;
(a) Standard
(b) TUX
while (1) { / / O( 1 ) e l e c t i o n o f t h e h i g h e s t p r i o r i t y s t a g e / / Get t h e h i g h e s t p r i o r i t y ( eg . 5 ) and u s e i t t o // g e t t h e c u r r e n t s t a g e queue . cur priority = GetCurrentHighestPriority (); c u r s t a g e = GetNextStage ( c u r p r i o r i t y ) ; cur batch = GetActiveRequests ( stage ) ; foreach req in cur batch { c u r s t a g e f n = GetCurrentStage ( req ) ; S c h e d u l e S t a g e ( req , c u r r e n t s t a g e f n ) ; } if ( nothing to do ) Sleep ( ) ; }
(c) TUX Modified
inria-00353573, version 1 - 15 Jan 2009
Fig. 6. Scheduler of a typical event-driven server limited by I/O 5.1
Tools
We considered a variety of server benchmarking tools to use in our experiments. We needed a tool that was well identified and also captured the key property we were interested in, namely, the performance of a server under workloads of specific concurrencies. There are three main regions in a typical server’s performance regime with respect to increasing concurrency. The first, as we mentioned in Section 2, is the phase in which the load is well below exercising the full computational bandwidth of the server. In this phase (the elastic zone4 ), the throughput tends to increase linearly with additional load. When the computational bandwidth of the server is neared, i.e., for in-core workloads, when CPU utilization nears 100%, the server enters it’s plastic zone. In this stage, performance starts to degrade due to inefficiencies in caching. Finally, when the size of the incoming request stream increases beyond a final threshold, it goes into its failure zone. Then, connections begin to get dropped due to queue overflows, requests get detained for long periods of time due to lack of CPU allocation, and the server starts to become unproductive. One popular index of measurement is the uniform load, in terms of the number of requests per second that a server can handle before it enters the failure zone, and becomes saturated. httperf [13] is a tool that is known for being able to sustain server overload by avoiding client-side bottlenecks, like the number of available file descriptors, the size of socket buffers etc. We use this tool in our work to compute the maximum number of requests the server can handle before failure. Although httperf is suitable for measuring this value of maximum simultaneous connections, it is not optimal for a 4 The terms elastic zone, plastic zone and failure zone are borrowed from material sciences terminology.
controlled application of high-concurrency workloads. This is because httperf (and like benchmarks) simply generate requests uniformly at regular intervals of m/rate, where m is the number of requests in a burst. Concurrency in this case can only be escalated when the server is close to overload, since otherwise the server responds to request bursts in periods that are too small to allow concurrency to build up. This escalation in concurrency close to overload is a result of the detention of requests over long periods of time in the failure zone of the server. For this reason, we decided to use Apachebench [14], which serves this second purpose. Apachebench takes the desired concurrency, c, of requests as a command line parameter, and keeps the total number of parallel requests in the server close to c, measuring total throughput for the benchmarked period. With Apachebench, we measure performance in the server’s plastic zone. Apachebench has been used to evaluate servers under high request concurrency before [15], and is used commonly in industry. 5.2
Environment
We ran the load generators on a system with two Xeon processors running at 3GHz each, with 1MB of cache and with an Intel e1000 Gigabit Ethernet card. The server ran on an Intel Pentium IIIM running at 1.4GHz, with 1MB of L2 cache. Running the Netperf [16] benchmark for both client/server pairs quickly showed that even for raw data transfers using the protocol stack, the bottleneck of data transfer was on the server side. The measurements provided in this paper were obtained with Linux kernel 2.6.7. The experiments conducted consisted of repeatedly requesting a set of small files. 5.3
Results
Figure 7(a) illustrate a plot between the number of requests serviced per second by TUX, and the number of re-
14000
18000
Original Final 2845
12000
Req/s
Req/s
10000 83 74
8000
28504 36857
57 6000
48
Original Final
16000 14000 12000 10000
14
6 1
10
Target req/s
100
1000
10000
Concurrency
(a) Req/second close to overload (httperf) 48000 44000 40000 36000 32000 28000 24000 20000 16000 12000
(b) Throughput Original Final
1
10
100 1000 Concurrency
10000
inria-00353573, version 1 - 15 Jan 2009
(c) L2 Cache misses
Fig. 7. (a) Throughput of TUX with increasing concurrency. (b) Corresponding increase in L2 cache misses (c) Peak performance of TUX for uniform load.
quests per second generated for it by httperf. Note that this load is generated uniformly over the period of benchmarking. The maximum number of concurrent connections over a benchmarked period is also displayed at points at regular intervals in these graphs. We observe that the peak performance of the server, i.e., the load handled just before entering its failure zone increases by about 21%. Figure 7(b) shows the variation of requests serviced per second with increasing concurrency in the two servers. Figure 7(c) shows the number corresponding variation in L2 cache misses. We note that requests serviced increase by up to 40% for a concurrency of about 2500 and L2 cache misses decrease by up to 75%. 5.4
Related Work
8000
4000 4000 6000 8000 10000 12000 14000
Samples
the modified servers can handle this load close to overload better than the unmodified ones. The result is that the point at which the server fails is delayed, and the server scales to a higher peak performance.
Analysis
Apachebench As mentioned earlier, we use apachebench to analyze performance in the plastic zone of the servers, and httperf to analyze their failure zones. We observe that in Figure 7 over the plastic zone, the number of L2 cache misses decreases drastically in the modified versions of the servers. As a result of this decrease, performance now stays relatively consistent over the entire zone. Early on, when concurrency is in the neighborhood of 40, the increase in performance can also be expected to be due to a reduction in i-cache misses. httperf To understand performance improvements close to the failure zone, we must keep in mind that there is an escalation in concurrency as a server approaches overload. This trend can be observed in Figure 7(a). Since our modifications make the servers more robust to high concurrencies,
The scalability of servers has been an intensively researched topic in the systems community. Much of this research has been done in the context of servers with a considerable amount of I/O activity. In this section, we will focus on the works that are most pertinent in the context of CPU-bound servers. Chandra and Mosberger introduced multi-accept servers [17] that were shown to bring about significant gains in performance as compared to traditional servers. Brecht et al. [18] have shown that performance could be enhanced with small modifications in the above strategy. The results of both these works concur with the observations presented in ours, in that, (i) The former advocates that servers aggressively accept requests and treat requests in as large batches as possible, improving locality with respect to instructions and static data.(ii) The latter advocates that these batches be limited in size, to prevent the total working data set of the server from exploding. Our approach strikes a balance between these two policies in an adaptive way and derives itself from the characteristics of the underlying cache. Larus and Parkes have presented another cache-aware scheduling strategy called Cohort scheduling [7]. Our scheduling strategy includes a policy that effectively implements a variant of Cohort scheduling, favoring the batching of requests as long as it can be done without causing datacache misses. Larus and Parkes applied Cohort scheduling to a threaded server, by changing the implementation of the underlying threading library. In this work, we have applied what amounts to cohort scheduling to an event-driven server using automated tools. Better instruction-cache locality was also the goal of Blackwell [19], in his work on optimizing TCP/IP stacks. He showed that by processing several packets in a loop at every layer, one could induce better reuse of the corresponding instructions. Cache-conscious data placement has been used to optimize the caching behavior of generic programs [12, 20, 21]. These works use program analysis and profiling information to efficiently arrange objects in memory, and fields within objects. While the goal of these efforts is to reduce the number of cache misses in generic programs, our work focuses on the specific problem of reducing data cache misses in event-driven servers, since they have a well defined structure and concurrency behavior. Recent work has advocated policies for resource aware scheduling. The Capriccio threading library [15] is one example, in which scheduling aims to balance the utilization of various resources at blocking points in the server application. These blocking points are points at which potentially blocking system calls are invoked, and are extracted auto-
matically. The resources tracked by Capriccio were memory, CPU and file descriptors. Blocking points in a program can be seen as end points of implicit stages in a server. In relation to Capriccio, our work could be seen as a special kind of resource-aware scheduling which aims to constrain cache usage. Similar to Capriccio, the SEDA architecture [22] had dynamic resource controllers, which dynamically adapted resource usage at various stages based on observed performance. SEDA also did not specifically explore caching inefficiencies in CPU-bound servers.
inria-00353573, version 1 - 15 Jan 2009
7
Conclusion & Future Work
In this paper, we analyzed the performance of eventdriven servers that are CPU-bound and demonstrated that caching inefficiencies can lead to poor performance. We presented an approach consisting of a cache-aware memory allocator and a specific scheduling strategy that together ensure that L2-cache-miss rate in the application is minimized. Our approach is applied with the help of a set of tools that operate on event-driven programs written in the C language. We described a case study in the context of a high-performing real-world server, TUX. Our optimizations improves the throughput under high concurrency by up to 40%, reduces L2 data-cache misses by about 75% and improves the maximum load handled before failure by 21%. As future work, we are looking to apply our approach to other CPU-bound servers, such as telephony servers that serve the SIP protocol. We are also considering additional OS-support for the Stingy allocator and specific interfaces that allow our approach to be extended to dynamic services.
References [1] L. A. Wald and S. Schwarz, The 1999 Southern California Seismic Network Bulletin, July/August 2000, Seismological Research Letters. [2] V. S. Pai, P. Druschel, and Zwaenepoel, “Flash: An Efficient and Portable Web Server,” in USENIX Annual Tech Conference, June 1999. [3] K. Elmeleegy, A. Chanda, A. L. Cox, and W. Zwaenepoel, “Lazy asynchronous I/O for eventdriven servers,” in USENIX Annual Tech Conference, June 2004. [4] L. M. Ramaswamy, Georgia Institute of Technology, Personal communication. [5] “Session Initiation Protocol (SIP),” The Internet Engineering Task Force, 1895 Preston White Drive, Suite 100, Reston, VA 20191-5434 – USA, Mar. 2001, request for Comments 2543. [6] Y. Ruan, V. S. Pai, E. Nahum, and J. Tracey, “Evaluating the impact of simultaneous multithreading on network servers using real hardware,” in USENIX Annual Tech Conference, June 2004. [7] J. R. Larus and M. Parkes, “Using cohort scheduling to enhance server performance,” in USENIX Annual Tech Conference, Oct. 2002.
[8] Standard Performance Evaluation Corporation, “The SPECWeb99 Benchmark. quarterly results.” URL: http://www.spec.org/osg/web99/results/. [9] G. Banga, P. Druschel, and J. Mogul, “Better operating system features for faster network servers,” in Workshop on Internet Server Performance, June 1998. [10] S. Bhatia, C. Consel, and J. Lawall, “Memorymanager/scheduler co-design: Optimizing eventdriven servers to improve cache behavior,” in Proceedings of the 2006 ACM International Conference on Memory Management, Ottawa, Canada, 2006. [11] J. Bonwick, “The slab allocator: An object-caching kernel memory allocator,” in USENIX94, 1994. [12] B. Calder, C. Krintz, S. John, and T. Austin, “Cache-conscious data data placement,” in Eighth International Conference on Architectural Support for Programming Languages and Operating Systems (ASPLOS-VIII), Oct. 1998. [13] D. Mosberger and T. Jin, “httperf - a tool for measuring web server performance,” in Workshop on Internet Server Performance, June 1998. [14] The Apache Foundation, “Apache HTTP server project,” URL: http://www.apache.org. [15] R. Von Behren, J. Condit, F. Zhou, G. C. Necula, and E. Brewer, “Capriccio: scalable threads for internet services,” in SOSP03, Oct. 2003. [16] H.-P. company Information Networks Division, Netperf: A network performance benchmark, Feb. 1996. [17] A. Chandra and D. Mosberger, “Scalability of Linux event-dispatch mechanisms,” in USENIX Annual Tech Conference, June 2001. [18] T. Brecht, D. Pariag, and L. Gammo, “Accept()able strategies for improving server performance,” in USENIX Annual Tech Conference, June 2004. [19] T. Blackwell, “Speeding up protocols for small messages,” in SIGCOMM Symposium on Communications Architectures and Protocols, Aug. 1996. [20] T. M. Chilimbi, M. D. Hill, and J. R. Larus, “Cacheconscious structure layout,” in Proceedings of the ACM SIGPLAN’99 Conference on Programming Language Design and Implementation (PLDI’99), May 1999. [21] T. M. Chilimbi, B. Davidson, and J. R. Larus, “Cacheconscious structure definition,” in Proceedings of the ACM SIGPLAN’99 Conference on Programming Language Design and Implementation (PLDI’99), May 1999. [22] M. Welsh, D. Culler, and E. Brewer, “SEDA: An architecture for well-conditioned, scalable internet services,” in SOSP01, Oct. 2001.