Anal. Chem. 2002, 74, 4279-4286
Mixing Processes in a Zigzag Microchannel: Finite Element Simulations and Optical Study Virginie Mengeaud, Jacques Josserand, and Hubert H. Girault*
Laboratoire d’Electrochimie Physique et Analytique, Ecole Polytechnique Fe´ de´ rale de Lausanne, 1015 Lausanne, Switzerland
A finite element model has been used in order to study the mixing process of species in a 100-µm-wide zigzag microchannel integrating a “Y” inlet junction. The distribution of the concentration was obtained by solving successively the Navier-Stokes equation and the diffusion-convection equation in the steady state form. Because of the large range of Reynolds numbers studied (1 < Re < 800), the 2D diffusion-convection simulations are carried out with high diffusion coefficients. The results illustrated the effects of both flow rate and channel geometry on hydrodynamics and mixing efficiency. Below a critical Reynolds number of ∼80, the mixing is entirely ensured by molecular diffusion. For higher Reynolds numbers, simulations revealed the mixing contribution of laminar flow recirculations. This effect increases for lower values of diffusion coefficients. Experimental studies on the mixing of species at different flow rates are reported showing the same hydrodynamic tendency. In the field of miniaturization, mixing processes occurring at microscale were first investigated, and different devices were designed. Over the past decade, microfluidic devices ensuring homogenization of solutions of reagents have been developed for a broad range of applications, such as bioanalytical techniques,1-3 production of organic compounds,4,5 or combinatorial chemistry.6 A rapid and efficient mixing is an important step in both multicomponent analytical systems and microreaction technology. However, turbulent flows cannot be generated when the dimensions of the structure are less than hundreds of micrometers. In such scales where the flow is strictly laminar, the mixing is entirely ensured by molecular diffusion between layers of different concentrations. Consequently, when the thickness of each fluid layer is larger than the characteristic diffusion length, an effective * To whom correspondence should be addressed. Fax: + 41 21 693 36 67. E-mail:
[email protected]. (1) Fluri, K.; Fitzpatrick, G.; Chiem, N.; Harrison, D. J. Anal. Chem. 1996, 68, 4285-4290. (2) Hadd, A. G.; Raymond, D. E.; Halliwell, J. W.; Jacobson, S. C.; Ramsey, J. M. Anal. Chem. 1997, 69, 3407-3412. (3) Harrison, D. J.; Fluri, K.; Chiem, N.; Tang, T.; Fan, Z. H. Sens. Actuators B 1996, 33, 105-109. (4) Greenway, G. M.; Haswell, S. J.; Morgan, D. O.; Skelton, V.; Styring, P. Sens. Actuators 2000, 63, 153-158. (5) Haswell, S. J.; Middleton, R. J.; O’Sullivan, B.; Skelton, V.; Watts, P.; Styring, P. Chem. Commun. 2001, 391-398. (6) Mitchell, M. C.; Spikmans, V.; Manz, A.; de Mello, A. J. J. Chem. Soc., Perkin Trans. 1 2001, 514-518. 10.1021/ac025642e CCC: $22.00 Published on Web 07/12/2002
© 2002 American Chemical Society
and rapid mixing is difficult to achieve. The diffusion length is often approximated by xDt where D is the diffusion coefficient of the species and t the residence time. Until now, miniaturized devices were designed to overcome this limitation by integrating particular designs of microchannels on the basis of different fluidic mechanisms. The most common approach is based on increasing the contact surface between fluids by splitting and arranging the streams into a single multilaminated channel.7-9 The thickness of each fluid layer is then greatly reduced, allowing a faster diffusion time scale. Other configurations featuring perpendicularly intersecting channels allow hydrodynamic focusing under pressure driven flow via submerged fluid jets10 or parallel and serial mixing under electroosmotic flow via an array of cross intersections.11 Another method consists of imposing a perturbation within the flow by generating a transversal component of the velocity. This method is based on chaotic advection12 increasing the interfacial area across which diffusion takes place. This flow phenomenon can be achieved using three-dimensional helical channels,13 bas-relief structure on the floor of the channel,14 or electrokinetic instability.15 At the macroscopic scale, laminar flow has been well-characterized, and many computational modeling studies have especially highlighted mass transfer in different configurations of fluid mixing, such as opposing jets,16 chaotic advection,17 or stirred tank.18 At the same time, 3D simulations were introduced to compare the performances of different static macromixers.19,20 Transferred to the field of microfluidics, computational methods (7) Bessoth, F. G.; deMello, A. J.; Manz, A. Anal. Commun. 1999, 36, 213-215. (8) Ehrfeld, W.; Golbig, K.; Hessel, V.; Lowe, H.; Richter, T. Ind. Eng. Chem. Res. 1999, 38, 1075-1082. (9) Erbacher, C.; Bessoth, F. G.; Busch, M.; Verpoorte, E.; Manz, A. Mikrochim. Acta 1999, 131, 19-24. (10) Knight, J. B.; Vishwanath, A.; Brody, J. P.; Austin, R. H. Phys. Rev. Lett. 1998, 80, 3863-3866. (11) Jacobson, S. C.; McKnight, T. E.; Ramsey, J. M. Anal. Chem. 1999, 71, 4455-4459. (12) Aref, H. J. Fluid. Mech. 1984, 143, 1-21. (13) Liu, R. H.; Stremler, M. A.; Sharp, K. V.; Olsen, M. G.; Santiago, J. G.; Adrian, R. J.; Aref, H.; Beebe, D. J. J. Microelectromech. Syst. 2000, 9, 190-197. (14) Stroock, A. D.; Dertinger, S. K. W.; Ajdari, A.; Mezic, I.; Stone, H. A.; Whitesides, G. M. Science 2002, 295, 647-651. (15) Oddy, M. H.; Santiago, J. G.; Mikkelsen, J. C. Anal. Chem. 2001, 73, 58225832. (16) Hosseinalipour, S. M.; Mujumdar, A. S. Int. Commun. Heat Mass Transfer 1997, 24, 27-38. (17) Zalc, J. M.; Muzzio, F. J. Chem. Eng. Sci. 1999, 54, 1053-1069. (18) Brucato, A.; Ciofalo, M.; Grisafi, F.; Tocco, R. Chem. Eng. Sci. 2000, 55, 291-302. (19) Rauline, D.; Tanguy, P. A.; Le Blevec, J. M.; Bousquet, J. Can. J. Chem. Eng. 1998, 76, 527-535.
Analytical Chemistry, Vol. 74, No. 16, August 15, 2002 4279
have proven to be an efficient tool to design and develop microsystems.21 Major works reported in the literature are devoted to the simulations of mixing phenomenon in microchannels. Calculations highlight the prediction of flow fields for Reynolds numbers 10-9 m2 s-1) and then studied in the case of species with lower diffusion coefficients. Finally, experimental studies on the mixing of species at different flow rates are reported that show the same tendency regarding the hydrodynamic effects. THEORY AND NUMERICAL DESCRIPTION Mathematical Model. The model used considers the laminar mixing of species along a 2D section of microchannel, resulting from the contact between two similar fluids featuring the same viscosity, ν, and the same density, F. To establish this model, the following assumptions are proposed: (i) the flow profile is assumed to be constant along the depth axis (depth-to-width ratio greater than 10); (ii) the variations of the concentration do not modify the viscosity and the density of the fluid (diluted solutions and no free convection); (iii) the channel walls are assumed to be smooth (roughness and experimental imperfections are neglected); and (iv) the wall surface tension forces are neglected, and the medium is assumed continuous. In the model envisaged, the mixing process occurring at microscale is studied by solving the momentum and mass transport equations in two steps. First, the Navier-Stokes equation (eq 1) and the continuity equation (eq 2) are solved in the case of an incompressible and nonexpandable fluid in a horizontal channel (no gravity effect).
F
∂V + FV‚∇V ) - ∇p + µ∇2V ∂t ∇‚V ) 0
(1) (2)
V is the velocity vector; p, the pressure; and µ, the dynamic (20) Rauline, D.; Le Blevec, J. M.; Bousquet, J.; Tanguy, P. A. Chem. Eng. Res. Des. 2000, 78, 389-396. (21) Ehrfeld, W.; Hartmann, H.-J.; Hessel, V.; Kiesewalter, S.; Lo¨we, H. In Micro Total Analysis Systems; van der Berg, A. e. a., Ed.; Kluwer Academic: Enschede, 2000; pp 33-40. (22) Bertsch, A.; Heimgartner, S.; Cousseau, P.; Renaud, P. Lab Chip 2001, 1, 56-60. (23) Hinsmann, P.; Frank, J.; Svasek, P.; Harasek, M.; Lendl, B. Lab Chip 2001, 1, 16-21.
4280
Analytical Chemistry, Vol. 74, No. 16, August 15, 2002
viscosity of the fluid. For moderated Reynolds numbers ranging from 1 to 1000 in this study, the steady-state Navier-Stokes equation can be solved in laminar conditions without taking into account chaotic instabilities. In addition, we assume that a steadystate flow is established at the inlets. Consequently, the transient term in eq 1 can be neglected. Finally, the distribution of the species concentration is obtained by solving the diffusionconvection equation (eq 3) where the transient term is neglected,
∂c + V‚∇c ) D∇2c ∂t
(3)
where c is the concentration of the species and D, the molecular diffusion coefficient of the species. Because of the previous assumption (ii), the velocity vectors V calculated in eqs 1 and 2 are introduced in eq 3 as an input parameter. The Reynolds number is defined as
Re )
V h Dh ν
(4)
where V h is the average velocity in the zigzag channel; ν, the kinematic viscosity; and Dh, the hydraulic diameter defined for a rectangular channel featuring infinite depth, as Dh ) 2w (with w the width of the channel studied). At the same time, the Peclet number can be adapted to the geometry of the channel and defined as
Pe )
V hL D
(5)
where L is the linear length of the zigzag channel. For a 2D Cartesian channel, the average velocity is expressed as
2 2 V h ) Vmax ) ×(2Vmax,feeder) 3 3
(6)
where Vmax is the maximal velocity without recirculation in the zigzag channel and Vmax,feeder is the maximal velocity in each feeder. Numerical Parameters. All of the simulations have been carried out using the numerical software Flux-Expert (Simulog, 60 rue Lavoisier, 38 330 Montbonnot, France) based on the finite element method. A nonlinear steady-state algorithm was used for hydrodynamic calculations, and a linear steady-state one was used for the solving of the diffusion-convection equation. Both algorithms are based on the Gauss inversion method. In this work, the equations are solved on a two-dimensional Cartesian geometry (i.e. rectangular channel with infinite depth) and in a dimensional form on a Silicon Graphics Indigo 2 workstation. The typical geometry studied is schematically represented in Figure 1. The microfluidic system features two perpendicular and 100-µm-wide (w) feeders that are ended by a zigzag channel having the same width and integrating 90° angles. The linear length of one zigzag pattern is defined as a variable periodic step (s). The linear length of the zigzag channel (L) is fixed to 2000 µm, and the effective length of the channel corresponds to Lx2. (24) Ehlers, S.; Elgeti, K.; Menzel, T.; Wiessmeier, G. Chem. Eng. Process. 2000, 39, 291-298.
Figure 1. Dimensions of the microfluidic system integrating a “Y” junction, with w, the width of the channel; s, the linear length of the periodic step; and L, the linear length of the zigzag microchannel.
For the hydrodynamic calculations, a parabolic Poiseuille profile is assumed at both inlet boundaries. In addition, the fluid velocity is fixed to 0 along the wall boundaries (no slip conditions), and a free condition is assumed at the outlet boundary. Regarding the boundary conditions for the concentration calculations, the parameter c is imposed as 0 at one inlet and as 1 at the other one. In addition, the values of the density and the dynamic viscosity are the following: F ) 103 kg m-3 and µ ) 10-3 kg.m-1 s-1. To simplify the analyses, two dimensionless parameters are defined. The first one is the geometry ratio, s/w. The second one, defined as the mixing efficiency, can be considered as a major indicator for the mixer performance. This latter parameter is quantified by the ratio cmin/cmax between the minimal and the maximal concentrations at the outlet cross section. EXPERIMENTAL SECTION Fabrication of the Microfluidic Device. The microchip was fabricated using a 193 nm ArF excimer laser ablation.25 A 100µm-thick poly(ethylene terephthalate) (PET) substrate (Mylar, Du Pont, Switzerland) was placed on computer-controlled XY translation stages (Physik Instrumente, Germany) and scanned under the excimer laser beam (Lambda Physik LPX 205-i) (power, 10 MW) at a frequency of 50 Hz to produce a 2-mm-long channel. The setup was a standard mask projection arrangement in which a circular hole (diameter, 1 mm) was projected onto the substrate, defining a 100-µm-wide channel. The substrate was then moved in the XY plane, and the speed of the displacement and the repetition rate of the laser defined a 48-µm-deep cavity. The microstructure, previously washed with ethanol, was finally thermally sealed by using a lamination machine (Morane Senator, Oxon, U.K.). Experimental Setup. A programmable syringe pump (Kd Scientific, Ismatec, Switzerland) was connected to both inlets via Teflon tubing and silica capillary to limit the pressure drop. To image the mixing under pressure-driven flow, one inlet was initially filled with a 10 mM phosphate buffer (pH ) 7), and the second inlet was filled with the buffer solution containing 220 µM fluorescein. Fluorescein (Fluka, Switzerland) was diluted in 10 mM phosphate buffer (pH ) 7). Flow Image Acquisition. The fluorescence detection and microscopic investigation were performed using a confocal microscope (Axiovert 25, lamp HBO 100 W, Zeiss, Germany) with a high-sensitivity CCD color video camera (IRIS, Sony, Japan). Images were recorded on videotape and converted via an analogto-digital software, Premiere 6 (Adobe). The fluorescence images were processed into intensity histograms using Igor Pro software (Wavemetrics). (25) Roberts, M. A.; Rossier, J. S.; Bercier, P.; Girault, H. Anal. Chem. 1997, 69, 2035-2042.
Figure 2. Different geometries of the microchannel. (a) s/w ) 1, (b) s/w ) 2, (c) s/w ) 4, (d) s/w ) 8, (e) s/w f 0, and (f) s/w f ∞.
RESULTS AND DISCUSSION Presentation of the Study. To study the effect of the zigzag geometry, four derived configurations featuring a periodic step (s) of 100, 200, 400, and 800 µm are envisaged and schematically represented in Figure 2a-d, respectively. The width of the channel remains similar for the four geometries (i.e., 100 µm). To compare these geometries, two straight channels corresponding to asymptotic values of s are schemed in Figure 2 and represent the reference microchannels. Figure 2e and f illustrates both reference cases, A for s f 0 and B for s f ∞ respectively. Because of the presence of numerous 90° angles in reference case A, the channel width is multiplied by a x2 factor, which corresponds to an effective cross section of 141 µm. For reference case B, the effective width remains unchanged to 100 µm while the effective length of the channel is enhanced by the same x2 factor (i.e. L ) 2828 µm). In addition, a third reference channel (reference case C) featuring a width of 100 µm and length of 2000 µm is introduced in the study. Regarding the hydrodynamic study, the main difficulty at high flow rates is associated with low values of diffusion coefficients (D e 10-9m2 s-1) inducing Peclet numbers that are too high for the convection-diffusion calculations. Consequently, the local mesh size should be small enough to decrease the mesh Peclet number. In the case of a geometry featuring channel dimensions of hundreds of micrometers, the resulting mesh would induce computational limitations. One way to solve this problem for a fixed length of channel (L ) 2000 µm) is to increase the diffusion coefficient in order to maintain a moderated constant Peclet number. The Peclet number introduced in eq 5 can be also defined as
Pe )
( )( ) L w
2
tdiffusion w2/D ∝ L/V h tresidence
Analytical Chemistry, Vol. 74, No. 16, August 15, 2002
(7) 4281
Figure 3. Effect of the geometry ratio, s/w, on the mixing efficiency at Pe ) 2600 and for two different Reynolds numbers. Curve A, Re ) 0.26; curve B, Re ) 267.
Therefore, when the residence time decreases (high values of V h ), the transversal diffusion time is artificially reduced (high values of D) to ensure a similar diffusion length (xDtresidence). In the following studies, D is artificially increased from 10-9 up to 10-6 m2 s-1 for V h ranging from 1.3 × 10⁻³ up to 1.3 m s-1. For low values of diffusion coefficients and high values of velocity, it is worth noting that longer residence times are required to maintain a constant transversal diffusion length. Consequently, the microsystem would correspond to longer channels if the velocity was set to such high values. Effect of Different Geometries. The effect of the periodic step (s) on the mixing efficiency was first investigated. As portrayed in Figure 3, this parameter is plotted versus the geometry ratio for two different fluid velocities, V h ) 1.3 × 10⁻³ m -1 -1 s and V h ) 1.3 m s which correspond to Reynolds numbers of 0.26 and 267, respectively. At the same time, the three linear reference cases A, B, and C are simulated for the same Reynolds numbers. Because of the constant Peclet assumption, it can be noticed that the mixing efficiencies obtained for these three straight geometries are independent of the flow rate. The results obtained for references A and C illustrate the effect of decreasing the channel width. Reducing the cross section or the transversal diffusion length of 29% enhances the mixing efficiency of 95%. At the same time, the difference observed between references B (L ) 2828 µm) and C (L ) 2000 µm) emphasizes the effect of increasing the channel length or the residence time. For a length increase of 29%, the relative mixing gain reaches only 13%. For Re ) 0.26 (curve A), the mixing efficiency increases from 65 up to 83.8% when the geometry ratio varies from 1 to 8. This evolution arises from both geometric contributions mentioned in the previous section. For low values of s/w, the number of angles increases, inducing an increase in the effective width and a reduction in the effective length. For s/w > 4, the angle effects are negligible, and the mixing efficiency tends to the asymptotic value of reference B. For this low Reynolds number, the most efficient zigzag configuration corresponding to s ) 800 µm features a mixing efficiency reaching 83.8%. For Re ) 267 (curve B), the mixing efficiency first greatly increases up to 98.6% for a geometry ratio increasing up to 4. For s/w > 4, the efficiency slightly decreases down to 88.1% illustrating the existence of an optimal zigzag geometry. However, the mixing efficiency values obtained for s/w > 2 are larger than the asymptotic one corresponding to reference B. Because the diffusion conditions remain similar in this study (Pe ) 2600), results obtained for higher Reynolds number highlight that the 4282 Analytical Chemistry, Vol. 74, No. 16, August 15, 2002
Figure 4. Velocity vectors obtained at Re ) 267 for zigzag geometries featuring (a) s ) 400 µm and (b) s ) 800 µm.
mixing efficiency is strongly dependent on the convection regime. This mixing efficiency can be significantly improved, taking advantage of the laminar recirculation induced by the zigzag angles at high flow rates. Recirculation Phenomenon. The following studies focus on the hydrodynamic effects induced by the zigzag configuration. Figure 4a,b represents a zoom of the zigzag channel featuring s ) 400 and 800 µm, respectively, and depicts the velocity vectors obtained at Re ) 267. In light of the fluid profile, the improvement of the mixing observed for high Reynolds numbers can be associated with laminar recirculations generated at each angle and localized along the walls. According to the hydrodynamic literature, flow studies at macroscale have characterized the generation of recirculation around continuous or discontinuous obstacles and around wall discontinuities.26-31 Because of the inertial effects, there is a boundary-layer separation after each angle corresponding to the inversion of the pressure gradient and wall shear stress. Recirculations inducing transversal component of the velocity spread species from the interface to the walls. Therefore, for high flow rates, the mixing is ensured by diffusion and laminar recirculation processes. The recirculations sketched in Figure 4a occupied the entire arms of the channel after each angle. The effect of this hydrodynamic phenomenon on the mixing is optimal in this configuration (efficiency of 98.6%). For larger values of s, (26) Schlichting, H. Boundary Layer Theory; MacGraw-Hill: New York, 1968. (27) Taneda, S. J. Phys. Soc. Jpn. 1979, 46, 1935-1942. (28) Tritton, D. J. Physical Fluid Dynamics; Oxford University Press: New York, 1988. (29) Van Dyke, M. An album of fluid motion; MIT Press: Stanford, 1982. (30) Josserand, J.; Marty, P.; Alemany, A. Fluid Dyn. Res. 1993, 11, 107-117. (31) Wojtkowiak, J.; Hyun, J. M. Fluid Dyn. Res. 2000, 26, 377-391.
Table 1. Influence of the Fluid Velocity on the Mixing Efficiency for a Zigzag Geometry Featuring s ) 400 µm Vmax, feeder m s-1
V h m s-1
D m2 s-1
Pe
Re
mixing efficiency %
10-3 10-2 10-1 3 × 10⁻¹ 5 × 10⁻¹ 1
1.3 × 10⁻³ 1.3 × 10⁻² 1.3 × 10⁻¹ 4.0 × 10⁻¹ 6.7 × 10⁻³ 1.3
10-9 10-8 10-7 3 × 10⁻⁷ 5 × 10⁻⁷ 10-6
2600 2600 2600 2600 2600 2600
0.26 2.67 27 80 133 267
81 81 81 83 87.5 98.6
Figure 5. Evolution of the mixing efficiency with the Reynolds number for the zigzag geometry featuring s ) 400 µm at Pe ) 2600.
there is a boundary layer reattachment in the middle of each arm confining the recirculations at the extremities (Figure 4b) and, therefore, decreasing the mixing efficiency to 88.1%. Consequently, when the channel arm after each angle is longer than the recirculation dimensions, the mixing efficiency worsens. Different calculations for the optimal zigzag channel featuring s ) 400 µm are achieved for different Reynolds numbers and are reported in Table 1. As in the precedent calculations, diffusion coefficients are adapted to ensure a constant Peclet number. Different values of mixing efficiencies are represented versus the Reynolds numbers in Figure 5. Two different mixing behaviors are illustrated. For Reynolds numbers 80 (V h g 4 × 10⁻¹ m s-1) inducing recirculations, the mixing efficiency greatly increases up to 98.6%. As discussed previously, the channel wall after each angle acts as an obstacle redirecting the flow. The inertial effects induce a convergence of the flow lines along these walls and an increase of the local velocity, as shown in Figures 4a and 6a. Figure 6b illustrates the distribution of the maximum of the local velocity for different Reynolds numbers at different succeeding zigzag angles along the channel featuring s ) 400 µm. Each data point corresponds to the maximum value of the velocity vector calculated on a vertical path defined at each angle (Figure 6a). This value is normalized to the theoretical maximal value of the flow in the center of a linear channel without recirculation (Vmax ) (3/2)V h for a flow between two plates). It is worth noting that the velocity profile is imposed at both inlets for each Reynolds numbers studied (curves A-E). The graph illustrates the progressive increase of the maximum local velocity with every succeeding angle of the microchannel. As the size of the recirculating zones progressively increases along the channel, the effective cross section of the main flow is reduced, and the maximum of the local
Figure 6. (a) Vertical distribution of the flow velocity vectors at the seventh angle (the maximum value is 4.28 m s-1). The corresponding Reynolds number is 267. (b) Maximum velocity calculated at each angle (see Figure 6a) and normalized to the maximal velocity of the Poiseuille profile as a function of the position in the zigzag channel featuring s ) 400 µm. Curve A, Re ) 800; curve B, Re ) 533; curve C, Re ) 267; curve D, Re ) 133; and curve E, Re ) 27. (c) Evolution of the maximum velocity at the outlet (geometry s ) 400 µm) normalized to the maximal velocity of the Poiseuille profile versus the Reynolds number.
velocity is enhanced, especially for Re > 300. For Re > 500 (curves A and B), the distance corresponding to an established flow (constant maximum velocity) is ∼6 angles. Figure 6c shows the evolution of the maximum outlet velocity (after 8 angles) normalized to the maximum velocity of the classical Poiseuille profile for different Reynolds numbers. The shape of the curve is similar to the one obtained in Figure 5 and illustrates the change of velocity profiles from a critical Reynolds number of 80. For Analytical Chemistry, Vol. 74, No. 16, August 15, 2002
4283
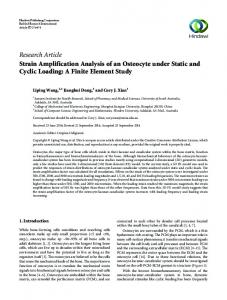
Figure 8. White-light microscopy image of a zigzag microchannel featuring w ) 100 µm and s ) 800 µm. One inlet is initially filled with 10 mM phosphate buffer (pH ) 7), and the second inlet is filled with the buffer solution containing fluorescein. The dashed line represents the point where the fluorescence intensity profiles were analyzed.
Figure 7. Study of the effect of the diffusion coefficient for linear reference case B (dashed lines) and for the zigzag geometry featuring s ) 400 µm for three Reynolds numbers. (a) Effect of the diffusion coefficient on the mixing efficiency. (b) Effect of the diffusion coefficient on the mixing factor.
Reynolds number values ranging from 80 to 300, the generation of a transversal component of the velocity explains the enhancement of mixing previously discussed (from 83 to 98.6% for Re ranging from 80 to 267). For a 3D microchannel, it can be noticed that the depth effect will slow the local velocity near the walls at the bottom and top of the channel and damp the recirculations. The recirculation may be concentrated in the middle of the channel, decreasing the global mixing effect. However, because of computational limitations, accurate 3D calculations cannot be achieved for such geometry and Reynolds numbers. Effect of the Diffusion Coefficient. To see the tendency toward more realistic D values, let us look at the effect of diffusion coefficients. Figure 7a and b represents the mixing efficiency and the mixing factor, respectively, as a function of the diffusion coefficient of the species for a zigzag channel featuring s ) 400 µm and for an equivalent straight channel (dashed lines). Figure 7b is directly derived from Figure 7a and illustrates the mixing gain corresponding to the zigzag configuration. This mixing factor is defined as the ratio between the mixing efficiencies obtained with the zigzag and straight microchannels. Because of computational limitations regarding the values of the mesh size, D values range from 1 × 10⁻⁶ to 2 × 10⁻⁷ m2 s-1. To have a significant value of the mixing efficiency for high Reynolds numbers, such as 533, the minimal value of D studied is fixed to 4 × 10⁻⁷ m2 s-1 (minimum efficiency of 10% for the straight channel). As portrayed in Figure 7a, the mixing efficiency decreases when the diffusion coefficient decreases for three different Reynolds numbers. For Re ) 267, the shapes of the curves in Figure 7a for both geometries are similar, highlighting the limitations of the zigzag configuration in this range of diffusion coefficients. When the Reynolds number increases, the mixing efficiency in the straight channel is strongly affected by the decrease of the residence time. For the zigzag geometry, this decrease is greatly compensated 4284 Analytical Chemistry, Vol. 74, No. 16, August 15, 2002
by the spreading effect of the recirculations, improving the mixing factor. In addition, for lower diffusion coefficients, these convection effects are predominant, and therefore, the mixing significantly increases, as compared to a straight channel. From a practical standpoint, these Reynolds numbers would correspond to a larger width of the channel to decrease both velocity and pressure drop. For Re ) 533, the total pressure drop is 1.5 bar for the zigzag configuration (0.15 bar for the straight channel). Because the pressure drop in laminar flow is proportional to (V h /Dh2)(∆P ∝ 2 h /2)), the increase in the width from 100 to 300 (1/Re)(L/Dh)(V µm with conservation of the Reynolds number would lower the pressure drop by a ratio of 27 (50 mbars for Re ) 533 in the zigzag configuration still with large depth-to-width ratio). This scaling effect would also facilitate the recirculation phenomenon by reducing the damping effect of the walls. Mixing of Aqueous Solutions. Because mixing species featuring a diffusion coefficient 10) would require higher laser energy and longer fabrication time. Figure 8 represents a white-light microscopy image of the zigzag microchannel filled with fluorescein and phosphate buffer at 0.4 mL h-1. The dashed line at the end of the channel depicts a linear distance of 2000 µm down the Y junction and is the point where the fluorescence intensity profiles across the outlet channel are analyzed. To investigate the effect of the zigzag geometry on the mixing process, the residence time is always maintained lower than the diffusion time (i.e., 10 s). As a consequence, the flow rates studied for each feeder range from 0.02 to 1.2 mL h-1 (0.1 < Re < 9 in the zigzag channel, based on the experimental hydraulic diameter). As a result of sealing problems at the inlet, higher Reynolds numbers could not be reached. Two fluorescence intensity profiles across the channel obtained for 0.04 and 1.2 mL h-1 are shown in Figure 9. The profiles are normalized to the maximum fluorescence signal in the inlet channel. The slight deviation observed in both curves is associated with a default in the structure. In these experiments, a dye fluid
Figure 9. Fluorescence intensity profiles across the zigzag microchannel at the outlet and obtained for two different feeder flow rates. Curve A, 0.04 mL h-1; curve B, 1.2 mL h-1.
defects observed on the walls may be considered as microobstacles, which can induce small flow disturbances and decrease the critical Reynolds number corresponding to the transition to recirculation phenomenon. Because of these small disturbances, the boundary layer separation of the flow and, consequently, the recirculation phenomenon are facilitated after each zigzag angle. To emphasize the recirculation of real flows at low Reynolds numbers, Taneda27 observed such recirculation phenomenon for a 2D flow past a square block in a macrochannel at Re ) 0.02 (based on the block size). At the same time, it can be noticed that the effect of flow disturbances is also observed in transition to turbulence phenomena. According to the literature, this transition process is described as extremely sensitive to the level of small disturbances in the incoming fluid.28 Tritton reported that laminar flow could be maintained from Reynolds numbers of 2 × 10³ up to ∼105 by minimizing the disturbance level. CONCLUSION
Figure 10. Evolution of the slope of the fluorescence intensity profiles with the feeder flow rate. The data points are connected to visualize the tendency.
of known concentration is mixed with an undyed fluid. Karasso et al.32 discussed the biasing problems occurring with such a dilution technique. The mixing efficiency can be overestimated as a result of the resolution of the imaging system. Consequently, the mixing efficiency is directly estimated from the slope of the intensity profiles perpendicular to the channel. This approach involves a less-demanding image analysis than the reported by Johnson et al.33 Figure 10 shows the average slope of the fluorescence intensity profiles obtained for different flow rates of feeder and each data point associated with the corresponding standard deviation are connected to illustrate the tendency. The evolution of the slope can be readily related to the evolution of the mixing efficiency. The slope value obtained for a flow rate of 0.02 mL h-1 can be correlated to a better mixing than for 0.4 mL h-1. As the residence time decreases, the slope of the intensity profiles increases, illustrating the decrease of the mixing efficiency; however, this tendency changes for flow rates superior to 0.9 mL h-1, corresponding to a critical Reynolds number (based on the experimental hydraulic diameter) of ∼7. The slope obtained for 1.2 mL h-1 is similar to the one obtained for 0.04 mL h-1, which emphasizes the existence of a new mixing contribution. This mixing tendency in a real 3D system corroborates to some extent the 2D calculations. However, the experimental value observed for the critical Reynolds number associated to the recirculation transition (Re ) 7) is 1 order of magnitude lower than the one obtained with simulations (Re ) 80). During the laser ablation process, polymer particles are ejected and then redeposit onto the substrate, resulting in a surface modification.34,35 The ablation (32) Karasso, P. S.; Mungal, M. G. J. Fluid Mech. 1996, 323, 23-63. (33) Johnson, T. J.; Ross, D.; Locascio, L. E. Anal. Chem. 2002, 74, 45-51. (34) Bolle, M.; Lazare, S. Appl. Surf. Sci. 1993, 69, 31-37. (35) Kelly, R.; Miotello, A.; Braren, B.; Otis, C. E. Appl. Phys. Lett. 1992, 60, 2980-2982.
Mixing simulations of species in a zigzag microchannel have been performed by a finite element method. Most of the calculations have been achieved at constant Peclet number (diffusion coefficient scaling) for different Reynolds numbers. Below a critical Reynolds number of ∼80, the flow profile remains parabolic and the mixing, only ensured by molecular diffusion, is strongly dependent on the effective length and width of the channel. Indeed, a large number of angles, inducing a larger effective width, worsens the mixing efficiency. For higher Reynolds numbers, results emphasize the effects of laminar recirculations along the channel. These recirculations induce a transversal component of the velocity, which improves the mixing process. The mixing efficiency obtained is then greatly enhanced, as compared to an equivalent straight channel. In addition, the decrease of D toward physical values illustrates an encouraging enhancement of this mixing gain. To extend these conclusions, lower values of D would be interesting to investigate with higher numerical capacity. Further numerical studies could also envisage (i) the effect of narrowing the zigzag angle value and (ii) the impact of recirculations on chemical reactions’ efficiency. From an experimental standpoint, it would be interesting to study the conditions that reduce the critical Reynolds number associated to the recirculation phenomenon, such as (i) channels with larger width and larger depth-to-width ratio or (ii) fluids with heavy particles or different densities using the inertial effect.
APPENDIX A Mesh Criteria. To maintain a low mesh Peclet number (eq 7), the mesh of the geometry should be refined in the zones of concentration gradient. The reduction of the size of the mesh, δmesh, prevents numerical instability induced by high local flow velocity, Vlocal, associated with low diffusion coefficient (i.e., high Peclet numbers).
Pemesh )
Vlocalδmesh D
(8)
However, in the case of an interface between two liquids featuring Analytical Chemistry, Vol. 74, No. 16, August 15, 2002
4285
Table 2. Effect of the Mesh Reynolds Number, Remesh, on the Flow Calculations for Three Different Reynolds Numbersa
Re 267
533
800
Vmax m s-1 2
4
6
Vmax,calc m s-1 5.19
10.76
16.78
mesh size δmesh, µm 2 5 10
Remesh
mixing efficiency, %
10.4 26 52
72.35 71.68 66.70
Table 3. Effect of the Mesh Peclet Number, Pemesh, on the Diffusion-Convection Calculations for Three Different Reynolds Numbersa
variation % Re 0.9 6.9
2 3 5 7.8
20.8 30 54 84
70.04 68.41 57.28 47.66
2.3 16.3 16.8
2 3 5
33.6 50.4 84
63.43 60.65 68.72
4.4 11.7
267 2 × 10⁻⁷
2
5.19
533 4 × 10⁻⁷
4
10.76
800 5 × 10⁻⁷
6
16.78
a
a Velocity field is injected in the diffusion-convection equation to analyze the precision based on the criterion of mixing efficiency.
recirculation phenomena, the diffusion layer is not located at a uniform distance from the channel walls. As a consequence, the mesh refinement should be applied on large zones, which rapidly increases the size of the finite element matrix representing the system. The noninfluence of the mesh size on the results has been verified for different calculations presented in Tables 2 and 3. For the hydrodynamic mesh, the mesh Reynolds numbers are presented in Table 2. The accuracy of the flow simulations is analyzed regarding the criterion of mixing efficiency. Because of computational limitations, the mesh size corresponding to calculations with minimal error