Dec 1, 2006 - arXiv:cond-mat/0612024v1 [cond-mat.stat-mech] 1 Dec 2006. Mode-locking transitions in nano-structured weakly disordered lasers.
Mode-locking transitions in nano-structured weakly disordered lasers L. Angelani1 , C. Conti2,3 , L. Prignano4, G. Ruocco3,4 , and F. Zamponi5
arXiv:cond-mat/0612024v1 [cond-mat.stat-mech] 1 Dec 2006
1
Research center SMC INFM-CNR, c/o Universit` a di Roma “La Sapienza,” I-00185, Roma, Italy 2 Centro studi e ricerche “Enrico Fermi”, Via Panisperna 89/A, I-00184, Roma, Italy 3 Research center Soft INFM-CNR, c/o Universit` a di Roma “La Sapienza,” I-00185, Roma, Italy 4 Dipartimento di Fisica, Universit` a di Roma “La Sapienza,” I-00185, Roma, Italy 5 Service de Physique Th´eorique, CEA Saclay, 91191 Gif sur Yvette Cedex, France
We report on a statistical approach to mode-locking transitions of nano-structured laser cavities characterized by an enhanced density of states. We show that the equations for the interacting modes can be mapped onto a statistical model exhibiting a first order thermodynamic transition, with the average mode-energy playing the role of inverse temperature. The transition corresponds to a phase-locking of modes. Extended modes lead to a mean-field like model, while in presence of localized modes, as due to a small disorder, the model has short range interactions. We show that simple scaling arguments lead to observable differences between transitions involving extended modes and those involving localized modes. We also show that the dynamics of the light modes can be exactly solved, predicting a jump in the relaxation time of the coherence functions at the transition. Finally, we link the thermodynamic transition to a topological singularity of the phase space, as previously reported for similar models.
I.
INTRODUCTION
Laser mode-locking (ML) is well known in standard optical resonators, which are characterized by equi-spaced resonances [1, 2]. ML in such a kind of systems is a valuable route for the generation of ultra-short pulses, in particular when it is “self-starting”, as due to the nonlinear interaction between laser longitudinal modes [3]. Given the growing interest in high-Q microresonators and photonic crystals [4, 5], it is interesting to consider ML in integrated devices, which could trigger a new generation of highly-miniaturized lasers emitting ultra-short pulses (see e.g. [6]). In this respect, there is a remarkable difference between standard resonators and nano-structured cavities; indeed the latter are characterized by a non-uniform distribution of resonances, given by a strongly modulated density of states (DOS) [5]. This situation favors a new formulation of the analysis of the self-mode locking transition, based on a mean-field thermodynamic approach: this is the topic of the present paper, also including the effect of some disorder in the system. The thermodynamic approach to multi-mode interactions in various physical frameworks is well established [7]. For example, it was recently applied to transverse-mode interaction in resonators [8, 9], as well as to standard-laser mode-locking transition [10, 11, 12]. This transition can be described in terms of an effective temperature T , which encompasses the level of noise due to spontaneous emission and the amount of energy stored into each mode. At high T the mode-phases are independent and rapidly varying (“free-run” or “paramagnetic phase”); conversely, either reducing the spontaneous emission noise or increasing the pumping rate, a low-temperature (“ferromagnetic”) phase can be reached, corresponding to the mode-phases locked at the same value. A paradigm that has been recently shown to be very effective for describing the nonlinear interaction of many
“modes”, and the resulting phase transitions and/or kinetic arrest is the potential energy landscape (PEL) approach (see e.g. [13, 14]). The PEL, as a manifold in the configurational phase space, has many stationary points (typically minima and saddles) [15], whose distribution strongly affects the thermodynamics (and the dynamics) of the system. Recently this paradigm, developed to investigate the glass transition phenomena, has been applied to the field of photonics, including optical solitons [16, 17] and random-lasers [18, 19]. In this respect, it is worth to note that the geometrical interpretation of the laser threshold was recognized since the beginning of laser theory, and is considered as one of the successful applications of catastrophe-theory, which classifies the singularities of multi-dimensional manifolds [7, 20]. It is not surprising, therefore, that the mode locking transition can be interpreted according to the thermodynamic/topological transition point of view. Extending the topological approach to the nano-laser is interesting for different reasons: on one hand this provides an elegant and comprehensive theoretical framework to laser theory, on the other hand it can be relevant from a fundamental physical perspective. Indeed, in recent literature the link between geometry and thermodynamics has been strongly debated [21, 22, 23, 24], and it is still to be established if this theoretical circumstance has physical consequences. Thus it is important to identify physical systems which can be treated by analytical solvable models (for what concerns both the thermodynamical and the topological properties). Here we show that mode-locked laser nano-cavities fall within this category. In addition we also report on explicit expressions of the first-order coherence function of the laser emission. This analysis predicts a jump in the relaxation time (and correspondingly in the laser linewidth) at the mode-locking transition. The scaling properties of the threshold average mode-energy at the transition are found to be strongly sensible to the degree of
2 localization of the involved modes. The outline of this manuscript is as follows: in section II we will recall the mode-coupling approach to multimode lasers; in section III we will discuss the physical signatures of transitions involving either localized or delocalized modes; in section IV we will report on the thermodynamic approach; the analysis of the topological origin of the laser transition is given in V; in section VI we briefly discuss the solution of the dynamics of the model; conclusions are drawn in section VII.
II.
MULTI-MODE LASER EQUATIONS
The coupled mode theory equations in a nonlinear cavity can be written in the form [11, 19, 25, 26] das ∂HI = − ∗ − αs as (t) + (γs − gs |as (t)|2 )as (t) + ηs (t) dt ∂as ∂H = − ∗ + ηs (t) , ∂as (1) with H = H o + HI ,
(2)
and Ho =
X s
=
X
1 (αs − γs )|as |2 + gs |as |4 2
(3)
Vs (as ).
s
In (1) s = 1, 2, .., N with N the total number of modes, while as is the complex amplitude of the mode at ωs , such that Es = ωs |as |2 is the energy stored in the mode. Radiation losses and material absorption, are represented by the coefficient αs , while γs − gs |as |2 represents the saturable gain term and, as usual, the quantum noise term due to spontaneous emission is given by a random term ηs such that hηs (t)ηp (t′ )i = 2kB Tbath δsp δ(t − t′ ), where kB is the Boltzmann constant and Tbath is an effective temperature [19]. The nonlinear interaction term is HI = Re[
1 X gspqr as ap a∗q a∗r ], 4
(4)
{spqr}
where the sum is extended over all mode resonances such that ωs + ωp = ωq + ωr . The term s = p = q = r is not included as it is already described by gs ; the Hamiltonian HI describes mode interaction due to the nonlinearity of the gain medium. The field overlap is given by Z √ ωs ωp ωq ωr gspqr = χαβγδ (ωs ; ωq , ωr , −ωp , r)× 2i (5) V × Esα Epβ Eqγ Erδ dV .
where V is the cavity volume, χ is the third ordersusceptibility tensor due to the resonant medium and Epα are the components (α = 1, 2, 3) of the vectorial mode of the cavity at the resonance ωp . χ is given, in the simplest formulation, by the Lamb theory [25, 26] and, neglecting mechanisms like self- and cross-phase modulation (which give phase-independent contribution to the relevant Hamiltonian, see below) can be taken as realvalued; under standard approximations, the tensor g is a quantity symmetric with respect to the exchange of any couple of indexes. By letting as (t) = As (t) exp [iϕs (t)], the H can be rewritten as X Gspqr cos(ϕs + ϕp − ϕq − ϕr ) (6) H(G, ϕ) = Ho + {spqr}
P
where Ho = s Vs (As ) only depends on the amplitudes and Gspqr = 2gspqr As Ap Aq Ar . As discussed in the literature [11] Eqs. (1) are Langevin equations for a system of N particles moving in 2N dimensions and the invariant measure is given by exp(−H/kB Tbath ). In a standard laser the resonant frequencies are equispaced and this gives rise to various formulations of laser thermodynamics, which are based on the fact that the ωs + ωp = ωq + ωr will only involve a limited number of interacting modes [10, 11]. The situation is drastically different for nano-structured systems displaying a photonic-band gap. It is indeed well established that in proximity of the band-edge, a DOS enhancement with respect to vacuum is obtained. All the corresponding modes will have overlapping resonance such that ωs ∼ = ω0 , (where ω0 is the position of the peak in the density of states, which is assumed to be in correspondence of the resonance of the amplifying atomic medium); additionally the resonance condition ωs + ωp = ωq + ωr need not to be exactly satisfied, but it sufficient that linewidth of the corresponding modes needs to be overlapped for a relevant interaction [27]. Hence for such a kind of system it is interesting to consider a mean field regime where all the modes interact in a limited spectral region around ω0 . For the mode-locking transition one can limit to consider the phase dynamics. Indeed ML entails the passage from a regime in which the mode-phases are independent and rapidly varying (“free-run” regime or “paramagnetic phase” in the following) [25] on times scales of the order of 10 fs [28], to a regime in which they are all locked at the same values (“ferromagnetic phase”). In correspondence of this transition the laser output switches from a continuous wave noisy emission to an highly modulated signal (which is a regular train of short-pulses for equi-spaced resonances). Mode-amplitude dynamics is not affected (at the first approximation) by the onset of ML. Indeed for lasing modes γs > αs , so that p the potential Vs (As ) has a single minimum in As = (γs − αs )/gs . Thus the amplitudes of the lasing modes will fluctuate around this minimum: we neglect these fluctuations, which are small if the potential well is deep enough, and threat the As as quenched variables (Es = ωs |as |2 ∼ = hEs i ≡ ω0 A2 for
3 the relevant modes). The relevant subspace spanned by the system is given by the phases, that are taken as the dynamic variables (see, for example, [1] for a discussion of the role of mode-phases with respect to amplitudes in ML processes).
III. LOCALIZED VERSUS DELOCALIZED MODES IN THE SELF-MODE-LOCKING TRANSITION
In previous works [18, 19] we made reference to a completely random resonator, for which the G coefficients were taken Gaussian distributed with zero mean. This is the natural approach when dealing with strongly disordered resonators, in which the involved modes can be localized or delocalized in the structure and the corresponding resonances and spatial distribution can have different degrees of overlaps (as in [29]). Here we make reference to the opposite regime, corresponding to case in which the structure is quasi-ordered, with the presence of a small amount of disorder. The disorder is such that the variations in the coupling coefficients gspqr can be taken as negligible with respect to their statistical average hgspqr i ≃ g, however it is sufficient to induce the existence of a tail of localized modes in the photonic band gap [30]. As discussed above, we consider mode-resonances packed in a small spectral region ∆ω ( if compared with the central carrier angular region, i.e. ∆ω 0, as detailed below. Note that, as we assumed that the condition øs +øp = øq +ør is not exactly satisfied, and possibly due to the presence of disorder, the integrand in (5) might have oscillations or fluctuations in sign that can affect the scaling of g with volume (the case of completely random fluctuations lead to a scaling g ∝ V −3/2 and to an extensive Hamiltonian as in [18, 19]). Intermediate regimes might be present depending on the strength of the disorder. Localized modes. Next we consider localized modes, that exponentially decay in space. Defining Vo as above, it turns that it does not scale with the volume V of the sample, but can be written as Vo = L3o where Lo is an average localization length. The overlap coefficients gspqr
4 will have a statistics strongly peaked around some average value g, measuring the average amount of spatial overlap between localized modes that are neighborhood in space. Hence the sum in the Hamiltonian will only involve first neighborhoods and HI ∝ V , while g will not depend on the size of the system. For the invariant measure we will have (the angular bracket in hspqri denoting sum over first neighborhoods): HI )= kB Tbath 4 X gA cos(ϕs + ϕp − ϕq − ϕr )] = exp[− kB Tbath exp(−
(9)
hspqri
exp[−βH (loc) ] ,
where β ≡ |g|A4 /kB Tbath ≡ 1/T will not depend on the system size (we stress that the system size must be such that a large number of localized modes are present), and the Hamiltonian (within irrelevant additive constants) is X [1 − cos(ϕs + ϕp − ϕq − ϕr )] . (10) H (loc) = hspqri
Summarizing, if the transition involves extended modes, the effective temperature for the critical transition is expected to depend on the size of the system; conversely for localized modes the critical temperature will be independent on the system size. Unfortunately, at variance with fully-connected (or “mean field”) models as (8), analytical treatment of short-range Hamiltonians as (10) is almost always impossible and the analysis can only be numerically performed. However, it is well established within the statistical physics community that mean-field models obtained from first-neighborhood systems conserve most of the thermodynamics properties, and more specifically the existence of a thermodynamic transition, at least above the so called “lower critical dimension” dl (for example, for the Ising model is dl = 1, for the XY model is dl = 2). Our model falls in the class of XY models so we expect that the transition exists, as long as d > 2, also in the case of localized modes, and the following analysis applies at least qualitatively. Since (8) can be analytically treated for thermodynamic, topological and dynamic properties we will limit to this model in the following. The existence of a thermodynamic/topological transition is expected in the general case, while the different scaling properties of the effective temperature enables to discern localized and delocalized interactions.
where H is H=
1 X [1 − cos(ϕs + ϕp − ϕq − ϕr )] . N 3 spqr
(12)
The Hamiltonian (12) is very similar to that defining the k-trigonometric model (k-TM) for k = 4, introduced in [23] with the aim of studying the relation between phase transitions and topological property of the potential energy surface [21, 31, 32]. Defining the “magnetization” 1 X iϕi z= (13) e = ξeiψ , N i where ξ and ψ depend on {ϕi }, we have " # 1 X H = Re [1 − exp i(ϕs + ϕp − ϕq − ϕr )] = N 3 spqr � � 1 4 2 ∗2 N (1 − z z ) = N (1 − ξ 4 ) . (14) = Re N3 By definition a vanishing z denotes uncorrelated phase, as in the “free run” regime, conversely if z 6= 0 the phase of the modes are correlated and locked. The thermodynamics of the mean-field model is exactly solved by neglecting the correlations between different degrees of freedom, and obtaining an effective Hamiltonian that contains a parameter to be determined self-consistently. Introducing the mean (complex) “magnetization” ζ = heiϕ i, and substituting in equation (12) the expression ej(ϕs +ϕp −ϕq −ϕr ) → ejϕs hejϕp ihe−jϕq ihe−jϕr i + +hejϕs iejϕp he−jϕq ihe−jϕr i + +hejϕs ihejϕp ie−jϕq he−jϕr i + +hejϕs ihejϕp ihe−jϕq ie−jϕr − −3hejϕs ihejϕp ihe−jϕq ihe−jϕr i = = 2ζζ ∗ (ejϕ ζ ∗ + e−jϕ ζ) − 3ζ 2 ζ ∗2 = 4ζ 3 cos ϕ − 3ζ 4 (15) where the last equality stands because we have chosen ζ to be real without loss of generality (corresponding to choosing a particular magnetization of the low temperature state), the effective Hamiltonian h per degree of freedom reads as h(ϕ) = 1 + 3ζ 4 − 4ζ 3 cos ϕ .
(16)
The self-consistent equation for ζ turns out to be IV.
THERMODYNAMICS
In this Section we study the thermodynamics of the laser Hamiltonian in the mean field approximation (8), within the quenched amplitudes approximation. The partition function is Z Z = dϕ e−βH(ϕ) (11)
ζ = hcos ϕih =
I1 (4βζ 3 ) , I0 (4βζ 3 )
(17)
R 2π where I0 (α) = (2π)−1 0 dϕ exp(α cos ϕ) and I1 (α) = I0′ (α) are the modified Bessel function of order 0 and 1, and h. . . ih is the average over the probability distribution P (ϕ) =
e−βh(ϕ) , Z
(18)
5 1.0
0.3
0.6
ζ
To
0.2
f - fo
(a)
0.8
0.4 0.2
0.1
0.0
Tc
0.0
1.0
(b)
0.8
e
-0.1 0.0
0.2
0.4
0.8
0.6
1.0
ζ
0.6 0.4
0.0 0.0
FIG. 1: (Color online) Free energy f (ζ)−f (ζ = 0) as a function of magnetization ζ at different temperatures. From high to low: T = 0.910, To = 0.717, T = 0.616, Tc = 0.548, T = 0.504. To marks the appearance of the unstable minimum, Tc is the transition temperature at which the solution with ζ > 0 becomes thermodynamically stable.
with Z=
Z
2π
dϕ e−βh(ϕ) = 2π e−β(1+3ζ
4
)
I0 (4βζ 3 ) . (19)
0
The solution of Eq. (17) are the extrema of the free energy f as a function of ζ βf = − ln Z = β(1 + 3ζ 4 ) − ln 2πI0 (4βζ 3 ) ,
(20)
whose absolute minimum is the thermodynamical stable solution. The value ζ = 0, corresponding to the paramagnetic solution, always solves equation (17), but it gives the stable (lower free-energy) solution only for low β (high T ). On lowering T , at To = 0.717 other solutions appear, such that ζ 6= 0. However, the stable solution is still the paramagnetic one ζ = 0. At Tc = 0.548 the solution ζ 6= 0 becomes the stable one, and a first-order phase transition takes place. In Fig. 1 the ζ-dependence of the free energy f is reported for different temperatures. The stable solution ζ(T ) is shown in Fig. 2a (full line) while dashed lines denote unstable solutions (local minimum and maximum). In Fig. 2b the T -dependence of the energy e=−
Tc
0.2
∂ ln Z = 1 − ζ 4 , ∂β
(21)
is shown for the stable (full line) and unstable (dashed lines) solutions. A remark on the sign of the coupling g. For g > 0 the sign of the cos term in the Hamiltonian (12) is positive and the self-consistent equation reads ζ = −I1 (β∆4ζ 3 )/I0 (β∆4ζ 3 ), which has the only solution ζ = 0. Then, in this case the phase transition does not take place.
0.2
0.4
T
0.6
To 0.8
FIG. 2: (Color online) Magnetization ζ - part (a) - and energy e - part (b) - as a function of temperature. Full lines correspond to the thermodynamically stable solution of Eq. (17), dashed lines are the unstable solutions. At Tc = 0.548 a first-order thermodynamic phase transition takes place, while at To = 0.717 unstable solutions appear.
V.
TOPOLOGY
After having ascertained the existence of a first-order phase-transition, we consider the property of the stationary points (saddles) of the potential energy landscape of the system [23]. As said in the Introduction, in recent works [21, 22], it has been conjectured that phase transitions are signaled by discontinuities in the configuration space topology. More precisely, for a system defined by a continuous potential energy function V (q) (q denotes the N-dimensional vector of the generalized coordinates) a thermodynamic phase transition occurring at Tc (corresponding to energy Vc ) is the manifestation of a topological discontinuity taking place at Vc (“topological hypothesis”). The most striking consequence of this hypothesis is that the signature of a phase transition is present in the topology of the configuration space independently on the statistical measure defined on it. Through Morse theory, topological changes are related to the presence of stationary points of V , and, more specifically, to the discontinuous behavior of invariant quantity defined on them, as the Euler characteristic χ. Subsequent works [33, 34] have shown that, at least for some model system, a “weak topological hypothesis” applies in place of the “strong” one: the Vθ at which a topological transition takes place does not coincide with the thermodynamic one Vc 6= Vθ , but is related to it by a saddle-map M , from equilibrium energy level to stationary point energy: M (Vc ) = Vθ . Then, the role of saddles has been demonstrated to be of high relevance for the topological interpretation of thermodynamic transitions. Here we report on the saddle properties of the considered nano-laser
6 model. The stationary point ϕ are defined by the condition dH(ϕ) = 0 and their order is defined as the number of negative eigenvalues of the Hessian matrix Hij = (∂ 2 H/∂ϕi ∂ϕj )|ϕ . To determine the location of stationary point we have to solve the system ∀k
(22)
where we have used Eqs. (13) and (14). A first group of solutions arises for� ξ = 0; from equation (14) we have H = N 1 − ξ 4 , and then the stationary points with ξ(ϕ) = 0 are located at the energy e = H(ϕ)/N = 1. Now we restrict ourselves to the region e 6= 1 because, as we will see at the end, the quantities in which we are interested are singular when e = 1. For e 6= 1, equation (22) becomes ∀k
(23)
and its solutions are ϕk = [ψ + mk π]mod
(24)
2π
where mk = {0, 1}. The unknown constant ψ is found by substituting Eq. (24) in the self-consistency equation P P z = ξeiψP = N −1 i eiϕi = N −1 i ei(ψ+mi π) = (25) mi −1 iψ . N e i (−1)
Introducing the quantity n(ϕ) defined by X X (−1)mi mi , 1 − 2n = N −1 n = N −1
(26)
i
i
we have, from equation (25), ξ = 1 − 2n .
(27)
As ξ is positive defined, the only solutions are for n < 1/2: there are not stationary points with n > 1/2. For n < 1/2 ψ can assume all the values in [0, 2π) for any choice of the set {mk } and all the stationary points of energy e 6= 1 have the form ϕm k
= [ψ + mk π]mod
2π
, where m = {mk }, mk = (0, 1) (28)
under the condition n = N −1
X
0.6 0.5
σ
∂H = 4ξ 3 sin(ϕk − ψ) = 0, ∂ϕk
sin(ϕk − ψ) = 0
0.7
mk < 1/2 .
k
The Hessian matrix is given by n Hij = 4ξ 2 − N4 ξ 2 sin(ϕi − ψ) sin(ϕj − ψ)− o 1 cos(ϕ − ϕ ) + δ ξ cos(ϕ − ψ) . i j ij i N
(29)
In the thermodynamic limit it becomes diagonal, Hij ≃ 4ξ 3 δij cos(ϕi − ψ) .
(30)
0.4 0.3 0.2 0.1 0.0 0.0
1.0
0.5
1.5
e FIG. 3: (Color online) The entropy of saddles σ as a function of potential energy e.
Neglecting the off-diagonal contributions (their contribution changes the sign of at most one of the N eigenvalues [23]) the eigenvalues λk of the Hessian calculated at the stationary point ϕ are obtained substituting equation (28) in (30), λk = (−1)mk 4ξ 3 .
(31)
Therefore, the stationary point order ν(ϕ), defined as the number of negative eigenvalues of the Hessian matrix, is simply the number of mk = 1 in the set m associated with ϕ; we can identify the quantity n(ϕ) given by equation (26) with the fractional order ν(ϕ)/N < 1/2 of ϕ. Then, from equation (14) and (27) we get a relation between the fractional order n(ϕ) and the potential energy e(ϕ) = H(ϕ)/N at each stationary point ϕ. It reads i 1h (32) 1 − (1 − e)1/4 , n= 2 where we have used the condition n < 1/2. Equation (32) brings the condition 1 − e > 0,
(33)
so there are no stationary points for e > 1, while for e < 1 the fractional order n = ν/N of the stationary points is a well defined monotonic function of their potential energy e, given by equation (32). The number of stationary points of a given order (apart a degeneracy factor) is proportional to the number of ways in �which one can choose ν times 1 among the {mk }, i.e. N ν . Following [23], its logarithm � N σ(e) = limN →∞ N1 ln N n(e) = (34) −n(e) ln n(e) − (1 − n(e)) ln(1 − n(e)) , represents the configurational entropy of the saddles. Substituting in this expression equation (32) we have i �1 h i� 1h 1/4 1/4 ln − 1 − (1 − e) σ(e) = − 1 − (1 − e) 2 2
7 −
i �1 h i� 1h . 1 + (1 − e)1/4 ln 1 + (1 − e)1/4 2 2
(35)
For e > 1 indeed we have, obviously, σ(e) = 0. This quantity is related to the Euler characteristic χ of the manifolds Me = {ϕ|H(ϕ) ≤ N e} [23] and its singular behavior around the point e = 1 is related to both the presence and the order of the phase transition that occurs. In figure 3 the quantity σ is reported as a function of energy e: one can see that the presence of a phase transition is signaled by a singularity of σ(e) at the transition point e = 1. It is worth noting that the curvature of the quantity σ(e) around the transition point e = 1 is positive, according to what found in Ref. [23] for first order transitions. Summarizing, the study of stationary points shows that the presence of the phase transition is signaled by the stationary point properties. More specifically, the singular behavior of the configurational entropy σ(e) at transition point e = 1 is the topological counterpart of the thermodynamic transition. We note that these findings do not allow to discriminate between the strong and weak topological hypothesis, as in this case the map M from equilibrium energy levels to stationary point energies is trivially the identity at the transition point e = 1: M (1) = 1 [24].
VI.
hEn∗ (t0 )En (t0 + t)i , hEn∗ (t0 )En (t0 )i
(36)
F (1) (t) −iω0 t e , F (1) (0)
(37)
√ where En (t) = ωn an exp(−iωn t) is the electric field emitted at the angular frequency ωn (omitting an inessential factor depending on the point in space where the field is measured). For quenched amplitudes, ωn A2n ∼ = ω0 A2 , one has (omitting the mode-index n)
where F (1) (t) is the unnormalized single mode first order coherence given by F (1) (t) = heiϕ(t) e−iϕ(0) i ,
F (t) can be explicitly calculated in the mean field theory (see Ref. [24] for all the details of the computation). In fact it can be shown that the single mode dynamics can be mapped into the effective equation γ ϕ(t) ˙ = −4ζ 3 sin ϕ(t) + η(t) ,
(40)
where ζ is the thermodynamic value of the magnetization we determined in section (IV), η a δ-correlated Gaussian noise with variance 2γT , and γ a constant fixing the timescale (in the following we use units such that γ = 1). From Eq. (40) it is evident that in the paramagnetic phase (ζ = 0) the phases will freely diffuse, while in the ordered (mode-locked) phase they fluctuate around a given value that, without loss of generality, can be taken as ϕ = 0. Eq. (40) can be solved and the self-correlation function of a single mode
F (t) = Fc (t) + Fs (t) ,
(41)
(38)
(42)
where Fc (t) = hcos ϕ(t) cos ϕ(0)i − hcos ϕ(t)ihcos ϕ(0)i Fs (t) = hsin ϕ(t) sin ϕ(0)i .
We start considering the single-mode (“self”) first order coherence [35]:
g (1) (t) =
(39)
can be computed [24]. Using symmetry properties, the above function can be written as
Single-mode first order coherence
gn(1) (t) =
F (t) = F (1) (t) − F (1) (∞) .
F (t) = heiϕ(t) e−iϕ(0) i − heiϕ(t) ihe−iϕ(0) i
COHERENCE PROPERTIES AND DYNAMICS
The dynamics of interacting lasing modes close to the mode-locking transition can also be investigated; it leads to explicit results for measurable correlation functions.
A.
and we used the fact that at equilibrium the time average over t0 can be replaced by a statistical average [35]. Below the threshold (T > Tc ) the phases are uniformly distribute in [0, 2π), so that F (1) (t → ∞) = 0. In contrast, at mode-locking the phase is blocked around a fixed value, thus F (1) (t → ∞) 6= 0. We are interested in the time-delay-profile of coherence function given by
(43)
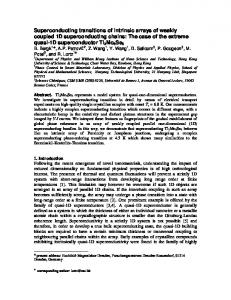
Following [24] the self correlations (43) can be numerically determined and they turn out to be nearly exponential at all temperatures, Fc (t) ∝ e−t/τc and Fs (t) ∝ e−t/τs . In Fig.4, the function F (t)/F (0) is shown for different temperatures. Upon increasing T the decorrelation time increases for T < Tc , while it decreases for T > Tc (after a sudden jump at Tc ). This behavior is evident analyzing the T -dependence of the relaxation time. In the upper panel of Fig.5 the quantity τc is shown as a function of temperature. Full lines refer to stable states, while dashed lines to unstable ones. We note that in paramagnetic high-T phase τc (and τs ) have a 1/T -dependence, as expected for free Brownian motion. In the low-T phase the behavior of τs (not showed in the Figure) is very similar to that of τc . Summarizing, in absence of mode-locking the singlemode first-order coherence function has an exponential trend (corresponding to a Lorentzian linewidth), whose relaxation time decreases as the average energy per mode
8 1.0
2.0 0.8
F(t) / F(0)
τc
1.5
0.6
1.0 0.5
T > Tc
T < Tc 0.4
0.0 2.0
0.2
Collective
10
-1
10
0
10
1
1.0 0.5
t
Tc 0.0 0.0
FIG. 4: (Color online) Time dependence of the self correlation function F (t) at different temperatures. From left to right: T = 0.1, 0.5, 0.6, 1.0 (Tc = 0.548). Time is in normalized units.
is reduced (i.e. the temperature is increased). At the mode-locking transition, the coherence function is expressed as the sum of two exponentials (corresponding to the two quadratures of the phase-modulated laser signal), whose time-constants have a jump with respect to the “free-run” regime, and decreases while increasing the average energy per mode (and hence reducing the temperature). B.
(b)
1.5
τcG
0.0 -2 10
(a)
Self
Multi-mode first order coherence
Here we consider the multi-mode (“collective”) first order coherence: g (1) (t) =
hE ∗ (t0 )E(t0 + t)i , hE ∗ (t0 )E(t0 )i
g (1) (t) =
G(1) (t) −iω0 t e , G(1) (0)
(45)
where we have taken ωn ∼ = ω0 (since all the modes are taken as densely packed around ω0 , small differences between ωn and ω0 can be embedded in the phase ϕn ), and 1 X iϕn (t) −iϕm (0) G(1) (t) = 2 he e i = hz(t)z ∗ (0)i , (46) N nm is thePcorrelation function of the magnetization z(t) = N −1 n exp [iϕn (t)]. We can write G(1) (t) = G(1) (∞) +
1 1 G(t) = ζ 2 + G(t) , N N
(47)
where G(1) (∞) = ζ 2 is the asymptotic value (we recall that ζ = hzi is assumed real), which is acquired at the
0.4
T
0.6
0.8
FIG. 5: (Color online) (a) Relaxation time τc of the self correlation function Fc (t) as a function of T . Full line corresponds to stable state (paramagnetic above Tc and ferromagnetic below it). Dashed lines refer to unstable solutions. (b) Relaxation time τcG of the collective correlation function Gc (t) as a function of T . Full and dashed lines as before.
mode-locking transition, and the collective connected correlation function G(t) is defined as G(t) = N [G(1) (t) − G(1) (∞)] = 1 X iϕn (t) −iϕm (0) [he e i − heiϕn (t) ihe−iϕm (0) i] . N nm
(48)
This function has a finite limit for N → ∞, see the Appendix, which can be computed following [24]. As for F (t), G(t) can be written as a sum of two terms G(t) = Gc (t) + Gs (t) ,
(44)
P √ with E(t) = n ωn an exp(−iωn t). In the quenched amplitudes approximation, proceeding as above, it is possible to write
0.2
To
(49)
with Gc (t) =
1 X [hcos ϕn (t) cos ϕm (0)i− N nm
− hcos ϕn (t)ihcos ϕm (0)i] , 1 X Gs (t) = [hsin ϕn (t) sin ϕm (0)i . N nm
(50)
G
Again one finds an exponential decay, Gc (t) ∝ e−t/τc G and Gs (t) ∝ e−t/τs [24]. In the lower panel of Fig.5 the G relaxation time τc is shown as a function of temperature. We hence expect a trend for G(t) which resembles F (t); however it is worth noting that the quantity τcG diverges when T → To− , that is, when, starting from low T phase, the point where the unstable solution (dashed line) disappear is approached. The occurrence of the thermodynamic transition at Tc < To prevents the divergence of τcG . The τsG (not shown) does not diverge at To .
9 C.
VII.
Multi-mode second order coherence
We also consider the multi-mode (collective) secondorder coherence: hE ∗ (t0 )E ∗ (t0 + t)E(t0 )E(t0 + t)i hE ∗ (t0 )E(t0 )i2 hI(t0 )I(t0 + t)i . = hI(t0 )i2
g (2) (t) =
(51)
again with E(t) =
X√ n
We get
ωn an e−iωn t ∝ z(t)e−iω0 t .
g (2) (t) =
G(2) (t) , G(2) (∞)
(52)
(53)
where G(2) (t) = hz(t)z ∗ (t)z(0)z ∗ (0)i. We can decompose this function in its connected components (see Ref.[36], Eq. 4.23); recalling that ζ = hzi is assumed real we get G(2) (t) = hz(t)z ∗ (t)z(0)z ∗ (0)ic + ζG3 (t) + hz(0)z ∗ (0)i2c + |hz(t)z(0)ic |2
(54)
+ |hz(t)z ∗ (0)ic |2 + ζ 4 ,
where the function G3 (t) is a sum of connected three-point functions: G3 (t) = 2Re[hz(t)z ∗ (t)z(0)ic + hz(t)z(0)z ∗ (0)ic ]. Using the results of the Appendix, we have hz(t)z ∗ (t)z(0)z ∗ (0)ic ∝ N −3 and G3 ∝ N −2 ; from Eq.s (48), (50), we have hz(0)z ∗ (0)ic = N −1 G(0) ,
hz(t)z(0)ic = N −1 [Gc (t) − Gs (t)] , ∗
hz(t)z (0)ic = N
−1
(55)
[Gc (t) + Gs (t)] .
Then we obtain G(0)2 + 2Gc (t)2 + 2Gs (t)2 N2 −3 + ζG3 (t) + O(N ) .
G(2) (t) = ζ 4 +
(56)
In the paramagnetic phase, ζ = 0, and by symmetry Gs (t) = Gc (t) = G(t)/2; moreover these functions tend to 0 for t → ∞. Then we get G(0)2 + 2Gc (t)2 + 2Gs (t)2 G(0)2 2 G(t) =1+ = 1 + |g (1) (t)|2 , G(0)2
g (2) (t) =
(57)
where we make use also of Eq. (47). This result is indeed what we expect for light modes evolving independently and rapidly. In the mode-locked phase Eq. (57) will not hold but a relation between g (2) and g (1) can still in principle be deduced from the knowledge of function G3 (t), using Eq. (56) and (47). Future works will address this point.
CONCLUSIONS
By using a simple model that is expected to describe multi-mode dynamics of tightly packed extended and/or localized modes in a nano-optical resonator, we predict the existence of a first-order phase-locking transition when the averaged energy per mode is above a critical value (correspondingly the adimensional effective temperature is below Tc ). This value depends on the average value of the mode-overlap coefficient g. If the transition involve extended modes, one has (omitting indexes) R g∼ = χ0 ω02 V −1 , with χ0 a reference suscep= ω02 |E|4 dV ∼ tibility value. Conversely if localized modes are involved it is g ∼ = χ0 V0.2 ω02 where V0 is the average localized mode volume (V0 ∝ L20 with L0 the localization length). In the former case, for a fixed spontaneous emission noise Tbath , it is found that the critical mean energy per mode is V -dependent Ec(ext) = ω0 A2 =
s
kB Tbath V , T c χ0
(58)
kB Tbath L30 . T c χ0
(59)
while for localized modes Ec(loc) = ω0 A2 =
s
Hence the critical energy for the phase-locking transition has very different scaling behavior with respect to the system size, depending on the degree of localization of the involved modes. In the general case one can expect intermediate regimes between those considered, so that the trend of the critical energy (determined by the amount of energy pumped in the system per unit time, i.e. the pumping rate) versus system volume is an interesting quantity which can experimentally investigated. A topology-thermodynamics relationship has been evidenced for our model, corroborating previous findings on this topic: the thermodynamic transition is signaled by a singularity in the topological quantity σ. The exact solution of the dynamics of the model predicts the divergence of the relaxation time of the firstorder coherence function g (1) at the transition. This behavior might be observed in experiments; the different scaling with respect to the systems size also affect the position of the transition, as determined by the predicted jump in the relaxation time or, equivalently, in an abrupt change of the single-mode laser linewidth while varying the pumping rate. This analysis points out the rich phase-space structure displayed by these systems, while varying the amount of disorder or the profile of the density of states. Hence nano-lasers not only may furnish the basis for highly integrated short-pulse generators, but are a valuable framework for fundamental physical studies. These deserve future theoretical and experimental investigations and can be extended to other nonlinear multi-mode interactions.
10 This simple argument shows that hz k ic ∝ N 1−k . In particular,
Appendix
We discuss here the scaling of the correlations of z when N → ∞. The basic fact is that the variable z is intensive and, for a mean field system, has a probability distribution of the form [36] PN (z) = eN F (z) ,
(60)
where F is related to the thermodynamic free energy of the system. Consider the generating functional Z eN F (j) = heN jz i = dzeN [F (z)+jz] , (61) then for large N , F (j) = maxz [F (z)+jz] and it is a quantity of order 1. The connected correlation functions [36] are derivatives of N F (j) with respect to N j: k δ k N F (j) 1−k δ F (j) k =N . (62) hz ic = k k (δN j) j=0 (δj) j=0 [1] A. Yariv, Quantum Electronics (Saunders College, San Diego, 1991). [2] A. E. Siegman, Lasers (University Science Books, Sausalito, CA, 1986). [3] H. A. Haus, IEEE J. Quantum Electron. 6, 1173 (2000). [4] J. D. Joannopoulos, P. R. Villeneuve, and S. Fan, Photonic Crystals (Princeton University Press, Princeton, 1995). [5] K. Sakoda, Optical Properties of Photonic Crystals (Springer-Verlag, Berlin, 2001). [6] Y. Liu, Z. Wang, M. Han, S. Fan, and R. Dutton, Opt. Express 13, 4539 (2006). [7] H. Haken, Synergetics (Springer-Verlag, Berlin, 1978). [8] F. Papoff and G. D’Alessandro, Phys. Rev. A 70 (2004). [9] E. Cabrera, M. Sonia, O. G. Calderon, and J. M. Guerra, Opt. Lett. 31, 1067 (2006). [10] A. Gordon and B. Fischer, Phys. Rev. Lett. 89, 103901 (2002). [11] A. Gordon and B. Fischer, Opt. Comm. 223, 151 (2003). [12] J. Sierks, T. J. Latz, V. M. Baev, and P. E. Toschek, Phys. Rev. A 57, 2186 (1998). [13] P. G. De Benedetti and F. H. Stillinger, Nature 410, 259 (2001). [14] D. Wales, Energy Landscapes (Cambridge University Press, Cambridge, 2004). [15] L. Angelani, R. Di Leonardo, G. Ruocco, A. Scala, and G. Sciortino, Phys. Rev. Lett. 85, 5356 (2000). [16] C. Conti, Phys. Rev. E 72, 066620 (2005). [17] C. Conti, M. Peccianti, and G. Assanto, Opt. Lett. 31, 2030 (2006). [18] L. Angelani, C. Conti, G. Ruocco, and F. Zamponi, Phys. Rev. Lett. 96, 065702 (2006). [19] L. Angelani, C. Conti, G. Ruocco, and F. Zamponi, Phys. Rev. B 74, 104207 (2006).
hz 2 ic = hz 2 i − hzi2 ∝ N −1 , hz 3 ic = hz 3 i − 3hzihz 2 ic − hzi3 ∝ N −2 , (63) 4 4 3 2 2 4 −3 hz ic = hz i − 4hzihz ic − 3hz ic − hzi ∝ N . We assumed that z is real but the same derivation can be repeated for a complex variable; the only difference is in the definition of the connected correlation functions. For the dynamics, one can write a similar expression for the probability of a trajectory z(t), see [24] and references therein: PN [z(t)] = eN F [z(t)] .
(64)
Repeating the derivation above using functional integrals one obtains exactly the same results for the scaling with N.
[20] R. Gilmore, Catastrophe Theory for Scientists and Engineers (Dover, New York, 1981). [21] L. Casetti, M. Pettini, and E. Choen, Phys. Rep. 337, 237 (2000). [22] R. Franzosi and M. Pettini, Phys. Rev, Lett. 92, 060601 (2004). [23] L. Angelani, L. Casetti, M. Pettini, G. Ruocco, and F. Zamponi, Europhys. Lett. 62, 775 (2003). [24] F. Zamponi, L. Angelani, L. Cugliandolo, J. Kurchan, and G. Ruocco, J. Phys. A: Math. Gen 36, 8565 (2003). [25] W. E. Lamb, Phys. Rev. 134, A1429 (1964). [26] I. C. L. O’Bryan and I. M. Sargent, Phys. Rev. A 8, 3071 (1973). [27] P. Meystre and M. SargentIII, Elements of Quantum Optics (Springer, 1998). [28] W. Brunner and H. Paul, Optical and Quantum Electronics 15, 87 (1983). [29] S. Mujumdar, M. Ricci, R. Torre, and D. S. Wiersma, Phys. Rev. Lett. 93, 053903 (2004). [30] S. John, Phys. Rev. Lett. 58, 2486 (1987). [31] L. Angelani, L. Casetti, M. Pettini, G. Ruocco, and F. Zamponi, Phys. Rev. E 71, 036152 (2005). [32] L. Angelani, G. Ruocco, and F. Zamponi, J. Chem. Phys. 118, 8301 (2003). [33] A. Andronico, L. Angelani, G. Ruocco, and F. Zamponi, Phys. Rev. E 70, 041101 (2004). [34] L. Angelani, G. Ruocco, and F. Zamponi, Phys. Rev. E 72, 016122 (2005). [35] R. Loudon, The Quantum Theory of Light (Clarendon Press, Oxford, 1983), 2nd ed. [36] G. Parisi, Statistical field theory (Academic Press, New York, 1998).