PROCEEDINGS OF THE INT. WORKSHOP ON INTERACTIVE SONIFICATION, BIELEFELD, JAN. 2004
Model-based Target Sonification on Mobile Devices Parisa Eslambolchilar, Andrew Crossan, Roderick Murray-Smith
Abstract—We investigate the use of audio and haptic feedback to augment the display of a mobile device controlled by tilt input. We provide an example of this based on Doppler effects, which highlight the user’s approach to a target, or a target’s movement from the current state, in the same way we hear the pitch of a siren change as it passes us. Twelve participants practiced navigation/browsing a state-space that was displayed via audio and vibrotactile modalities. We implemented the experiment on a Pocket PC, with an accelerometer attached to the serial port and a headset attached to audio port. Users navigated through the environment by tilting the device. Feedback was provided by audio displayed via a headset, and by vibrotactile information displayed via a vibrotactile unit in the Pocket PC. Users selected targets placed randomly in the state-space, supported by combinations of audio, visual and vibrotactile cues. The speed of target acquisition and error rate were measured, and summary statistics on the acquisition trajectories were calculated. These data were used to compare different display combinations and configurations. The results in the paper quantified the changes brought by predictive or ‘quickened’ sonified displays in mobile, gestural interaction. Index Terms—Auditory interfaces, Doppler effect, haptic feedback, display quickening, handheld devices, accelerometer input. I.
INTRODUCTION
A. Background
M
obile telephones, PDAs and handheld computers are now some of the most widely used computer interfaces. These devices have a limited amount of screen space on which to display information [1]-[3]. Low graphics resolution and few colours in these devices do not help designers to design complicated interfaces. The other problem is they present static information- phonebook, calendar, reminders, etc [3]. So browsing and exploring data is not as easy as standard desktop interfaces. Also if users are performing tasks while walking or driving they cannot devote all of their visual attention to the mobile devices. One way around this problem would be sonically enhanced interfaces that require less visual attention and therefore potentially interfere less in the main activity in Manuscript received December 15th, 2003. Parisa Eslambolchilar is research student at the Hamilton Institute, National University of Ireland, Maynooth, Co.Kildare, Ireland, e-mail:
[email protected] Dr. Andrew Crossan is a research fellow at the Hamilton Institute, National University of Ireland, Maynooth, Co.Kildare, Ireland, e-mail:
[email protected] Dr. Roderick Murray-Smith is a Reader in the Department of Computing Science, Glasgow University, Glasgow G12 8QQ, Scotland. He is also a Senior Researcher at Hamilton Institute, NUI Maynooth, Co. Kildare, Ireland; email:
[email protected]
which the user is engaged. Sonified data has a lot of promise, as it is a way of displaying data that does not take any screen space. The ears also have a higher temporal sensitivity than the eyes and this makes sound a good way to present timevarying data [3]. Users commonly underuse some of the facilities in their mobiles. The single audio output channel has been little used to improve interaction in mobile devices. Speech sounds are, of course, used in mobile phones when calls are being made but are not used by the telephone to aid the interaction with the device [4]-[6]. Non-speech sounds and vibrotactile devices are used for ringing tones or alarms but again do not help the user interact with the system beyond this. There is now evidence that sound can improve interaction and may be very powerful in small screen devices [6]. Selecting items with a stylus in PDAs is often confusing for users without tactile feedback because it is hard to know they have hit the target or not [6]. In this case vibrators in mobile phones could be a good haptic feedback. In this paper we investigate the use of sound, particularly musical sound and haptic feedback to augment the display of a mobile device controlled by gesture input. Music has advantages over speech in that it is faster and language independent. Manual control theory provides a rich theory supporting display of states for humans interacting with dynamic systems [11]. This paper translates these ideas into a mobile, gestural interface context. B. Paper structure The rest of this paper will outline model-based sonification, using the Doppler effect, and haptic feedback for browsing and exploring data in PocketPCs. An experimental comparison of different design options is described. The paper ends with a conclusion, where some possible extensions are proposed. II. MODEL BASED SONIFICATION A. Sonification Sonification is defined as the use of non-speech audio to convey information. More specifically, sonification is the transformation of data relations into perceived relations in an acoustic signal for the purposes of facilitating communication or interpretation [7]. Many of the major current research areas in sonification are similar in that they focus on the identification of applications for which audition provides advantages over other modalities, especially for situations where temporal features are important or the visual modality is overtaxed. The main issues that will move sonification research forward include (1) mapping data onto appropriate sound features like time stamp, volume, pitch, timbre, (2) understanding dynamic sound perception, (3) investigating auditory streaming, (4) defining and categorizing salience in general auditory contexts and understanding where highly salient sonic events or patterns
PROCEEDINGS OF THE INT. WORKSHOP ON INTERACTIVE SONIFICATION, BIELEFELD, JAN. 2004 can surpass visual representations in data mining, and (5) developing multimodal applications of sonification [7]. So sonification is a way to help in the exploration of complex data. Various kinds of information can be presented using sonification, simply by using different acoustic elements. This information has been organized in [8]. The selection of acoustic elements can be relevant to: (1) the properties of the data distribution in the space, (2) the structure of data distribution, (3) user expectation; for example, to represent a higher distance by a lower volume would match our expectations. In these applications there are different targets scattered in the space randomly. The individual targets are audible when the cursor is in their locality, and the user can move the cursor state by tilting the device. The task set to participants is to select individual targets that appear (in audio but not visually) in different locations, as accurately as possible. So for each target a vibration feedback has been assigned and whenever the user reaches over a target he/she feels vibration. This vibration has two benefits, (1) it assures the user that he/she is in the target, (2) if the user wants to select a target he/she can then press a key in the vibration area to select it. One way to sonify the data that has been used in this work is to generate a continuous sound for each data point. So the relative position to the targets is perceived by a change of volume when passing the data point. This effect is called the Doppler effect and the following section will talk about it in more detail. B. Doppler Effect Nature has optimized our auditory system to extract information from auditory signals we hear in our physical environments. The Doppler effect is a phenomenon observed whenever the source of waves is moving with respect to an observer. While moving towards the sound source the Doppler effect would influence pitch and would be a useful cue for the perception of spatial relation [8]. The change in pitch is a function of the difference in relative velocity of observer and source. As the source and observer move closer, the sound waves may be thought of as being compressed together, and therefore, because the wavelength decreases, the apparent pitch rises. Similarly, as the source and observer move apart, the waves are expanded and the increased wavelength corresponds to a drop in pitch. The state space in the experiment was 800m by 1200 m. The scale shift for the Doppler effect was 1, with the speed of sound in the space (air) being 340m/s. So the maximum timedelay in this space was about 3.53 seconds. C. Quickening ‘Quickening’ is a method for reducing the difficulty of controlling second-order or higher order systems that was proposed by Birmingham and Taylor [13], and is reviewed in [11]. A quickened display for an acceleration control system like the system described in this paper shows the user a weighted combination of position and velocity. This weighted summation effectively anticipates the future position of the system. It can greatly improve human performance in controlling these systems. Quickening in general is a
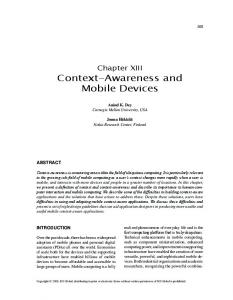
prediction of the future state of the system based on the current state (for example position, velocity, acceleration, and so on). An example of this is based on the Doppler effect, which highlights the user’s approach to a target, or a target’s movement from the current state, in the same way we hear the pitch of an ambulance siren change as it passes us at speed. III. METHOD A. Participants Three women and nine men, all sighted, with a mean age of 29 years participated. Four participants were research fellows, and the rest were postgraduates. All but one of the participants had neither experience of using PocketPCs nor with accelerometer-based interfaces. Two of them were left-handed. B. Platform In this experiment, we have a pocketPC (hp5450), an accelerometer (Xsens P3C, 3 degree-of-freedom) attached to the serial port, which allows users to navigate through the environment by tilting the device, and a headset (Fig.1, Fig.2). The built-in vibrator unit in the Pocket PCs provides the haptic feedback in the experiment. C. Procedure The participants were asked to sit on a chair in a quiet office and were equipped with a headset over their head and PocketPC in their palm. First they were informed about the functioning of the accelerometer, Doppler effect, and the procedures of the experiment. Then the participants were instructed that their task was to select individual targets that appear in different locations on the screen as accurate as possible by pressing a key whenever they feel they are in center of audio source. They were told to emphasize accurately over speed. There were four experimental conditions: (1) No Doppler effect, no vibration feedback (2) No Doppler effect, but vibration feedback, (3) Doppler effect, no vibration feedback and (4) Doppler effect, vibration feedback. The participants performed the conditions in a counterbalanced order. This resulted in 12 different orders of experiments for participants. In each experiment seven audio sources were used (a selection of different music) summarized in Table.1. These sources were scattered in the space randomly, but were not displayed visually to the users, so they could only hear music in the space and feel vibration over each target. The cursor was, however, displayed visually, and responded with appropriate movements when the device was tilted. TABLE I AUDIO SOURCES USED IN THE EXPERIMENTS Target Index
Music Type
1
Hip hop
2 3 4 5 6 7
Celtic
Arabic Country Jazz Traditional farsi Opera
PROCEEDINGS OF THE INT. WORKSHOP ON INTERACTIVE SONIFICATION, BIELEFELD, JAN. 2004 IV. METRICS AND VISUALISATION Matlab was used for visualizing the logged experimental data. We use a number of techniques for investigating the users behaviour in these experiments. A. Exploration density plots Trajectories of cursor positions in the two-dimensional space have been shown, to give some indication of how users navigated when completing the task. Also a method for visualization of cursor trajectories used previously in Williamson & Murray-Smith (2003) have been introduced here, which plots a density around the trajectory, which is a function of the position and the length of time spent in that position. An example is given below.
Fig. 1. PocketPC, Accelerometer and experiment I running on the system (with target sound sources displayed, for illustrative purposes).
Fig. 3. A density contour plot and cursor trajectory density indicating the exploration of the space by 4th participant in the no Doppler, no vibration condition. This plot is created by placing a Gaussian distribution centred on the (x,y) position of the cursor for each point in the log file, with standard deviation proportional to that used in the audio sources. The Gaussians are summed for each pixel, and the resulting image gives an impression of the areas of the input space which were explored, and how long the user spent in them. The image can be summarized numerically by counting the percentage of pixels greater than a selected threshold e . In this paper e =5.0. The image size is 240 by 320 pixels.
Fig. 2. A user interacting with the system. Before the main experiments the participants were shown a demo of the system and the space they should explore, in order to reduce the chance of any terminological misunderstanding.
PROCEEDINGS OF THE INT. WORKSHOP ON INTERACTIVE SONIFICATION, BIELEFELD, JAN. 2004
Fig.5. Hidden target positions (circles), and points selected by user 4 in no Doppler, no vibration condition as best guess (crosses)
Fig.4. A cursor trace of participant 4 in no Doppler, no vibration condition is plotted over the density of the local audio amplitude of the different tracks B. Audio density plots These plots show the audio density at different points in the space. This is a sum of the local amplitude of the mixture components associated with the different audio tracks. Our expectation was that with an effective feedback method, the exploration density plots should in general have a similar shape to the audio density plots. C. Distance to target Whenever the user believes he/she is as close as possible to the target, they press a key, selecting the target. For each selection made by the user the distance to the nearest target is calculated as below and recorded. An example plot is shown in figure 5.
Dist = ( xsource - xselected ) 2 + ( ysource - yselected ) 2
(1)
The distance to the location of the target gives some insight into the acuity with which the location can be perceived with the given display. D. Time to target The time taken to select all points, and whether users selected a point multiple times are recorded.
V. RESULTS The average time each participant spent in the experiments was 22.35 minutes. A. Proportion of distance to the target It is important to know in which experimental condition participants could select targets more accurately. After recording the position of clicks on the screen, the distance to the main audio sources is measured. The results show that the mean distance from the selected position to the target in no Doppler-No vibration is less than other experiments (Fig.6). B. Chosen songs The accuracy relative to the number of song chosen is another factor in improving audio interfaces. Because the type of songs may affect Doppler effect and make it easy or difficult to choose them. We could measure the number of audio sources participants have selected with more accuracy. The mean of these sources have been summarized in Table II. Figure 7 shows the mean accuracy count of songs in all conditions for all participants. This result is based on the number of times each source was selected with the smallest distance to the target in each condition. There is a large amount of variability in the results. Jazz music was the most popular one in average. But Hiphop music was the most popular one in no Doppler, no vibration condition. TABLE II ACCURACY SCORE FOR AUDIO SOURCES INTHE EXPERIMENT
PROCEEDINGS OF THE INT. WORKSHOP ON INTERACTIVE SONIFICATION, BIELEFELD, JAN. 2004 TABLE III AVERAGE OF EXTRA CLICKS FOR EACH USER IN THE EXPERIMENT
TABLE IV TIMING TABLE FOR 12 USERS (TIME UNIT IS SECOND)
and Arabic sources had high mean and maximum errors in the Doppler case.
Fig.6. Mean distance from target in different tasks
C. Extra clicks Table III shows the mean number of extra clicks by each user that has made him/her click in wrong position. Dopplervibration has the highest average of extra clicks and Doppler no Vibration has the lowest average. D. Time to target Table IV shows which of these experiments has been the fastest one in finding and selecting targets. No Doppler, No vibration with 187 seconds was the fastest and Doppler with no vibration was the slowest one with 490 seconds. E. Covered space Another factor which shows whether the audio environment and vibrotactile feedback have been clear and less confusing for participant or not is, participants’ movements how much has covered the space. In a clear and easy to navigate environment with appropriate feedback, this should be similar to the density of targets, and linked to the smoothing used. Doppler with no vibration has the least covered space with 34.5% and the rest have similar percentage of coverage, 37.6%.
Fig.7. Count of most accurately chosen songs in different conditions for all users
Fig.8. Mean distance of selected songs in all conditions for all users Figure 8 shows mean error for songs in all conditions. In general no Doppler, no vibration has the lowest error among others and Doppler, no vibration has the highest error. Farsi
VI. DISCUSSION Post hoc examination of the cursor’s trace show navigation traces for most of the users are from left to right or vice versa (Fig.9), although some users (e.g. Fig 10) do not fit this pattern. Because audio panning with stereo headphones is effective in horizontal (left-right) movements not vertical (forward-backward) ones. This also means that the spatial cues provided by the Doppler effect have more impact in the leftright plane, where both spatial and phase shifts are perceived, than in the forward-backward, where only phase shift is perceived. In nearly all the experiments with vibration feedback users have circular movements around vibration source (Fig.10). This shows vibration has been more important for the users to find a target and whenever they have felt they are close to the song they have looked for the vibration source before clicking. This might, however, also explain that errors are not smaller, as the user may often select the location as soon as vibration is perceived, at the edge of the circle, rather than at the target itself The extra clicks and activities in the cursor trajectories for Doppler might be an effect of the extra sensitivity of the feedback to movement, which makes users explore by varying their velocity vector. This might also be a training artifact, as
PROCEEDINGS OF THE INT. WORKSHOP ON INTERACTIVE SONIFICATION, BIELEFELD, JAN. 2004 users suddenly realize the system has changed, and explore it. Variability in localization accuracy is greater with the Doppler effect for the Farsi and Arabic sources, suggesting that for the mainly western European participants, their poorer familiarity with these sources made the distortions introduced by the Doppler effect more difficult to perceive. Opera also had larger errors, again suggesting that less familiarity with the target sources can affect the usefulness of this approach.
Fig.9. The traces of the cursor for participant 12 in no Doppler with vibration experiment (upper) and its exploration density plot (lower)
The large number of falsely placed points for the Doppler method might be because of the amplification involved in moving towards something, which makes people feel they are getting a stronger response, and they over interpret the quickened signal, believing they are already at the point – a commonly cited risk associated with quickened displays.
Fig.10. The traces of the cursor for participant 6 in Doppler with vibration experiment (upper) and exploration density plot of this experiment (lower).
PROCEEDINGS OF THE INT. WORKSHOP ON INTERACTIVE SONIFICATION, BIELEFELD, JAN. 2004
VII. CONCLUSION This paper presents initial experimental results exploring the use of quickened audio displays for localization and selection based on tilt control of mobile devices. The experiments provided useful exploratory information about how users navigate in such environments, and highlighted some benefits and disadvantages of each of the display options investigated. Doppler effects affect perceived errors in horizontal and vertical dimensions differently, and their effectiveness is related to the user’s familiarity with the target audio source. Vibration was clearly perceived by users, but led to them spending more time circling around targets. Average results on the metrics used do not suggest that the use of Doppler or vibration brought consistently improved performance, but some people did very well with Doppler and most found the vibration feedback useful. More focused experiments are now needed to investigate users’ responses to individual features of the quickened displays used, with fewer confounding factors, such as choice of music from different cultures, and with more time for allowing users to learn how to use a particular novel type of interface. More consideration should also be given to the development of appropriate models and metrics for quantifying and visually summarising user navigation and selection behaviour. ACKNOWLEDGMENT The authors gratefully acknowledge the support of the BRG IRCSET project, Continuous Gestural Interaction with Mobile devices, Science Foundation Ireland grant 00/PI.1/C067, the Multi-Agent Control Research Training Network - EC TMR grant HPRN-CT-1999-00107, and EPSRC grant Audioclouds: three-dimensional auditory and gestural interfaces for mobile and wearable computers GR/R98105/01. REFERENCES [1]
[2] [3] [4] [5] [6] [7]
[8] [9] [10]
C. Johnson, S.A. Brewster, G. Leplatre, and M.G. Crease, “Using NonSpeech Sounds in Mobile Computing Devices.”, Proceedings of the First Workshop on Human Computer Interaction with Mobile Devices, (Glasgow, UK), Department of Computing Science, University of Glasgow, pp 26-29, 1998. S.A. Brewster, “Overcoming the Lack of Screen Space on Mobile Computers”, Department of Computing Science Technical Report TR2001-87, Glasgow University, April 2001 Stephen Brewster, Robin Murray, “Presenting Dynamic information on Mobile Computers”, Personal Technologies, 4(2), pp 209-212, 2000. W. Gaver, R. Smith, T. O’Shea, “Effective sounds in complex systems:The ARKola simulation” In Proceedings of ACM CHI’91 (New Orleans) ACM press, Addison-Wesley, pp.471-498, 1991. M. Blattner, A. Papp, E. Glinert, “Sonic enhancements of two dimensional graphic displays”, In proceedings of ICAD’92 (Santa Fe) Addison-Wesley, pp447-470, 1992. Stephen Brewster, “Using non-speech sound to overcome information overload”, Displays 17, 179-189, 1997. Kramer, G., Walker, B., Bonebright, T. Cook, P., Flowers, J., Miner, N., Neuhoff, J., et al. “Sonification report: Status of the field and research agenda”. Report prepared for the National Science Foundation by members of the International Community for Auditory Display, 1999. T. Hermann, M.H. Hansen, H. Ritter, “Principal curve sonification”, In Proceedings of ICAD 2000 T.. Hermann, H. Ritter, “Listen to your data: Model-based sonification for data analysis”, ISIMADE '99, Baden-Baden, Germany, Aug. 1999. M. de Berg, M. van. Kreveld, M. Overmars, O. Schwartzkopf, “Computational Geometry”, Second edition, Springer-Verlag, 1999.
[11] R. J. Jagacinski, J. M. Flach, Control Theory for Humans: Quantitative approaches to modeling performance, Lawrence Erlbaum, 2003. [12] J. Williamson, R. Murray-Smith, “Dynamics and Probabilistic Text Entry”, Technical report, Dept. Computing Science, University of Glasgow, TR-2003-147, June, 2003. [13] H. P. Birmingham, and F. V. Taylor, “A design philosophy for manmachine control systems”, Proceedings of the Institute of Radio Engineers, 42, pp1748-1758, 1954.
Parisa Eslambolchilar received the B.S. degree in computer engineering from University of Amirkabir (Tehran Polytechnic) in 1998 and M.S. degree in electrical engineering from University of Tehran in 2001. She is a research assistant and Ph.D student at the Hamilton Institute, National University of Ireland in Computer Science.
Andrew Crossan graduated with a BSc Hons at the department of Computing Science at Glasgow University in 1999. He then completed his PhD at the same department before moving to the Hamilton Institute in 2003.
Roderick Murray-Smith received degrees (BEng 90, Ph.D. ’94) from the University of Strathclyde, UK. He worked at Daimler-Benz research labs in Berlin from 1990-97, was a visiting researcher in the Dept. of Brain & Cognitive Sciences at M.I.T. in 1994, a research fellow in the Dept. of Mathematical Modelling at the Technical Unviersity of Denmark from 199799, and since 1999 has been at Glasgow University in the Department of Computing Science. In 2001 he took up a joint position with the Hamilton Institute, NUI Maynooth, Ireland.