Elsevier Editorial System(tm) for Separation and Purification Technology Manuscript Draft Manuscript Number: Title: Modeling and optimizing copper extraction using response surface methodology: considering the leaching time effect Article Type: Regular Paper Keywords: Modeling and optimization; Bacterial Leaching; Response Surface Methodology; The time factor effect; Copper Extraction. Corresponding Author: Dr. Mahdi Yaghobi Moghaddam, Corresponding Author's Institution: First Author: Mahdi Yaghobi Moghaddam, PhD student Order of Authors: Mahdi Yaghobi Moghaddam, PhD student; Mohammad Ranjbar, Professor; Mahin schaffie, Associate professor; Zahra Manafi, M.S.; Mohammad Jahani, PhD student
Cover Letter
University of Tehran University College of Engineering School of Mining Engineering
To: The editor of the Journal of “Separation and Purification Technology”:
Prof. G. Chen, Deptartment of Chemical and Biomolecular Engineering, Hong Kong University of Science & Technology, Clear Water Bay Kowloon, Hong Kong. Fax: +852 2358 0054 From: Email:
[email protected]
7/27/2012
School of Mining Engineering, University college of Engineering, University of Tehran, Tehran, Iran.
Dr. M. Yaghobi Moghaddam Tel: +9833810081; +989127277347 P.O. BOX: 14395-515 Email:
[email protected]
Dear Prof. G. Chen, Please find enclosed a paper entitled: “Modeling and optimizing copper extraction using response surface methodology: considering the leaching time effect” by M. Yaghobi Moghaddam, M. Ranjbar,
Z. Manafi, M. Schaffie, and M. Jahani
for consideration in the Journal of “Separation and Purification Technology”. This paper is the net result of three years of teamwork at Sarcheshmeh Copper Complex (located in Kerman, Iran) and is an original and unpublished paper and is not being considered for publication elsewhere. We would be delighted to provide any further information regarding the paper. Thank you for your kind consideration.
Yours faithfully M. Yaghobi Moghaddam
*Research Highlights
The optimum level of physicochemical parameters was obtained. RSM was useful to improve processing of copper extraction from a low-grade ore.
The leaching time effect on all parameters was examined.
The optimum conditions to achieve the maximum total copper extraction were found. In the optimum conditions model prediction of total copper extraction was obtained.
*Manuscript Click here to view linked References
Modeling and optimizing copper extraction using response surface methodology: considering the leaching time effect M. Yaghobi Moghaddama,b,, M. Ranjbarb, M. Schaffiec, Z. Manafid, M. Jahania a
School of Mining Engineering, University college of Engineering, University of Tehran, P.O. Box 14395-515, Tehran, Iran. b c d
Department of Mining Engineering, Shahid Bahonar University of Kerman, Kerman, Iran.
Department of Chemical Engineering, Shahid Bahonar University of Kerman, Kerman, Iran.
Hydrometallurgy Research Unit, R & D Center, Sarcheshmeh Copper mine Complex, Kerman, Iran.
Abstract In this research, using response surface methodology (RSM) and considering the leaching time effect, the copper extraction process in shaking bioreactors was modeled and optimized. To this end, important parameters in the mesophilic bacterial leaching process of a low-grade copper ore were studied. The examined parameters were pH, pulp density, and initial concentration of ferrous ions. Also, the effect of leaching time on the dependent parameter (copper extraction) and independent parameters (pH, pulp density, and initial Fe(II) concentration) at the 1st, 4th, 9th, 14th, and 22nd days was examined. Also, the central composite design (CCD) methodology was chosen as the design matrix to predict optimum level of these parameters. Then, the model equation at the 22nd was optimized using the quadratic programming (QP) method to maximize total copper extraction within the studied experimental range. In the optimum conditions, amount of total copper extraction predicted by the model was 85.98%, significantly close to that obtained from conducted experiments (84.57%). This study indicated that RSM could be useful to increase copper extraction from a low-grade ore. Also, a couple of statistically significant interactions were found between pH and pulp density as well as pH and initial Fe(II) concentration, which means that the optimum values of these three parameters can simply be correctly obtained through using design of experiments. However, there was no statistically significant interaction between initial Fe(II) concentration and the pulp density. Additionally, the response at optimum levels of pH and pulp density was found to not depend on the level of initial Fe(II) concentration. This means that when employing shaking bioreactors to optimize copper extraction, the levels of pulp density and pH should be carefully chosen.
Corresponding author. Tel/Fax: +98 9133562652/+98 2188631202 E-mail address:
[email protected];
[email protected] – M. Yaghobi Moghaddam.
1
Keywords: Modeling and optimization; Bacterial Leaching; Response Surface Methodology; The time factor effect; Copper Extraction.
1. Introduction Leaching process and especially bacterial leaching process of metal sulfides has been impressively developed during the recent decades [1, 2 – 4]. Recently, bacterial leaching of primary sulfide minerals of copper and potential application of bacterial leaching in Iran's copper industry as well as the application of mesophilic and thermophilic bacteria in increasing the extraction of copper have been studied [5 – 7]. Sarcheshmeh Copper Complex is one of the largest copper mines in the world, located in Kerman province, Iran. Every year, about 20 million tons of copper ore, containing 0.8%-grade copper, are extracted from this open-pit mine. After mineral processing and concentration stages and using pyrometallurgical methods this ore is turned into cathode copper with 99.999% grade. Simultaneously, every year the mine produces about one million tons of low-grade copper ore, a mixture of sulfide and oxide containing 0.3%-grade copper, which it is not a suitable feed for pyrometallurgical methods and, therefore, should be treated using hydrometallurgical methods [2,3] . About 5 million tons of the latter resources, retained in dumps, were used for heap 3, located in the southwest of the Sarcheshmeh Copper Complex [8]. In this site, finding a new environmentally-friendly processing technology for the retained low-grade copper ore is of significant importance [8]. Identifying the correct optimum values of the effective parameters in biotechnological processes is a prerequisite for their successful commercial exploitation. This is specifically true when these processes have to compete with alternative chemistry- or physics- based processes. An example of such a process is the bacterial leaching of a low-grade copper ore. Alternative hydrometallurgical or pyrometallurgical technologies for copper extraction from sulfide- and oxide- low-grade copper ore sources are currently available and operating at commercial scale. Nonetheless, processes based on these technologies consume a large quantity of energy and also cause environmental problems [8 – 11]. On the other hand, bacterial leaching consumes less energy and is an environmentally friendly process [2 – 4, 8 – 10, 12]. However, it can be commercially applied for extraction of copper from a low-grade ore if it also proves to be economic [8]. A lot of physicochemical parameters identified in previous researches by the literature survey on studies as impressively influencing the rate of copper extraction for bacterial leaching, employing mesophilic bactria from sulfide- and oxide- low-grade copper ore sources, have been studied such as pH, temperature, ratio of ferric to ferrous ions, pulp density bacterial ratio inoculation, and initial ferrous iron concentration [2,3, 5 – 8]. The correct choosing of the value of these parameters is necessary if a low-grade bacterial
2
leaching process is to be developed. There are plenty of literatures on bacterial leaching of copper from sulfide and oxide sources but an answer to the question of what is the optimum level of these parameters cannot be credibly found by referring to these studies. The wide range of values used or reported as optimum for the physicochemical parameters can to some extent be explained by the different species of Acidithiobacillus ferrooxidans, Acidithiobacillus thiooxidans, and Leptospirilum ferrooxidans, and to a small extent by the type of copper sulfide and oxide sources, employed in these studies. Yet, the wide range of values cannot be fully explained by these factors and, moreover, the optimum level of these parameters could also be influenced by the level of the other important parameters in the sulfide- and oxide- low-grade bacterial leaching process. In statistical parlance, there could be an interaction between effective parameters in such a process. Examining the previous literatures on sulfide- and oxide- low-grade bacterial leaching provides no clues as with whether such interaction between the important process parameters in a sulfide- and oxide- low-grade bacterial leaching process exists or not. This is because in previous studies one-factor-at-a-time methodology has been used to optimize the physicochemical parameters [2,3, 13 – 15]. This methodology is so inefficient and besides gives absolutely no information about interactions between parameters in a process. The only methodology able to provide an answer to this question is factorial design of experiments (DOE), which – through the use of techniques such as Response Surface Methodology (RSM) – is capable of simultaneously considering several factors at different levels, and give an appropriate model for the relationship between the various factors and the response [16]. Still, RSM has been applied in only a few cases to a bacterial leaching process [17 – 19]. Also, reliable information about first order interactions can only be obtained from the results of DOEs [16]. However, higher order interactions between parameters are usually statistically insignificant and therefore information about them is not pretty useful [16]. Generally speaking, changing one parameter and keeping the other ones at a constant level has a huge disadvantage as it does not include the interaction effects among the variables and as a result, it does not show the complete effects of different parameters on the response of the process [20,21]. To overcome this problem, modeling and optimization studies are done by using the response surface methodology (RSM). Besides, in other literature associated with this subject, theories and essential aspects of RSM have been explained [16,22]. To determine several parameters and their interaction, RSM is used because it decreases the number of experimental trials. As a result, it takes less effort and time than other applications do. It is remarkable that, in recent years, RSM has been applied for modeling and optimizing in mineral processing researches [21, 23 – 27].
3
Another important point concerning optimizing parameters in a bacterial technological process such as sulfide- and oxide- low-grade bacterial leaching is the correct choice of the cultivation method. Physicochemical parameters such as initial pH, pulp density and initial ferrous iron concentration are best optimized using shaking bioreactors – also called shake flask cultivation. The aim of the present work using biochemical tests was to identify and quantify between important physicochemical parameters – i.e. pH, pulp density and initial ferrous iron concentration – as well as interactions between them in a sulfide- and oxide- low-grade bacterial leaching process by mesophilic microorganisms using appropriate methodology such as RSM. On the other hand, this study involves modeling and optimizing the process parameters affecting the total copper extraction for a sulfide- and oxide- low-grade bacterial leaching process. Also, CCD methodology was chosen as the design matrix since it allows reliable identifying first order interaction between factors and provides a second order polynomial model which can be used to predict optimum level of these parameters [16]. After modeling and optimization of the process parameters, in this research, for the first time, the effect of leaching time on independent parameters (pH, pulp density, and initial concentration of ferric ions) as well as on the dependent parameter (copper extraction or response) at the 1st, 4th, 9th, 14th, and 22nd days was examined. In other words, the effect of changing independent parameters on the response during conducting the reactions at the 1st, 4th, 9th, and 22nd days was examined.
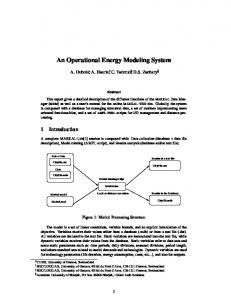
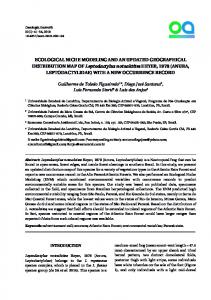
2. Materials and Methods 2.1. Low-grade copper ore In this study, a low-grade copper ore was taken from Sarcheshmeh Copper Mine with 0.31% copper content. About 3500 kg of the ore was subjected to screening to obtain the following fractions: +50.8, –50.8 +25.4, –25.4 +12.7, –12.7 +6.2, –6.2 +2, and –2 mm. The particle size distributions of the original and ground ores with d80 of −30000 and −85 micron are shown in Figs. 1 and 2, respectively. A composite of the whole ore including different size fractions were pulverized for chemical and mineralogical assays. The chemical composition of this copper ore was 0.31% Cu, 6.10% Fe, and 1.72% S. X-ray diffraction analysis of the ore showed the presence of quartz and silicates as the main components and chalcopyrite as a minor phase. 2.2. Microorganisms A mixed culture of mesophilic bacteria, including Acidithiobacillus ferrooxidans, Acidithiobacillus thiooxidans and Leptospirilum ferrooxidans, previously isolated from the Sarcheshmeh Copper Mine complex, was used in the experiments [28]. As the purpose was to
4
use both microorganisms (iron and sulfur oxidizers) in mixed cultures, the above microorganisms were cultivated in 9K medium containing ferrous sulfate and sulfur powder [29]. Consequently, the effect of both iron- sulfur- oxidizing microorganisms on leaching kinetics and extraction can be investigated. Also, the bacterial cultures were adapted to elemental sulfur. Cultures were incubated at 32 °C in a temperature-controlled orbital shaker (Innova 4200 model, New Brunswick scientific company, USA) at 150 rpm and the medium was examined by pH meter (model MP120, Mettler Toledo Company, Switzerland). Also, the bacterial growth was monitored by measuring oxidation reduction potential (ORP) using a pH/Eh meter (826pH mobile model, Metrohm Company, Switzerland) to observe the oxidation ability of ferrous iron and sulfur.
2.3. Design of experiments 2.3.1. Response surface methodology (RSM) RSM is a collection of statistical and mathematical methods appropriate for modeling and analyzing engineering problems. In this technique, the principle goal is optimizing the response surface influenced by diverse process parameters. On the other hand, RSM determines the relationship between the controllable input parameters and the obtained response surfaces [30 – 33]. The design procedure for RSM is as follows [34]: (i) Design of a series of experiments for sufficient and reliable measurement of the desirable response. (ii) Developing a mathematical model with a second order response surface and a maximum fitting. (iii) Finding the most desirable set of experimental parameters which produce a maximum or minimum valye of response. (iv) Expressing the direct and interactive effects of process parameters via two- and threedimensional plots. If all variables are supposed to be measurable, the response surface can be expressed as follows:
y f ( x1 , x2 , x3 , ..., xk )
(1)
where y is the response of the system, and xi is the variables of action called factors. The objective is optimizing the response variable (y). It is supposed that the independent variables are continuous and controllable by experiments with insignificant errors. Also, finding a right approximation for the true functional relationship between independent variables and the response surface is necessary [34].
5
2.3.2. Central composite design (CCD) The experimental design methods commonly used for process modeling and analysis are the full factorial, partial factorial and central composite designs [35,36]. At least, three levels per variable are required at a full factorial design to estimate the coefficients of quadratic terms in the response model. Therefore, concerning the three independent process variables mentioned in section 1, a number of experiments as well as replications should be conducted [37]. It is obvious that a partial factorial design requires fewer experiments than the full factorial. Nevertheless, the former is specifically useful if certain variables are already known to show no interaction [26,38]. An efficient alternative to the factorial design is the central composite design (CCD), originally developed by Box and Wilson and improved by Box and Hunter [37, 39, 40]. CCD gives nearly as much information as a three-level factorial and needs quite fewer tests than the full factorial. Also, it has been shown to be adequate to describe the majority of steady state process responses [41]. The number of tests required for CCD contains the standard 2k factorial with its origin at the center, 2k points fixed axially at the distance, for example β, from the center to generate the quadratic terms, and replicate tests at the center. At these tests, k is the number of variables. The axial points are chosen so that they make rotation possible [39], which guarantees that the variance of the model prediction is constant at all points equally distant from the design center. Replicates of the test at the center are of much importance as they provide an independent estimation of the experimental error. For three variables, six tests at the center are suggested. Consequently, the total number of tests necessary for the three independent variables is 23+ (2 × 3) +6=20 [26,39]. After defining the desired ranges of values of the variables, they are coded to lie at ±1 for the factorial points, 0 for the center points and ±β for the axial points. The codes are calculated as functions of the desirable range of each factor as shown in Table 1 [42]. When the response data are obtained from the test work, a regression analysis is performed to determine the coefficients of the response model (b1, b2, ..., bn), their standard errors, and their significance. In addition to constant (b0) and error (ε) terms, the response model incorporates [26]: • linear terms in each variable ( x1 , x2 , ..., xn ) ; • squared terms in each variable ( x12 , x 22 , ..., x n2 ) ; • first-order interaction terms for each paired combination ( x1 x 2 , x1 x3 , ..., x n i x n ) . Therefore, for the three variables under consideration, the response model is: 3
3
i 1
i 1
3
y b0 bi xi bii xi2
3
b x x
i 1 j i 1
6
ij
i
j
(2)
The b coefficients, which should be determined in the second-order model, are obtained by the least squares method. In general, Eq. (2) can be written in matrix form:
Y bX
(3)
where Y is a matrix of measured values and X is a matrix of independent variables. The matrices b and ε consist of coefficients and errors, respectively. The solution of Eq. (3) can be obtained by matrix approach [30,34].
b X X X Y 1
(4)
where X' is the transpose of the matrix X and (X'X)−1 is the inverse of matrix X'X. The coefficients, namely the main effect (bi) and two-factor interactions (bij) can be estimated from the experimental results by computer simulation programming applying a least squares method using Design Expert 7 Trial (State Ease, Inc., Minneapolis, MN, USA). To determine the significance of each term in equation as well as to estimate goodness or fit, the polynomial equation for the response was validated by the statistical test called ANOVA — analysis of variance. The response surface was drawn for the experimental results obtained from the effect of different variables on total copper extraction in order to determine the individual and cumulative effects of these variables, and their mutual interactions. 2.4. Experimental design Due to the given reasons in Section 2.3, CCD was chosen to design a series of experiments in order to provide data to determine the relationship between the response (i.e. total copper extraction) and the three process parameters, with the following ranges:
Initial pH: 0.96 – 2.64;
Pulp density: 1.59 – 18.41%w/v;
Initial concentration of ferrous ions: 0.00 – 6.27 g/L;
Using the relationships in Table 1, the coded and corresponding actual values were calculated as shown in Table 2. These were then used to determine the actual levels of the variables for each of the 20 experiments as given in Table 3. 2.5. Shake flask tests, sampling, measurements, and analysis All experiments (runs) of the central composite design were carried out in 500 ml Erlenmeyer flasks containing 200 mL solution. Experiments were conducted in a rotary shaker at 140 RPM at varying conditions. A mixture of sterilized medium together with an appropriate amount of sterilized energy source, a predetermined amount of bacterial inoculum and an appropriate quantity of low-grade ore, was added to the leaching vessel and maintained in the rotary shaker incubator. Finally, these tests were inoculated with 20 ml of the corresponding bacterial culture. In other words, all tests were reached to the 200-ml volume considering conditions of each test for example their pulp density. The pH of the media was monitored
7
and regulated at time. During the experiments, make-up distilled water was added periodically to the flasks to compensate for evaporation loss. Afterwards the pH of the solution was adjusted back to its initial value with 1 M sulfuric acid. Redox potential was recorded at day intervals, and 1 ml samples were removed from the liquid using a pipette to obtain kinetic information about metals dissolved. The metal concentrations, Cu and total Fe, in the samples were measured using Atomic Absorption Spectroscopy (AAS). To keep the volume of the culture constant, an equal volume of 9K medium was added after taking each sample. The redox potential was measured using a Pt-combination redox electrode with an Ag/AgCl reference electrode. Then, pH was monitored using a gel-filled combination pH probe with an Ag/AgCl reference electrode. Additionally, the initial bacterial concentration in all the experiments was approximately 108 cells/mL. Bacterial population was determined using a counting chamber and an optical microscope (Carl Zeiss model, Axioskop 40, USA). At the end of experiments, the solids were filtered and a chemical analysis of the residues was accomplished to complete the mass balance for calculation of final copper and iron extractions. All experiments were randomly run and carried out until there was stability in the copper extraction (Table 3). 2.6. Examination of the leaching time effect on independent parameters and the dependent parameter The time parameter is one of the important and impressive factors in most natural phenomena. Since time duration of conducting reactions at bacterial leaching processes is effective in amount of copper extraction, considering the time factor and analyzing the process response towards time represents different effects of the independent parameters at the response of experimental design at RSM. In this section, the effect of leaching time on the dependent parameter (copper extraction) and independent parameters (pH, pulp density, and initial Fe(II) concentration) at the 1st, 4th, 9th, 14th, and 22nd days are studying. In other words, the effect of stopping leaching process on the 20 mentioned tests in Table 3 at the 1st, 4th, 9th, 14th, and 22nd days is examined. Thus, the purpose of the section is the process analysis of independent parameter changes on the response during conducting the reactions. To examine the effect of time on the copper extraction, there are two approaches: i.
Considering the time factor as x4, which turns the run numbers from 20 into 30 and independently plotting the graph of copper extraction versus time for the tests (Fig. 3a).
ii. Substituting results of all runs at RSM and analyzing them after elapsing of a given time. It is remarkable that in this article the second approach is used to show the changes of independent parameters and effects of them on type of response (Fig 3b). 3. Results and discussion
8
3.1. Statistical analysis In Design Expert software, the response data were analyzed by default. In the next step, the 2
effects for all model terms were calculated, and statistics such as F-values, lack of fit, and R values were used, and consequently, a quadratic model was selected. The model terms in the equation are calculated after elimination of some insignificant variables and their interactions, which have the lowest F-value. The ANOVA results for the response at the 1st, 4th, 9th, 14th, and 22nd days have been summarized in Table 4. The model accuracy was tested via lack-offit F-test. Lack of Fit compares the residual error to the pure error. Lack of fit is not desirable, so a small F value and probability greater than 0.1 are desired. If a model shows lack of fit, it cannot be used to predict the response [43]. As indicated in Table 4 at the 22nd day, the lackof-fit of the model (0.633) has a probability more than 0.1, and the model is highly significant with very low probability value ( F‖ less than 0.05 indicate model terms are significant while values greater than 0.10 indicate the model terms are insignificant. 3.2. Significant factors Observed and predicted values of total copper extraction at the 1st, 4th, 9th, 14th, and 22nd days are summarized in Table 6. Considering the effects of the main factors and also the interactions between two-factor, Eq. (2) takes the form:
Y b 0 b1x 1 b 2 x 2 b 3 x 3 b11x 12 b 22 x 22 b 33 x 32 b12 x 1x 2 b13 x 1x 3 b 23 x 2 x 3
(5)
The coefficients, i.e. the main effect (bi) and two-factor interactions (bij) were estimated from the experimental data shown in Table 6 using Design Expert software. From the experimental design in Table 3, experimental results in Table 6, and Eq. (4), the second-order response function representing total copper extraction (Y) can be expressed as a function of the three coded process parameters, i.e. initial pH (x1), pulp density (x2), and initial concentration of ferrous ions (x3). The relationship between the response (total copper extraction) and process parameters by mesophilic bacteria in the presence of low grade ore
9
sample at the 22nd day was obtained using coded and actual variables, presented in Eq. (6), and Eq. (7), respectively.
Ythe 22 nd day 79.10 2.79 x1 3.08 x2 0.86 x3 1.46 x1 x2 1.00 x1 x3 1.70 x12 Ythe 22 nd day 58.15 28.12 pH 0.43 pulpdensity 1.48 Fe 2 2
0.58 pH pulpdensity 1.08 pH Fe 6.81 p H initial
initial
2
(6)
(7)
The response factor in the interval of this experiment design can be calculated from Eq. (6). The negative signs in variables of the prediction model equation indicate that in order to maximize extraction of the low-grade copper ore by bioleaching, these factors must be kept in low levels. Also, with substituting the results of the 1st, 4th, 9th, 14th, and 22nd days in table 6 and in the DX7 software Eqs. (8–12) were obtained, their initial formula without experimentation of significance of each parameter is as follows:
Ythe1st day 46.25 2.21x1 0.91x2 0.50x3 0.87 x1 x2 1.28 x1 x3 0.61 x2 x3
(8)
Ythe 4th day 52.61 1.29x1 0.78x2 0.05x3 0.46x1 x2 1.72x1 x3 1.05 x2 x3
(9)
Ythe 9th day 59.50 0.43x1 0.45 x2 0.97 x3 0.78 x1 x2 0.39 x1 x3 0.36 x2 x3
(10)
Ythe14 th day 77.82 2.67 x1 2.95 x2 0.91x3 2.43 x1 x2 0.71x1 x3 0.44 x2 x3 2.13 x12 1.02 x22 0.61x32
Ythe 22 nd day 79.17 2.79 x1 3.08 x2 0.86 x3 1.46 x1 x2 1.00 x1 x3 0.11x2 x3 1.70 x12 0.29 x22 0.39 x32
(11)
(12)
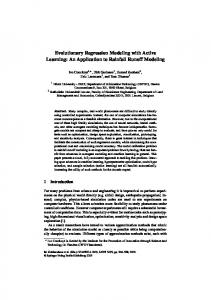
After sensitivity analysis and significance of independent parameters over the model, significance and insignificance of each parameter can be determined and the constants of Eq. (5) were obtained. With substituting these constants in Eq. (5) and considering R2, the copper extraction model at the 1st, 4th, 9th, 14th, and 22nd days versus time can be determined. Fig. 4 is internally studentized residual plots for Y (total copper extraction) at the 22nd day in the model (Eq. (6)). It shows that the distribution of the internally studentized residuals for the response approximately follows the fitted normal distribution and the internally studentized residuals of the response randomly scatter in the internally studentized residual plot. The 3D response surface plots in Fig. 5(a–d) which are simulations from Eq. (6) at the 22nd day describe the effect of the process variables on total copper extraction. Explanations for the trends are not given here as this was not the main focus of the study. Referring to Table 5, it can be concluded that at the 22nd day all the three main variables are of a clearly good significance while the interaction between pulp density and initial concentration of ferrous ions (BC) is insignificant. To improve the model adequacy, the 2
interaction between pulp density and initial concentration of ferrous ions (BC), B2, and C was 10
removed. Table 6 indicates that at the 22nd day the highest total copper extraction was 84.57% obtained in Run 8, with the initial pH, pulp density, and initial concentration of ferrous ions of 1.80, 1.59%, and 3.14 g/L, respectively. Also, the lowest total copper extraction was 67.68 % obtained in Run 14, with the initial pH, pulp density, and initial concentration of ferrous ions of 2.30, 15.00%, and 5.00 g/L, respectively. The three-dimensional and contour plots in Fig. 5 show the effects of initial pH and pulp density (Figs. 5a and c) as well as initial concentration of ferrous ions and initial pH on total copper extraction (Figs. 5b and d) at the 22nd day, while initial concentration of ferrous ions and pulp density is fixed at their central values, i.e., 3.14 g/l and 10.00%, respectively. In Figs. 5a and c, total copper extraction has a maximum value at the pH 1.60. After this point, at a constant value of pulp density, any decrease in the pH decreases the total copper extraction. Moreover, Figs. 5b and d indicate that the total copper extraction increases with decreasing pH up to 80.46%, but after that, total copper extraction decreases. Also, considering the initial pH, an increase in pulp density or initial concentration of ferrous ions, causes total copper extraction to decrease. The three parameters could have an important effect on the total copper extraction. As shown in table 6, the percentages of observed values of copper extraction during the bioleaching experiments have been greatly affected by the three parameters.
3.3. Influence of factors on total copper extraction The results of the series of shaken flasks tests reported in this paper support the idea that commercial bio-hydrometallurgical processes employing mesophilic bacteria for the treatment of the low grade copper ore can be useful. The effect of leaching time on the dependent parameter (copper extraction) and independent parameters (pH, pulp density, and initial Fe(II) concentration) at the 1st, 4th, 9th, 14th, and 22nd days (using RSM) is shown in Figs. 6, 7, and 8. It is clear that the leaching time affects the copper extraction leaching kinetics and changes the leaching rate.
3.3.1. The effect of initial pH The pH affects bioleaching in several ways. An appropriate pH enhances the desired reactions. Also, keeping pH in an appropriate amount is of specific importance for microorganisms normally too sensitive to this parameter. In Fig. 9 the pH of the leaching medium in a range of initial pH between 2.64 and 0.96 is studied. It could be seen that the pH in all levels of the experiments increases for a few days and then decreases after a while. This pH trend is attributed to two main reasons:
11
1- The pH increase is a reflection of the consumption of acid according to Eq. (13), and then, with production of acid through the microbial oxidation of elemental sulfur, according to Eq. (14), the pH decreases again. 2- Oxidation of ferrous ions to ferric ions consumes acid and the pH increases. Furthermore, pH is buffered by iron hydrolysis resulting in the formation of jarosite (Eq. (15), [48]). Bacteria 2 FeSO4 H 2 SO4 1 2 O2 Fe2 SO4 3 H 2O
(13)
Bacteria S 0 H 2O 3 2 O2 H 2 SO4
X 3 Fe
3
2 4
2 SO
(14)
6 H 2O XFe SO4 2 OH 6 6 H
(15)
where X+ could be (NH4)+, K+, Na+, Ag+, just to name a few. The procedure of changes of the pH factor over obtained results at the 1st, 4th, 9th, 14th, and 22nd days at RSM on the copper extraction is shown in Table 7. As illustrated in Fig. 6 and calculated in Table 7, with elapsing of leaching time at the first day, pH has a negative effect in the form of linear with a sharp sleep, in fact increase of pH from 1.3 to 2.3 has decreased amount of copper extraction down to 4.42%. At the froth day, pH has a negative effect in the form of linear with a slow sleep, not statistically significant, and in fact with increase of pH from 1.3 to 2.3, amount of copper extraction has decreased about 2.58%. At the 9th day, the effect of pH has changed from linear first order to nonlinear, not statistically significant, and in fact with increase of pH from 1.3 to 2.3, amount of copper extraction has increased about 0.87%. Finally, at the 14th and 22nd days, pH has nonlinearly changed and in fact with increase of pH from 1.3 to 2.3, amount of copper extraction has decreased about 5.34% and 5.59%, respectively. Results of this data is interpretable in this manner that at the beginning of conducting the experiments because of existence of initial acidicity in each experiment, amount of required acid for the leaching solution was available. Also, as part of the ore is oxide, it causes copper extraction, with decrease of pH in tests. With time elapsing, amount of solution acidicity decreases and pH is lost its significant effect on copper extraction. On the other hand, with time elapsing, bacteria were reached to the appropriate growth and count. Also, procedure of H+ production by bacterial activity was gradually accelerated and suitable solution activity through bacterial activity was provided and also the copper extraction procedure was continued (Fig. 6 and Table 7). The total copper extraction at the 22nd day is shown in Table 6 and the effect of initial pH on total copper extraction at this day is shown in Fig. 6e. The figure indicates that higher copper extraction is obtained at lower pH. According to this figure, the maximum amount of copper extraction is obtained at pH=1.3. On the other hand, the total copper extraction 12
increased from pH 2.3 to 1.3, which was probably due to the high bacterial iron oxidation observed at lower pH [49]. The Fig. 6e demonstrates that increase in the pH decreases the total copper extraction while increasing slope diagram. The acid production by bacteria proves the nonlinear nature of pH in a bacterial leaching process pH of the growth medium significantly affects the growth and activity of acidophilic microorganisms. Due to the high bacterial activity at lower pH, the concentration of acid (H +
+
+
ions) is also expected to be high (pH=−log10[H ]). It is assumed that the H ions induce copper dissolution. The iron oxidation rate decreased with the increase in initial pH. This resulted in a lower Fe(III) concentration in the leaching medium. As a result, the total copper extraction decreased as the Fe(III) concentration in the leaching medium decreased at higher pH. This probably is due to the decrease in Fe(III) concentration in the leaching medium as a result of iron precipitation. The iron precipitation rate increased as the pH increased [50]. The faster decrease in pH under higher initial pH can be attributed to the higher iron precipitation. To confirm the iron precipitation, the leaching residues were analyzed using XRD. The XRD data showed the presence of ammonium jarosite (NH4)Fe3(SO4)2(OH)6 in the leaching residue (data not shown). The ammonium ions presented in 9K media may have facilitated the formation of ammonium jarosite. The jarosite was found to be impervious, forming a thin layer on the solid particles [51]. This could be reported as a bioleaching process, which occurs via either intra particle diffusion or diffusion through a product layer formed during the course of dissolution. Also, the decrease in leaching rates at pH higher than 2.5 and above may have occurred due to inhibition of bacterial activity since bacteria have a higher affinity to be absorbed on the jarosite at higher pH [52]. The growth of bacteria at pH=0.96 was inhibited, while at pH=2.64 leaching is more inhibited, probably by some jarosite formation or the formation of layers of elemental sulfur on the mineral surface. Otherwise, Run 3 showed that the resistance of bacteria in the lower pH of 1 does not lose their activity and extraction of copper has been considerable (Table 6). The copper dissolution rate was remarkably affected at pH 2.64, with little influence in the range between 1.3 and 2.3 (Figs. 5c, d). 3.3.2. The effect of pulp density The bioleaching experiments in shaken flasks were carried out using various pulp densities. The range of pulp density was between 1.59 – 18.41%w/v. It is known that pulp density has a significant effect on leaching. The results of the present study confirmed that the ability of the mesophilic bacteria to oxidize low grade copper ore is dependent on the mineral pulp density. With the same approach as pH, the procedure of changes of the pulp density factor over obtained results at the 1st, 4th, 9th, 14th, and 22nd days at RSM on the copper extraction is
13
shown in Table 7. As illustrated in Fig. 7 and calculated in Table 7, with elapsing of leaching time at the first day, pulp density has a negative effect in the form of linear with a slow sleep, in fact increase of pulp density from 5 to 15 %w/v has decreased amount of copper extraction down to 1.82%. At the froth day, pulp density has a negative effect in the form of linear, not statistically significant and in fact with increase of pulp density from 5 to 15 %w/v, amount of copper extraction has decreased about 1.57%. At the 9th day, the effect of pulp density has changed from linear first order to nonlinear, not statistically significant and in fact with increase of pulp density from 5 to 15 %w/v, amount of copper extraction had increased about 0.89%. At the 14th day, the effect of pulp density has nonlinearly changed and in fact with increase of pulp density from 5 to 15 %w/v, amount of copper extraction has decreased about 5.89%. Finally, at the 22nd day, with elapsing leaching time, pulp density has linearly changed and in fact with increase of pulp density from 5 to 15 %w/v, the effect of copper extraction has decreased about 6.15% with a sharp sleep. The effect of pulp density on the total copper extraction at the 22nd day is shown in Fig. 7e. As illustrated, at lower pulp density, leaching rates and total copper extraction are considerable, but with increase of the pulp density the total copper extraction decreases. Hence, it is possible to obtain a higher level of copper extraction at pulp densities lower than 5%. A couple of main reasons for the inefficient bioleaching at high pulp densities can be explained: 1-The mechanical stress on the microorganisms that may be caused at high ore concentrations [53 – 55]. 2-The rate of oxygen supply from the gas phase is exceeded by the microbial demand, as is pointed out by the fact that the rates of leaching at 15.00% and 18.41% pulp density are approximately the same [53,54,56,57]. It is believed that high pulp density resulted in decreased copper extraction because it limits the air distribution and oxygen mass transfer. Redox potential evolution is shown in Fig.10. As illustrated, the redox potential is also highly dependent on the pulp density. At lower pulp densities (1.59% and 5.00%) most of the copper was extracted, but at higher pulp densities (15.00% and 18.41%) only about 74% of copper content (average of total copper extraction, ranged from 67.68% to 76.95%, at -1 level in Tables 3 and 6) was extracted after 22 days. The rate of leaching was constantly affected by metal ion toxicity and ferric ion concentration which gradually build up in leaching system. Metal toxicity affects both the rate and degree of iron oxidation by bacteria at high pulp density [58]. At 1.59 and 5.00% pulp density, the redox potential increased continuously from 396 to a final value of 716 and 721 mV, respectively. At 10.00% pulp density, during the active phase of bioleaching, the redox potential increased continuously between 398 – 655 mV as well, but with slower rate than two previous pulp densities. Applying mineral at pulp densities of 15.00 and 18.41% showed a relatively constant redox potential between 395 and 14
426. As shown in Fig.10, the redox potential at 1.59, 5.00, and 10.00%w/v pulp densities increased to 716, 721, and 655 mV in only 4, 9, and 11 days, respectively, whereas the redox potential values at 15.00 and 18.41%w/v pulp densities were still less than 430 mV even after 22 days of incubation. Obtained results for 1.59% w/v pulp density showed higher extraction of copper to bioleach the copper present in the low grade copper ore, compared to the tests carried out in the range of 5.00 – 18.41% (w/v) pulp densities. The shaken flask tests confirmed that more than 84% Cu extraction could be obtained on the low grade copper ore at a pulp density of 1.59% (Table 6). The results of bioleaching of low grade copper ore at pulp densities of 1.59 – 18.41% as a function of times are presented in Table 6. In this study, the maximum observed copper extraction at the 22nd day (84.57%) was obtained using mesophilic bacteria when the pulp density was 1.59% (Table 6). 3.3.3. The effect of initial concentration of ferrous ions Oxidation of Fe(II) is one of the energy sources for the growth and metabolism of the evaluated bacteria in bioleaching systems. Since bacterial growth is directly related to bioleaching, variation of the Fe(II) concentration in leaching medium is of specific importance to predict the leaching kinetics. The bacteria use Fe(II) as their nutrient and convert it to Fe(III) as a metabolites. As an oxidant, the Fe(III) reacts to sulfide matrix and thereafter, it is reduced to Fe(II). The oxidation-reduction cycle is continued in the entire leaching process. To evaluate the effect of Fe concentration on leaching kinetics, the initial Fe(II) concentration is varies from 0.00 to 6.27 g/L. The total copper extraction with different Fe(II) concentrations for all cultures are shown in Table 6. As a result, the total copper extraction decreased as the initial Fe(II) concentration increased. With the same approaches as pH and pulp density, the procedure of changes of the initial concentration of ferric ions factor over obtained results at the 1st, 4th, 9th, 14th, and 22nd days at RSM on the copper extraction is shown in Table 7. As illustrated in figure 8 and calculated in Table 7, with elapsing of leaching time at the first day, initial concentration of ferric ions has a positive effect in the form of linear, in fact increase of initial concentration of ferric ions from 1.27 to 5.00 g/l has increased amount of copper extraction up to 1.01%. At the froth day, initial concentration of ferric ions does not have any considerable effect, in fact with increase of initial concentration of ferric ions from 1.27 to 5.00 g/l, amount of copper extraction has decreased only about 0.13%. At the 9th day, the effect of initial concentration of ferric ions has changed in the form of nonlinear, not statistically significant and in fact with increase of initial concentration of ferric ions from 1.27 to 5.00 g/l, amount of copper extraction has decreased about 1.94%. Finally, at the 14th and 22nd days, initial concentration of ferric ions
15
has linearly changed, in fact with increase of initial concentration of ferric ions from 1.27 to 5.00 g/l, amount of copper extraction has decreased about 1.83% and 1.71%, respectively. Results of these experiments is interpretable in this manner that at the first day because of abundance of free Fe2+ in the solution and according to Le Chatelier's principle, some of this ion is turned into Fe3+. This ferric ion attacks to the ore structure as an oxidant agent and causes copper extraction increase (Fig. 8a). On the other hand, with time elapsing and breaking pyritic ore structure, amount of Fe2+ in the environment highly increases. Also, with increasing procedure of bacteria, ferric ion increases in the environment as well. On the other hand, sum of ferrous and ferric ions in the solution increases, which causes producing iron precipitations (data not shown) and decreasing copper extraction (Fig. 8 b-e). The effect of initial concentration of ferrous ions on total copper extraction at the 22nd day is shown in Fig. 8e. As illustrated, higher extraction of total copper is obtained at low initial concentration of ferrous ions i.e. 1.27 g/L. Also, high Fe(II) concentrations may negatively affect bacterial activity. It was observed that the leaching rate and total copper extraction decrease with the increase of initial Fe(II) concentration and it has a negative effect. The negative effect of increase of initial Fe(II) concentration may be due to enhanced iron precipitation rate (results not shown). The precipitated iron has been founded to be ammonium jarosite ((NH4)Fe3(SO4)2(OH)6) which form an impermeable product layer over the reactant [59]. Ammonium jarosite impedes the leaching process which involves either diffusion inside the reactive matrix or through product layer formed during the course of dissolution. In addition, jarosite controls the solubility of Fe(III) – the main oxidant of the bioleaching process [60,61]. Therefore, the rate of metal dissolution decreases with the increase of jarosite at higher Fe(II) concentration. In addition, the pH of the leaching media decreased as the levels of Fe(II) increased due to production of large amounts of acid during the leaching process (data not shown). This amount of acid could only be compensated by hydrolysis of Fe(III) produced during bacterial iron oxidation 45].
3.4. Optimization of process parameters Initially, the optimization of the levels of the three factors for achieving maximum copper extraction after 22 days for shake flask cultivation of Acidithiobacillus ferrooxidans, Acidithiobacillus thiooxidans and Leptospirilum ferrooxidans, in the presence of sulfide and oxide low-grade ore, was carried out using the proposed second order polynomial model (Eq. (7)). One of the main goals of this study is to find optimum process parameters to maximize the total copper extraction derived from the mathematical model equation developed in this study (Fig. 5). The quadratic model equation is optimized using quadratic 16
programming (QP) to maximize total copper extraction within the studied experimental range. This exercise predicted that the maximum copper extraction after 22 days of bacterial leaching of sulfide and oxide low-grade ore is 85.98% under the following conditions: pH of 2.00, PD of 1.59%, and initial concentration of ferrous ions of 0.00 g/L , Whereas the maximum total copper extraction was 84.57% in the experiments conducted and shown in Table 6, i.e. a 1.41% upgrading in total copper extraction could be obtained using bacterial leaching conditions identified by the quadratic programming. To confirm this prediction, and therefore the applicability of the proposed second order model for further optimization exercises, confirmation runs (i.e. runs at the predicted optimum level of the factors) were carried out. Since the predicted value by the model is appropriate, this can be taken as the confirmation of the suitability of the regression model for predictive purposes [16]. As the second order polynomial equation indicated that the three factors did not have the same effect on the response.
4. Conclusions In this study, response surface methodology (RSM), central composite design (CCD), and quadratic programming (QP) were used to study the interaction between factors in a lowgrade copper bacterial leaching process using mesophilic bactria, Acidithiobacillus ferrooxidans, Acidithiobacillus thiooxidans and Leptospirilum ferrooxidans as well as to model and optimize the influence of three process parameters on bacterial leaching of a lowgrade copper ore. Using a set of experimental data and a mathematical software package (Design Expert), a mathematical model equation was derived for total copper extraction. To describe the effect of the process variables on total copper extraction, 3D response surface plots, which are simulations from the model, were presented. Predicted values obtained, using the model equation, were in a pretty good agreement with the observed values (R2 value of 0.95 for total copper extraction). Taking advantage of quadratic programming, a initial pH of 2.00, pulp density of 1.59%, and initial concentration of ferrous ions of 0.0 g/L have been determined as optimum levels of the process parameters to achieve the maximum total copper extraction of 85.98%, compared to 84.57%, maximum copper extraction in the tests conducted, i.e. a 1.41% upgrading in total copper extraction. This maximum total copper extraction was obtained at the optimum levels of the process parameters. Also, in this research effects of leaching time on process parameters were examined. The following results were obtained:
Optimization of the levels of pH and pulp density, and initial Fe(II) for low-grade ore bacterial leaching processes should be carried out using DOEs such as CCD.
Pulp density and pH had a more significant effect on the copper extraction after 22 days of incubation than initial ferrous iron concentration. 17
After 22 days of incubation, the level of pH during the process was found to depend on both levels of pulp density and initial concentration of ferrous ions, interaction factors with each other.
There was no statistically significant interaction between the initial Fe (II) concentration in the bacterial leaching media and pulp density at the 22nd day.
Decreasing pulp density in the optimum level, 1.59% w/v, had the effect of shifting the optimum level of pH to higher values. Furthermore, this also diminished the importance of pH control during the process.
After modeling and optimization the process parameters, in this research the effect of leaching time on independent parameters as well as on copper extraction was examined with substituting results of all runs at RSM and analyzing them after elapsing of a given time.
Acknowledgements This paper is published with the permission of the National Iranian Copper Industries Company. The various contributions to this work by members of the R&D Division of the National Iranian Copper Industries Company are gratefully acknowledged. Also, we extend our heartfelt gratitude to Dr. H. Yazdani for his invaluable assistance.
References [1] H. Xu, C. Wei, C. Li, G. Fan, Z. Deng, X. Zhou, S. Qiu, Leaching of a complex sulfidic, silicate-containing zinc ore in sulfuric acid solution under oxygen pressure. Separation and Purification Technology 85 (2012) 206–212. [2] Z. Sarcheshmehpour, A. Lakzian, A. Fotovat, A.R. Berenji, G.H. Haghnia, S.A. Seyed Bagheri, The effects of clay particles on the efficiency of bioleaching process. Hydrometallurgy 98 (2009) 33–37. [3] Z. Sarcheshmehpour, A. Lakzian, A. Fotovat, A.R. Berenji, G.H. Haghnia, S.A. Seyed Bagheri, Possibility of using chemical fertilizers instead of 9K medium in bioleaching process of low-grade sulfide copper ores. Hydrometallurgy 96 (2009) 264–267. [4] T. Rohwerder., T. Gehrke., K. Kinzler., W. Sand., Bioleaching review part A: Progress in bioleaching: fundamentals and mechanisms of bacterial metal sulfide oxidation. Appl. Microbi. Biotech. 63 (2003) 239–248. [5] M. Ranjbar, M. Schaffie, M. Pazouki, R. Ghazi, A. Akbary, S. Zanddevakili, S.A. Seiedbaghery, Z. Manafi, Application potential of biohydrometallurgy in the Iranian mining industry. Adv. Mater. Res. 21 (2007) 38 – 41. [6] M. Ranjbar, E. Darezereshki, M. Schaffie, Z. Manafi, M. Lotfalian, M., 2009. Optimization of copper recovery from Sarcheshmeh low grade ores by bacterial leaching, J. Separ. Sci. Eng. 1 (2009) 15 – 31. [7] M. Ranjbar, M. Lotfalian, M. Schaffie, E. Darezereshki, S.A. Seyed Bagheri, Z. Manafi, Bioleaching of low-grade chalcopyritic ore using thermophile bacteria, J. Separ. Sci. Eng. 1 (2009) 57 – 65.
18
[8] M. Yaghobi Moghaddam, M. Ranjbar, M. Schaffie, Z.Manafi, 2010. Optimization of the operational parameters for a copper bioleaching from heap 3 ore at Sarcheshmeh, MS Thesis, Shahid Bahonar university of Kerman, Iran. [9] D.F. Haghshenas, E. Keshavarz Alamdari, M. Amouei Torkmahalleh, B. Bonakdarpour, B. Nasernejad, Adaptation of Acidithiobacillus ferrooxidans to high grade sphalerite concentrate, Miner. Eng. 22 (2009) 1299–1306. [10] Y. Rodriguez, A. Ballester, M.L. Blazquez, F. Gonzalez, J.A. Munoz, New information on the sphalerite bioleaching mechanism at low and high temperature. Hydrometallurgy 71 (2003) 57–66. [11] H.R. Watling, The bioleaching of sulphide minerals with emphasis on copper sulphides — A review, Hydrometallurgy 84 (2006) 81–108. [12] S. Shi, Z. Fang, J. Ni, Comparative study on the bioleaching of zinc sulphides. Proc. Biochem, 41 (2006) 438–446. [13] M.R. Shayestehfar, S. Karimi Nasab, H. Mohammadalizadeh, Mineralogy, petrology, and chemistry studies to evaluate oxide copper ores for heap leaching in Sarcheshmeh copper mine, Kerman, Iran, J. Hazar. Mater. 154 (2008) 602–612. [14] M. Oliazadeh, M. Massinaie, S.A. Seyed Bagheri, A.R. Shahverdi, Recovery of copper from melting furnaces dust by microorganisms, Miner. Eng. 19 (2006) 209–210. [15] S.M.J. Koleini, V. Aghazadeh, A. Sandström, Acidic sulphate leaching of chalcopyrite concentrates in presence of pyrite, Miner. Eng. 24 (2011) 381–386. [16] D.C. Montgomery, Design and Analysis of Experiments, 6th Edition, John Wiley & Sons, New York, 2006. [17] S.Y. Chen, P.L. Lin, Optimization of operating parameters for the metal bioleaching process of contaminated soil, Separ. Purif. Tech. 71 (2010) 178–185. [18] G.S. Simate, S. Ndlovu, M. Gericke, Bacterial leaching of nickel laterites using chemolithotrophic microorganisms: process optimization using response surface methodology and central composite rotatable design, Hydrometallurgy 98 (2009) 241–246. [19] T.J. Xu, Y.P. Ting, 2004. Optimization on bioleaching of incinerator fly ash by Aspergillus niger — use of central composite design,. Enz. Microb. Techn. 35 (2004) 444– 454. [20] H.N. Sin, S. Yusof, N.S.A. Hamid, R.A. Rahman, Optimization of enzy-matic clarification of sapodilla juice using response surface methodology, J. Food Eng. 73 (2006) 313–319. [21] Istadi, N.A.S. Amin, Optimization of process parameters and catalyst compositions in carbon dioxide oxidative coupling of methane over CaO-MnO/CeO2 catalyst using response surface methodology, Fuel Proc. Tech. 87 (2006) 449–459. [22] R.H. Myers, D.C. Montgomery, Response Surface Methodology: Process and Product Optimization Using Designed Experiments, Wiley, New York, 2002. [23] N. Aslan, Y. Cebeci, Application of Box–Behnken design and response surface methodology for modeling of some Turkish coals, Fuel 86 (2007) 90–97. [24] N. Aslan, Application of response surface methodology and central composite rotatable design for modeling the influence of some operating variables of a multi-gravity separator for coal cleaning, Fuel 86 (2007) 769–776. [25] N. Aslan, Modeling and optimization of multi gravity separator to produce celestite concentrate, Powd. Tech. 174 (2007) 127–133. [26] D.P. Obeng, S. Morrell, T.J.N. Napier, Application of central composite rotatable design to modeling the effect of some operating variables on the performance of the three-product cyclone, Inter. J. Miner. Proc. 76 (2005) 181–192. [27] A.L. Martinez, A.S. Uribe, F.R.P. Carrillo, J.A. Coreno, J.C. Ortiz, Study of celestite flotation efficiency using sodium dodecyl sulfonate collector: factorial experiment and statistical analysis of data, Inter. J. Miner. Proc. 70 (2003) 83–97. [28] S.A. Seyed Bagheri, H.R. Hassani, Isolation and preliminary identification of some iron and sulfur oxidizing bacteria from Sarcheshmeh Copper Mine. In: Ciminelli, S.T., GarciaJr. Jr., O., (Eds.), Biohydrometallurgy: Fundamentals, Technology and Sustainable
19
Development, Part A. Bioleach., Microb. Molec. Biol. Elsevier, Amsterdam, 2001, pp. 393– 396. [29] M.P. Silverman, D.S. Lundgren, Studies of the chemoautotrophic iron bacterium Ferrobacillus ferrooxidans. I. an improved medium and a harvesting procedure for securing high cells yields, J. Bacteri. 77 (1959) 642–647. [30] J.S. Kwak, Application of Taguchi and response surface methodologies for geometric error in surface grinding process, Inter. J. Mach. Tool. Manuf. 45 (2005) 327–334. [31] N. Aslan, F. Cifci, D. Yanb, Optimization of process parameters for producing graphite concentrate using response surface methodology. Separation and Purification Technology 59 (2008) 9–16. [32] E.M. Silva, H. Rogez, Y. Larondelle, Optimization of extraction of phenolics from Inga edulis leaves using response surface methodology. Separation and Purification Technology 55 (2007) 381–387. [33] N. Naseri Joda, F. Rashchi, Recovery of ultra fine grained silver and copper from PC board scraps. Separation and Purification Technology 92 (2012) 36–42. [34] V. Gunaraj, N. Murugan, Application of response surface methodologies for predicting weld base quality in submerged arc welding of pipes, J. Mater. Proc. Tech. 88 (1999) 266– 275. [35] M. Safarzadeh, D. Moradkhani, M. Ojaghi Ilkhchi, N. Hamedani Golshan, Determination of the optimum conditions for the leaching of Cd–Ni residues from electrolytic zinc plant using statistical design of experiments. Separation and Purification Technology 58 (2008) 367–376. [36] J. Landaburu-Aguirre, E. Pongrácz, R. L. Keiski, Separation of cadmium and copper from phosphorous rich synthetic waters by micellar-enhanced ultrafiltration. Separation and Purification Technology 81 (2011) 41–48. [37] G.E.P. Box, K.B. Wilson, On the experimental attainment of optimum conditions, J. Roy. Stat. Soc.: Series B (Stat. Meth.) 13 (1951) 1–45. [38] G.E.P. Box, W.G. Hunter, The 2k − p fractional factorial designs, parts I and II.. J. Technomet. 3 (1961) 311–458. [39] G.E.P. Box, J.S. Hunter, Multi-factor experimental design for exploring response surfaces, Ann. Mathem. Stat. 28 (1957) 195–241. [40] S. Chen, P. Lin, Optimization of operating parameters for the metal bioleaching process of contaminated soil. Separation and Purification Technology 71 (2010) 178–185. [41] J.J. Cilliers, R.C. Austin, J.P. Tucker, An evaluation of formal experimental design procedures for hydrocyclone modelling. In: L. Svarovsky, M.T. Thew (Eds.), Proceedings of the 4th International Conference on Hydrocyclones, Southampton, Kluwer Academic Publishers, 1992, 31– 49. [42] E. Aghaie, M. Pazouki, M.R. Hosseini, M. Ranjbar, F. Ghavipanjeh, Response surface methodology (RSM) analysis of organic acid production for Kaolin beneficiation by Aspergillus niger, Chem. Eng. J.147 (2009) 245–251. [43] S.L.C. Ferreira, R.E. Bruns, E.G.P. Silva, W.N.L. Santos, C.M. Quintella, J.M. David, J.B. Andrad, M.C. Breitkreitz, I.C.S.F. Jardim, B.B. Neto, Statistical designs and response surface techniques for the optimization of chromatographic systems, Chromatog. A 1158 (2007) 2–14. [44] H.L. Liu, Y.R. Chiou, Optimal decolorization efficiency of Reactive Red 239 by UV/TiO2 photocatalytic process coupled with response surface methodology, Chem. Eng. J. 112 (2005) 173–179. [45] A.A.L. Zinatzadeh, A.R. Mohamed, A.Z. Abdullah, M.D. Mashitah, M.H. Isa, G.D. Najafpour, Process modeling and analysis of palm oil mill effluent treatment in an up- flow anaerobic sludge fixed film bioreactor using response surface methodology (RSM), Wat. Res. 40 (2006) 3193–3208. [46] B.K. Korbahti, M.A. Rauf, Response surface methodology (RSM) analysis of photoinduced decoloration of toludine blue, Chem. Eng. J. 136 (2008) 1–76.
20
[47] J. Isar, L. Agarwal, S. Saran, R.K. Saxena, A statistical method for enhancing the production of succinic acid from Escherichia coli under anaerobic conditions, Biores. Tech. 97 (2006) 1443–1448. [48] H. Deveci, A. Akcil, I. Alp, Bioleaching of complex zinc sulphides using mesophilic and thermophilic bacteria: comparative importance of pH and iron, Hydrometallurgy 73 (2004) 293–303. [49] A.B. Jensen, C. Webb, Ferrous sulphate oxidation using Thiobacillus ferrooxidans: a review, Proc. Biochem. 30 (1995) 225 – 236. [50] D.J. Kim, D. Pradhan, J.G. Ahn, S.W. Lee, S.W., Enhancement of metals dissolution from spent refinery catalysts using adapted bacteria culture – Effects of pH and Fe(II), Hydrometallurgy 103 (2010) 136 –143. [51] S.I. Grishin, J.M. Bigham, O.H. Tuovinen, Characterization of jarosite formed upon bacterial oxidation of ferrous sulfate in a packed-bed reactor, Appl. Envir. Microb. 54 (1988) 3101–3106. [52] C. Pogliani, E. Donati, Immobilisation of Thiobacillus ferrooxidans: importance of jarosite precipitation, Proc. Biochem. 35 (2000) 997 – 1004. [53] M. Gericke, A. Pinches, J.V. Van Rooyen, Bioleaching of a chalcopyrite concentrate using an extremely thermophilic culture, Inter. J. Miner. Proc. 62 (2001) 243–255. [54] J.G. Ochoa, S. Foucher, S. Poncin, D. Morin, G. Wild, Bioleaching of mineral ores in a suspended solid bubble column: hydrodynamics, mass transfer and reaction aspects, Chem. Eng. Sci. 54 (1999) 3197–3205. [55] T. Lewis, S. Sambaraju, Biotechnology, Printed by the Technology Education Program, Science, Technology Engineering, and Mathematics Section, School of Teaching and Learning, College of Education and Human Ecology, The Ohio State University, 2007, pp. 16–17. [56] A.D. Bailey, G.S. Hansford, A fluidized bed reactor as a tool for the investigation of oxygen availability on the bio-oxidation rate of sulphide minerals at high solids concentrations, Miner. Eng. 6 (1993) 387–396. [57] A.D. Bailey, G.S. Hansford, Oxygen mass transfer limitation of batch bio-oxidation at high solids concentration, Miner. Eng. 7 (1994) 293–303. [58] M.I. Sampson, C.V. Phillips, Influence of base metals on the oxidising ability of acidophilic bacteria during the oxidation of ferrous sulphate and mineral sulfide concentrates, using mesophiles and moderate thermophiles, Miner. Eng. 14 (2001) 317 – 340. [59] D. Pradhan, D. Mishra, D.J. Kim, G. RoyChaudhury, S.W. Lee, Dissolution kinetics of spent petroleum catalyst using two different acidophiles, Hydrometallurgy 99 (2009) 157– 162. [60] L. Ahonen, O.H. Tuovinen, Bacterial leaching of complex sulfide ore samples in benchscale column reactors, Hydrometallurgy 37 (1995) 1–2. [61] M.J. Leahy, M.P. Schwarz, Modelling jarosite precipitation in isothermal chalcopyrite bioleaching columns, Hydrometallrgy 98 (2009) 181–191.
21
Table(s)
Table 1: Relationship between coded and actual value of variables Code
Actual level of variable
1
0
1
x min [( x max x min ) / 2] [( x max x min ) / 2 ] [( x max x min ) / 2] [( x max x min ) / 2] [( x max x min ) / 2 ]
x max k/4
xmax and xmin = maximum and minimum values of x, respectively; α=2 ; k = number of variables.
Table 2: Coded and actual levels of independent variables used in RSM design Independent variable Symbol Coded levels Actual levels –β
–1
0
+1
+β
Initial pH
x1
0.96
1.3
1.8
2.3
2.64
Pulp density (%w/v)
x2
1.59
5
10
15
18.41
Initial concentration of ferrous ions (g/L)
x3
0.00
1.27 3.14
5
6.27
Run
1 2 3 4 5 6 7 8 9 10 11 12 13 14 15 16 17 18 19 20
Table 3: Coded and actual levels of the independent variables Coded level of variables Actual level of variables x1 x2 x3 Initial Pulp Density (%w/v) Initial concentration pH of Fe2+ (g/L) 0.00 1.68 0.00 1.80 18.41 3.14 -1.00 -1.00 1.00 1.30 5.00 5.00 -1.68 0.00 0.00 0.96 10.00 3.14 1.68 0.00 0.00 2.64 10.00 3.14 -1.00 -1.00 -1.00 1.30 5.00 1.27 0.00 0.00 0.00 1.80 10.00 3.14 0.00 0.00 0.00 1.80 10.00 3.14 0.00 -1.68 0.00 1.80 1.59 3.14 0.00 0.00 0.00 1.80 10.00 3.14 -1.00 1.00 -1.00 1.30 15.00 1.27 0.00 0.00 0.00 1.80 10.00 3.14 0.00 0.00 0.00 1.80 10.00 3.14 1.00 -1.00 1.00 2.30 5.00 5.00 1.00 1.00 1.00 2.30 15.00 5.00 0.00 0.00 -1.68 1.80 10.00 0.00 1.00 1.00 -1.00 2.30 15.00 1.27 0.00 0.00 0.00 1.80 10.00 3.14 1.00 -1.00 -1.00 2.30 5.00 1.27 0.00 0.00 1.68 1.80 10.00 6.27 -1.00 1.00 1.00 1.30 15.00 5.00
Table 4: Summary of the ANOVA results for the response model at the 1st, 4th, 9th, 14th, and 22nd days ANOVA results R2 R2 adjusted R2 predicted Prob. > F Lack of fit (LOF) PRESS Adequate precision Coefficient of variation
the 1st day
0.693 0.636 0.447 0.0002 0.101 72.68 12.396 3.43
the 4th day
the 9th day
279.71 3.654
339.84 2.250
0.232 149.80 12.979
the 22nd day 0.948 0.924 0.883 < 0.0001 0.633 38.620 23.598
6.26
6.49
3.08
1.48
0.361 0.131 0.190 Insignificant Insignificant Insignificant 0.129 0.825 0.465 0.985
the 14th day
0.799 0.746 0.627 < 0.0001
Table 5: Amounts of p-value for each variable in the polynomial model at the 1st, 4th, 9th, 14th, and 22nd days Source Model A (Initial pH) B (pulp density) C ([Fe2+]initial) A2 AB AC
the 1st day
0.0002 < 0.0001 0.0505 -
0.0363 a
the 4th day 0.1291 -
the 9th day
the 14th day
0.8246
< 0.0001 0.0007 0.0003 0.0052 0.0097
-
-
Coefficients of B2, C2, and BC were zero at all days
the 22nd day < 0.0001 < 0.0001 < 0.0001 0.016 < 0.0001 0.003 0.029
Table 6: Observed and predicted values of total copper extraction at the 1st, 4th, 9th, 14th, and 22nd days Run
the 1st day Observed
1 2 3 4 5 6 7 8 9 10 11 12 13 14 15 16 17 18 19 20
45.31 50.39 47.96 44.11 48.35 46.35 46.81 48.12 44.21 47.42 45.94 46.93 45.63 38.75 44.70 44.30 45.71 44.75 48.23 50.97
Predicted
44.72 50.65 49.96 42.53 48.08 46.25 46.25 47.77 46.25 46.27 46.25 46.25 43.66 41.85 46.25 44.41 46.25 46.23 46.25 48.83
the 4th day Observed
49.55 51.57 56.75 51.39 59.80 50.87 49.77 48.20 54.45 54.82 48.01 56.15 58.53 47.50 52.14 53.08 49.69 50.37 57.64 51.90
Predicted
50.84 53.00 56.26 51.92 56.44 50.84 50.84 50.84 50.84 56.44 50.84 50.84 53.86 53.86 54.91 50.42 50.84 50.42 54.91 53.00
the 9th day Observed
59.18 56.61 57.23 54.64 62.10 51.28 57.57 58.70 63.24 62.38 55.53 62.26 58.88 57.50 59.12 63.08 66.39 62.17 59.98 62.09
Predicted
60.77 57.49 58.57 57.12 59.43 60.02 60.02 59.27 60.02 61.88 60.02 60.02 58.19 57.52 61.65 59.45 60.02 60.12 58.40 59.94
the 14th day Observed
67.81 74.43 77.11 66.22 77.78 78.30 79.31 81.77 79.52 75.22 78.21 74.67 75.65 65.14 77.82 69.59 76.94 77.17 74.09 78.32
Predicted
71.65 77.82 75.51 66.51 77.82 76.60 76.60 81.56 76.60 76.78 76.60 76.60 77.33 66.58 76.60 66.58 76.60 77.33 76.60 76.78
the 22nd day Observed
Predicted
75.72 81.60 79.48 69.51 82.11 80.94 79.43 84.57 79.93 76.95 78.33 77.43 78.22 67.68 80.26 71.76 78.90 80.62 76.23 79.00
73.92 81.95 78.98 69.58 81.67 79.10 79.10 84.27 79.10 78.42 79.10 79.10 77.27 68.21 80.54 71.93 79.10 80.99 77.65 78.71
Table 7- Effect of physicochemical parameters on Copper Extraction (%) at the 1st, 4th, 9th, 14th, and 22nd days (substituted in RSM)
Max Min the 1st day Max Min the 4 th day Max Min the 9 th day Max Min the 14 th day Max Min the 22 nd day pH
44.04 48.46 4.42 51.32 53.90 2.58 59.05 58.18 0.87 72.59 77.93 5.34 74.60 80.19 5.59
Pulp density
45.34 47.16 1.82 49.92 51.49 1.57 60.12 59.23 0.89 73.41 79.30 5.89 76.02 82.17 6.15
Fe initial 46.75 45.74 1.01 52.53 52.66 0.13 58.92 60.86 1.94 76.40 78.23 1.83 78.24 79.95 1.71 2
Figure(s)
Figure 1 100
Cum. passing%
80 60 40 20 0 1
10 Size (mm)
100
Figure 2 100
Cum. passing%
90
80
70
60 10
60
110 160 Size (µm)
210
260
Figure 3
Figure 4
Figure 5
Figure 6
Figure 7
Figure 8
Figure 9
Figure 10
Figure Captions:
Fig. 1. Cumulative size distribution before size reduction. Fig. 2. Cumulative size distribution after size reduction. Fig. 3. Possible approaches to examine the effect of time on the copper extraction. Fig. 4. Internally studentized residual plots for Y at the 22nd day in the model. Fig. 5. Response surface plots showing the effect of: a) initial pH and pulp density; b) initial pH and initial concentration of ferrous ions; and contour plots of interactions between: c) initial pH and pulp density; d) initial pH and initial concentration of ferrous ions. Fig. 6. Leaching time effect on the copper extraction and pH at a) the 1st, b) the 4th, c) the 9th, d) the 14th, and e) the 22nd days. Fig. 7. Leaching time effect on the copper extraction and pulp density at a) the 1st, b) the 4th, c) the 9th, d) the 14th, and e) the 22nd days. Fig 8. Leaching time effect on the copper extraction and initial concentration of Fe(II) ions at a) the 1st, b) the 4th, c) the 9th, d) the 14th, and e) the 22nd days. Fig 9. Changes of pH in all levels during the time. Fig 10. Changes of redox potential in all levels during the time.
*List of Potential Reviewers
List of international reviewers
1. Prof. A. de Hann Department of Chemical Engineering and Chemistry, Technische Universiteit Eindhoven, Postbus 513, 5600 MB Eindhoven, Netherlands. Fax: +31 40-246 3966 Phone: +852 2358 7138 Email:
[email protected]
2. Prof. C. Tien Department of Biomedical and Chemical Engineering, Syracuse University, Link Hall, Syracuse, NY 13244-1190, USA. Fax: +1 315 443 1243 Phone: +1 315 443 4050 Email:
[email protected]
3. Prof. B. Van der Bruggen Dept. Chemische Ingenieurstechnieken, Katholieke Universiteit Leuven, De Croylaan 46, 3001 Heverlee, Belgium. Fax: 32 16 322 991, Phone: 32 16 322 340/726 Email:
[email protected]