energies Article
Modeling and Experimental Study of a Small Scale Olive Pomace Gasifier for Cogeneration: Energy and Profitability Analysis Domenico Borello 1 , Antonio M. Pantaleo 2,3, * Paolo De Filippis 4 and Nilay Shah 2 1
2 3 4
*
ID
, Michele Caucci 1 , Benedetta De Caprariis 4 ,
DIMA—Dipartimento di Ingegneria Meccanica e Aerospaziale, Sapienza Università di Roma, Via Eudossiana 18, 00184 Rome, Italy;
[email protected] (D.B.);
[email protected] (M.C.) CPSE—Centre for Process Systems Engineering, Imperial College London, South Kensington Campus, London SW7 2AZ, UK;
[email protected] DISAAT—Dipartimento di Scienze Agro-Ambientali e territoriali, Università di Bari, Via Amendola 165/A, 70125 Bari, Italy DICMA—Dipartimento di Ingegneria Chimica Materiali e Ambiente, Sapienza Università di Roma, Via Eudossiana 18, 00184 Rome, Italy;
[email protected] (B.D.C.);
[email protected] (P.D.F.) Correspondence:
[email protected]; Tel: +39-320-7980448
Received: 19 September 2017; Accepted: 17 November 2017; Published: 23 November 2017
Abstract: A thermodynamic model of a combined heat and power (CHP) plant, fed by syngas produced by dry olive pomace gasification is here presented. An experimental study is carried out to inform the proposed model. The plant is designed to produce electric power (200 kWel ) and hot-water by using a cogenerative micro gas turbine (micro GT). Before being released, exhausts are used to dry the biomass from 50% to 17% wb. The ChemCad software is used to model the gasification process, and input data to inform the model are taken from experimental tests. The micro GT and cogeneration sections are modeled assuming data from existing commercial plants. The paper analyzes the whole conversion process from wet biomass to heat and power production, reporting energy balances and costs analysis. The investment profitability is assessed in light of the Italian regulations, which include feed-in-tariffs for biomass based electricity generation. Keywords: olive pomace gasification; combined heat and power; thermo-economic analysis; ChemCad model; microturbines
1. Introduction Mediterranean countries are responsible for a large part of the world olive oil production. The environmentally friend disposal of the olive pomace requires the implementation of waste-to-energy strategies through pomace gasification. A proper solution is to process the crude olive pomace (COP) aiming at obtaining dry olive pomace (DOP) as a fuel. In [1,2], an overview of the most common olive oil extraction processes is provided. A three-phases centrifugation system is generally adopted in Italy. The main products are: (i) olive oil—20% in weight of olives; (ii) COP—50% in weight of olives; (iii) a large amount of olive mill wastewater (OMW)—120% in weight of olives, which includes the water added during the process [3]. The extraction of pomace oil from COP allows obtaining the DOP as a by-product (about 10% wb), generally used for energy conversion in CHP or thermal plants. The reduced demand for pomace oil (due to excess olive oil availability from emerging markets) and consequently the increased production of COP with high moisture content (>60%) has increased the problem of olive waste disposal [4]. The option of discharging COP to the soil as fertilizer Energies 2017, 10, 1930; doi:10.3390/en10121930
www.mdpi.com/journal/energies
Energies 2017, 10, 1930
2 of 17
has the drawback of the high phenols, fatty acid and tannin content [2,5]. However, COP can be directly used for energy conversion, after drying [6]. The main technical issues are in this case the energy consumption for the drying process, the air emissions from combustion (unburned carbon, particulate matter), the logistics of supply and storage [7]. In Italy, the existing energy policies support the development of biomass small scale CHP plants, as described in [8]. Thermo-economic approaches can be usefully employed to compare operation strategies and profitability of small scale CHP plants fed by syngas [9]. In [10] an analysis of a more sophisticated configuration (micro GT and bottoming ORC) is proposed to investigate the best operating conditions. Among biomass energy conversion systems, gasification is one of the most promising. A wide number of gasification technologies are available, and for small-medium applications downdraft and updraft systems are the most common. When considering syngas as a fuel, internal combustion engines and micro GT are generally employed for power and heat generation. The ChemCad software (Chemstations, Inc, Houston, TX, USA) has been demonstrated to be an appropriate tool for computing solid fuel gasification. In [11] a ChemCad model of a biomass gasification plant coupled to a micro GT is validated through experimental data. In light of this, in this paper we adopted ChemCad to model the COP to syngas gasification process. We assume an updraft gasifiers and its use to feed a micro GT because of its lower emissions and reduced O&M costs. In the next section, a review of gasification technologies and modelling approaches is proposed, and successively a description of the CHP plant under investigation is presented. The energy balance of the system as resulting from the simulation, informed by specific experimental tests, and the economic profitability of the investment in the Italian legislative scenario are then presented, and results are discussed in the last section. 2. Gasification Technologies and Modelling Approaches The gasification process is the conversion of a solid carbonaceous material, such as biomass, in a gaseous energy carrier (syngas) through a partial high temperature oxidation [12–15]. The syngas is composed by CO, CO2 , H2 , CH4 , H2 O, N2 , other hydrocarbons such as C2 H4 and C2 H6 and further substances such as ash, coal particles, tar and oils. The gasifying agent can be air, steam, oxygen or a mixture of these. The syngas can be used as a gaseous fuel, thus easy to convey and transport, or used in other industrial processes. The gasification process takes place within a reactor and can be divided into two main stages. In the first stage of pyrolysis, as a consequence of the thermochemical decomposition of biomass at temperatures above 350 ◦ C, the volatile components of the fuel are released [16]. These volatile vapors contain gaseous hydrocarbons, hydrogen, carbon monoxide, carbon dioxide, water vapor and tar. The solid fraction from the pyrolysis process (bio-char) is an agglomerate of complex nature consisting of carbon, ash, sulfur compounds and volatile hydrocarbons. In the second stage, the gasification of pyrolysis products is achieved, and the reaction with the gasifying agent leads to an increase of fuels concentration, and to the conversion of bio-char. This last stage is the most important; it is the slower phase, hence it affects the kinetics of the whole process and, consequently, both the sizing and the performance of the reactor. A first classification of gasifiers proposes direct and indirect systems [17,18]. In the direct type, the burning of a part of the pyrolytic products provides heat to both pyrolysis and gasification, and the process is developed inside the reactor; in the indirect type, the combustion takes place in a separate combustion chamber and the heat is carried to the pyrolysis zone by means of a flow glowing sand or other material (heat transport is the critical point of this technology, slowing down the process [19]). Further classification criteria are based on the operating pressure, the gasifying agent, the type of the reactor construction [20,21]. Indirect gasifiers normally operate at atmospheric pressure, whereas in the direct type considerably higher pressure can be reached, with the advantage of a produced syngas that does not need to be compressed. The choice of the gasifying agent is very important, because it highly affects the characteristics of the syngas. Both the composition and calorific
Energies 2017, 10, 1930
3 of 17
value vary greatly with the gasifying agent: air gasification presents a low heating value (LHV) of the syngas in the order of 4–6 MJ/N·m3 , and large volumes of N2 , while pure oxygen gasification allows LHV ranging between 12 and 18 MJ/N·m3 [22]. Moreover, the gasifiers can be classified in fixed bed [23,24], fluidized bed [25,26] or bed dragged gasifiers. The fixed bed gasifiers are distinguished in co-current gasifiers (downdraft) and counter current ones (updraft) [27,28]. The configuration choice is dependent on the biomass characteristics, typology and quality required for the syngas, processing plant size and cost issues. In particular, the downdraft gasifier is usually used for the production of syngas with a high content of volatile matter and low tar content. This technology is the most popular in the small scale range [29,30]. The state-of-the-art of the fluidization technology for the gasification of biomass is reviewed in [31], where the different gasifier types, fluidized bed technologies, gas cleaning systems and influence of process parameters on the syngas and biochar composition are discussed. In [32], a review of thermochemical biomass gasification for producing biofuels and chemicals is presented, with a specific focus on the effects of operating conditions on gasification reactions, on the reliable prediction of the product compositions, and on conversion efficiency optimization. The promising conversion route of bio-hydrogen production via biomass air gasification is investigated in [33,34] focusing on agricultural wastes and olive kernels via bubbling fluidized bed gasifier. Mass and energy balances on a pre-pilot scale bubbling fluidized bed reactor fed with mixtures of plastic waste, wood, and coal were also discussed in [35] in order to explore the influence of input fuel on gas composition and gas cleaning. In the specific olive waste-to-energy sector, several experimental researches have been proposed. In particular, in [36] the atmospheric gasification of untreated olive stones at 700–820 ◦ C is proposed. The gasification process at higher temperatures reported higher carbon conversion and gas yield, despite decreasing the LHV of the gas when increasing the air flow rates. In addition, the high potassium content and low ash fusion temperature of the olive stone ashes were found to be responsible for the bed agglomeration problems, so requiring the use of two inert materials (sand and ofite), which however affected the fluidized bed operation and reliability. The biochar yield, biomass burning rate, syngas composition and tar content of a updraft gasifier feed by pine wood chips at different particle size, moisture content and compactness was studied in [37], reporting, among the others, an increase of biochar yield when increasing the particle size. In [38], the behavior of different biomasses (wood, torrefied biomass, agricultural and industrial wastes) after gasification in a bubbling fluidized bed gasifier at mild temperatures (600 ◦ C) was investigated, using an air–steam mixture at different stoichiometric ratios. The low-temperature gasification of biomass in a purpose-built atmospheric bubbling fluidized bed reactor was optimized on the basis of the experimental results; it was found that the same gasification conditions (steam quantity) do not affect every biomass in the same way, and gasification conditions must be carefully tested for each biomass. The research also investigated the possibility of reusing the carbon-rich partially oxidized biochar in agricultural applications or as a catalyst-sorbent precursor. The properties of biochar depend heavily on biomass feedstock, gasifier design and operating conditions, and in light of this, ref. [38] investigated the influence of biomass type and equivalence air ratio on the physiochemical properties of biochar from gasification. The production of biochar from hazelnut and olive pruning residues via carbonization was also investigated in [39], performing a physicochemical characterisation of the produced biochar in light of the European standards. A simulation of the gasification process requires the assessment of the different phases of pyrolysis, partial oxidation and gasification. The modelling of the chemical reactions is very complex, and the kinetics are far from the equilibrium conditions. For these reasons, simplified models are usually assumed, such as mono-dimensional ones [40–43]. To predict the real behaviour of the plant, numerical simulation codes can be successfully adopted. In [16] a mathematical CFD model of biomass pyrolysis is presented. The model predicts the tar and light particulate matter in the syngas as well as char fraction released in a biomass packed porous bed system. In [44], the gasification of lignocellulosic
Energies 2017, 10, 1930
4 of 17
biomass coupled with a SOFC/ORC plant is modelled and validated. The influence of air enrichment and of biomass moisture content is also addressed. A good and reliable theoretical model of a gasifier is very important, to provide useful information for the design, optimal operation and energy performance assessment Many theoretical models can be found in the literature simulating the performance of gasifiers [44–49], under different operating conditions (e.g., in terms of moisture content, type of biomass, sizes of the molecules, and ash contents). In particular, some approaches use kinetic models to represent the biomass gasification process [44–46], which are suitable and accurate at moderately high temperatures (T < 800 ◦ C), but very complex, while others apply equilibrium models and are particularly accurate at high temperature [47–49]. Equilibrium models are based either on the use of the equilibrium constants or on the minimization of the Gibbs free energy. When equilibrium constants are considered, the equilibrium models are based on the use of fundamental chemical reaction mechanisms and of the chemical composition of the biomass. In this case, their complexity depends primarily on the number of reactions that are considered. In many cases these methods, using a limited number of reactions, greatly simplify the analysis, while compromising the reliability and accuracy of the results. On the opposite, when the minimization of the Gibbs free energy is considered, the exact knowledge of the chemical reactions mechanism is not required for the syngas components prediction. Several review papers are available in literature in the field of modeling biomass gasification. In [50], the state of art modeling works based on specific criteria such as type of gasifier and feedstock have been categorized in a comprehensive review, reporting comparative assessments of the modeling techniques and output for each category. In [51], a similar review is proposed but including artificial neural networks and Aspen Plus gasification models, while [52] focuses on mathematical and computational approaches for design of biomass gasification for hydrogen production. In [53], biomass gasification in bubbling and circulating fluidized bed gasifiers is reviewed, including both black-box models and computational fluid-dynamic ones or comprehensive fluidization models, with semi-empirical correlations. Several free commercial codes [54] implement the Gibbs free energy minimization and propose a relatively simple and easy option to model the gasification, with accuracy that could be acceptable on the basis of the specific application. Most of the thermodynamic modeling and optimization tools are based on a modular structure, which considers the plant as a set of interconnected components; each of them can be modelled through specific equations and mass/energy flows. The research has recently moved from the simple model of gasification, based on the Gibbs free energy minimization, to more complex models, which attempt to simulate most of the physical phenomena taking place in a gasifier. For instance, in [55] different models with increasingly high level of complexity have been proposed, and the results show that a simplistic use of the default gasifier module determines an under-estimation of the methane molar percentage into the syngas. The researches proposed in [55–58] suggests the following improvements to the downdraft biomass gasification model: (i) modeling three cascade reactors, simulating respectively the pyrolysis, oxidation and reduction zones; (ii) separation of a fraction (5% by mass) of the inlet carbon content, in order to take into account the unavoidable losses occurring in the gasifier due to char formation; (iii) bypass of a fraction of the methane formed during the pyrolysis directly to the reduction outlet, in order to reflect the unavoidable losses and the impossibility to achieve a complete equilibrium composition during the gasification. In light of this state of art on gasification modelling, we here propose an original approach based on interconnection of thermochemical components and informed by experimental data at lab scale, as described in the following section. 3. Experimental Set-Up and Gasification Modeling The biomass gasification and the cogeneration section are modeled using ChemCad. The Peng-Robinson state equation is used. The relevant ChemCad objects used are: (a) reactors
Energies 2017, 10, 1930
5 of 17
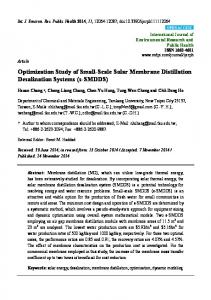
(stoichiometric and Gibbs); (b) heat exchangers (coolers/heaters and condensers); (c) expander and compressors. It is assumed that the ChemCad objects always reach equilibrium conditions. To take in account the real behaviour of all components, validation/calibration approaches are required, and for this purpose the results of specific experimental tests are used. In particular, for the pyrolysis/gasification process, experimental studies were carried out at DICMA using a laboratory scale down-draft gasifier. 3.1. Experimental Set-Up The lab-scale plant is composed by an up-draft gasifier fed by DOP and air used as gasifying agent. A plant schematic is reported in [59]. Pomace is dried at 17% wb moisture content before feeding the reactor. The gasification tests are performed in a semi-continuous plant. The plant is divided in three zones: the pyrolysis, gasification and the reforming unit. The feeding system is composed by a hopper and a screw conveyor. The biomass, drag by a nitrogen flux, enters the pyrolysis reactor, constituted by a stainless tube of 40 mm and 700 mm length with a tilt angle of 70 ◦ C. The tube, externally heated by means of an electrical heater at 750 ◦ C, contains a screw that allows controlling the residence time of the biomass into the reactor. Here the volatiles, tar, light gases and char are formed. The obtained char falls in the connected vertical fixed bed gasification reactor where air is injected as gasifying agent from the bottom (800 ◦ C at the windbox). The gasification gas and the volatiles produced in the pyrolysis flow through the reforming reactor (i.d. = 40 mm; L = 500 mm) and reach the collection system. The reforming reactor is equipped with a cable heater to minimize the heat loss from the reactor walls and to sustain the endothermic reactions, and with a steel net to support the catalyst bed. The catalyst used for the experimental tests is a CeO2 promoted bimetallic Ni–Co catalyst supported on γ-Al2 O3 [60]. The plant details are provided in [61]. The pomace mass flow rate is 400 g/h, while for the air flow an Equivalent Ratio of 0.5 is used, corresponding to a flow rate of 300 L/h. All the tests are conducted using the dry olive pomace (DOP) whose main properties are reported in [14]. Proximate composition was determined using a thermogravimetric (TG) method according to the ASTM D5142/02. The ultimate analysis was carried out with an EA3000 (Eurovector, Pavia, Italy) elemental analyzer. The catalyst preparation is described in a previous article [59]. The LHV of the DOP is equal to 17.6 MJ/kg. 3.2. Plant Modelling The whole plant is composed of five sections, as reported in the boxes of Figure 1 where the components are indicated in circles and the streams in squares. In Figure 2, the plant flow chart as resulting from ChemCad modelling is reported.
Energies 2017, 10, 1930
Energies 2017, 10, 1930
6 of 17
6 of 17
Figure 1. ChemCad layout. Legend of components (circles): 1. Tar Separation; 2. Cyclone; 3. Figure 1. ChemCad layout. Legend of components (circles): 1. Tar Separation; 2. Cyclone; 3. Pyrolyzer; Pyrolyzer; 4. Air-biomass mixer; 5. Gasification reactor; 6. Low temperature cleanup and water 4. Air-biomass mixer; 5. Gasification reactor; 6. Low temperature cleanup and water removal; 7. Tar removal; 7. Tar reformer; 8. Syngas compressor; 9. Heat exchanger/thermal user feeding n.1; 10. reformer; 8. Syngas compressor; 9. Heat exchanger/thermal user feeding n.1; 10. Air Gas mixer; 11. Thermal Air Gas mixer; 11. Thermal user n.1; 12. Heat exchanger/rigenerator; 15. Air compressor; 16. user n.1; 12. Heat exchanger/rigenerator; 15. Air compressor; 16. Combustor; 17. Heat exchanger and Combustor; 17. Heat exchanger and MGT regenerator; 18. Compressed air and syngas mixer; MGT regenerator; 18. Compressed air and syngas mixer; 19. Turbine and power generation; 21. Heat 19. Turbine and power generation; 21. Heat exchanger/thermal user feeding n.2; 22. Heat exchanger/thermal user feeding n.2; 22. Heat exchanger/de-humidification air dryer; 23. Wet separator; exchanger/de-humidification air dryer; 23. Wet separator; 29. Thermal user n.2. (only the 29. Thermal user n.2. (only the numbers of the Figure which are correspondent to specific components are numbers of the Figure which are correspondent to specific components are reported in the reported in the legend). legend).
3.2.1. Biomass Drying 3.2.1. Biomass Drying TheThe green boxbox in Figure 1 shows thethe biomass drying section. The COP is supplied with a 50% green in Figure 1 shows biomass drying section. The COP is supplied with a moisture content, and this value is too high to be sent directly to the gasifier, therefore a preliminary 50% moisture content, and this value is too high to be sent directly to the gasifier, therefore a preliminary drying process is required (component 22 of Figure 1). The biomass is dried using
Energies 2017, 10, 1930 Energies 2017, 10, 1930
7 of 17 7 of 17
an air flow having a temperature of22 45of°CFigure and heated the exhaust gases (flow rateflow 31).having The drying process is required (component 1). Theby biomass is dried using an air ◦ humidified of air45 is sent to aheated water by separator to be gases dried.(flow rate 31). The humidified air is sent to a temperature C and the exhaust a water separator to be dried. 3.2.2. Pyrolysis/Gasification 3.2.2. Pyrolysis/Gasification Experimental data at laboratory scale gasifier are used to assess the gasification and reforming section of at thelaboratory model. The gasifier is modelled assuming the flow chartand of Figure 2. Experimental data scale gasifier are used to assess the gasification reforming This of steady-state considers all the assuming depicted processes occurring in the experimental section the model. model The gasifier is modelled the flow chart of Figure 2. This steady-state plants. model considers all the depicted processes occurring in the experimental plants.
Figure 2. 2. Flow Flow chart chart of of the the ChemCad ChemCad model model of of the the gasifier. gasifier. Figure
Biomass gasification takes in different it is necessary to separately model Biomass gasification takes placeplace in different steps,steps, and itand is necessary to separately model pyrolysis, pyrolysis,and combustion gasification phases [40,41]. The pyrolysis is reactors separated two combustion gasificationand phases [40,41]. The pyrolysis is separated into two (tarinto separation reactors (tar separation and pyrolysis) to reproduce the experimental results as close as possible. and pyrolysis) to reproduce the experimental results as close as possible. The biomass is firstly The is firstlyreactor sent to a stoichiometric (Figure 2) where in thetarbiomass is sent to abiomass stoichiometric (Figure 2) where thereactor biomass is decomposed and a solid decomposed in tar and a solid residue, whose defined on the results residue, whose composition is defined based on composition the results ofisolive cakebased experimental tests of [61]. olive cake experimental tests [61]. The stoichiometric coefficients of the first reaction (where tarthe The stoichiometric coefficients of the first reaction (where tar is produced) are extrapolated from is produced) are extrapolated from The by amount the experimental results. The amount of tar inthe theexperimental experimentalresults. tests is 13% weightofof tar the in biomass. tests is 13%molecule by weight biomass. Tar is modelled as a unique molecule of Tarexperimental is modelled as a unique ofof Cxthe Hy O z . The coefficients x, y and z are calculated on the C xHyOz. The coefficients x, y and z are calculated on the basis of the experimental values of tar basis of the experimental values of tar elemental composition reported in Table 1. Consequently, reported in the resulting tar model compound is theelemental resulting composition tar model compound is Table CH1.381.OConsequently, 0.5 . The composition of the biomass, deprived of tar, CH 1.38O0.5. The composition of the biomass, deprived of tar, sent to the second reactor is sent to the second reactor is CO0.9 H1.61 N0.04 . This biomass composition is obtained by balancing the CO 0.9H1.61N0.04. This biomass composition is obtained by balancing the inlet biomass and the inlet biomass and the assumed tar composition. The second reactor (Figure 2), where the pyrolysis assumed tar composition. The second reactor (Figure 2), where pyrolysis biomass of the biomass (deprived of tar) occurs, is modelled as a Gibbs reactorthe and here theof tarthe is considered (deprived of tar) occurs, is modelled as a Gibbs reactor and here the tar is considered as inert inbe as inert in order to avoid is decomposition in the pyrolysis reactor. Since the pyrolysis cannot order to avoid is decomposition in the pyrolysis reactor. Since the pyrolysis cannot be considered an equilibrium process, in order to reproduce the experimental results using Gibbs reactor equilibrium process, in toIn reproduce thethe experimental using Gibbs weconsidered limited thean operating temperature to order 400 ◦ C. this reactor biomass isresults decomposed in light reactor we limited the operating temperature to 400 °C. In this reactor the biomass only is gases, such as CO, CO2 and CH4 and in biochar. The composition of the biochar is assumed decomposed light gases,assuch as CO, CO2 and CH4 and in biochar. The composition of the carbon and ashesin(considered inert). biochar is assumed only carbon and ashes (considered as inert). Table 1. Tar elemental composition as from the experimental test. Table 1. Tar elemental composition as from the experimental test. Element
Element C C H NH ON
% Weight
% Weight 56.13
56.13 6.45 6.45