P. BISWAS et al., Modeling and Simulation for Pressure Swing Adsorption System …, Chem. Biochem. Eng. Q. 24 (4) 409–414 (2010)
409
Modeling and Simulation for Pressure Swing Adsorption System for Hydrogen Purification P. Biswas, S. Agrawal, and S. Sinha* Department of Chemical Engineering, Indian Institute of Technology Roorkee, India
Original scientific paper Received: November 20, 2009 Accepted: October 28, 2010
Pressure swing adsorption (PSA) is a very versatile technology for separation and purification of gas mixtures. Its key industrial application is the production of high purity (99.999 + %) hydrogen. For this, it utilizes different loading capacities of adsorbent at different pressures. Despite tremendous growth in practical applications of this technology, the design of PSA system is more of an experimental basis. The realistic model of a PSA cycle consists of flow rate which varies due to significant adsorption, while the heat effect needs also to be considered due to adiabatic thermal conditions. In this paper, an effort has been made to model and simulate a PSA cycle for hydrogen purification. For this purpose, a system consisting of 4 beds and 8 stages was considered using beds of activated carbon and zeolite. The feed stream was taken as a mixture of CO2, H2, CH4, CO, and N2, which is typical for that used in hydrogen purification. The Newton-based approach was used in solving the model by discretization in space coordinate and time coordinate. The results were then compared for the columns having activated carbon and zeolite packing. Key words: Pressure swing adsorption, layered bed, mathematical modeling, adsorption, purification
Introduction The PSA process for hydrogen purification utilizes different loading capacities of adsorbent at different pressures to separate a gas mixture into its components. The loading capacity of an adsorbent is the amount of gas that can be bound by mass unit of the adsorbent material. The extent to which an adsorbent can be loaded increases in general with the partial pressure of the gas component. When a gas mixture containing hydrogen enters the adsorbent bed at high pressure, most components are moved by the adsorption force to the adsorbent surface and bound to the adsorbent. The adsorbed gas components concentrate on the adsorbent surface while the lighter components, such as hydrogen, are not bound tightly to adsorbent materials, and pass the adsorbent bed without significant interaction. In a dynamic adsorption system, the better adsorbed components move slower through the adsorbent bed than the less adsorbed. By this, the concentration of impurities in processed gas is reduced while flowing through the adsorbent bed, which results in the desired separation of stream components. Commercially available adsorbents are granulates, beads or extrudates. Common to all adsorbent *Corresponding author. E-mail address:
[email protected] Tel.: +91-1332-285648; Fax: +91-1332-276535, 273560
materials is porous structure resulting in large surface. Through these pores, the molecules move to the internal surface, where they are adsorbed. Any adsorbent material has specific binding capabilities for different gas components. Therefore, adsorber beds are designed with up to four layers of different adsorbent materials to separate hydrogen from the mixture of various gases.
Previous studies The original idea of using cyclic pressure variation in adsorptive separation or purification of gases was proposed around 40 years ago. The growth in the research and development of PSA technology has been phenomenal. The first U.S. patent on the subject, authored by C. W. Skarstrom, was granted in 1960. During 1980–2000, more than 600 patents were issued in the U.S. alone, while during 1970–2000 the number of published papers relating to PSA was more than 800. The pressure swing adsorption system (PSA)1–4 in its basic form consisted of two beds, which were alternately pressurized and depressurized according to a programmed sequence. A number of modifications have subsequently been developed based on the Skarstrom cycle, vastly enlarging the area of practical applications of the process.
410
P. BISWAS et al., Modeling and Simulation for Pressure Swing Adsorption System …, Chem. Biochem. Eng. Q. 24 (4) 409–414 (2010)
Due to increasing demand in industry for hydrogen, there has been a growing need to recover hydrogen from steam reformer off gas, catalytic reformer off gas ethylene plant effluent gas, and coke oven gas. H2 separation process was studied by many researchers. Earlier studies were based on one-bed PSA systems.4–6 Several adsorbents were studied for obtaining high purity hydrogen. In a study by Lee and co-workers7–9 it was found that zeolite 5A can well serve the purpose. The design and optimization of multi-bed PSA systems involves an adequate amount of complexity due to the interconnectivity of beds. The first numerical study on multi-bed systems was done by Kumar.10 He used internal stream to purge the used bed instead of product stream and optimized it. An experimental and theoretical study was performed by Yang et al.11 on a 2-bed six-step PSA process using zeolite 5A for bulk separation of binary gases. Several processes have been developed like multi-bed processes12–14 and more recently rapid PSA processes15 to serve the purpose. A paper by Jiang and Biegler (2004) published their simulation and optimization strategies to multiple-bed system which was an extension to their previous work on a single-bed system. They previously studied PSA with parallel implementation of beds. They used accurate sensitivities to determine cyclic steady states with design constraints. More recently, a paper by Biegler et al.16,17 introduces advanced methods involving non linear programming using IPOPT to solve the models for the units that operate in a periodic manner, such as PSA systems.
The energy balance for solid and gas phase, assuming the temperature of the column wall is the same as the temperature of the gas and solid phase (this would decrease computational time) is given as ¶c t ¶ æ ¶T ö ¶T çK l ÷- uc t C m , p + eRT è ø ¶t ¶z ¶z ¶z n é -ê ec t c m , p + (1 - e )( aå c i c m , pi + ë i=1 n
+ r p å q l c m , ads + r pC m , ps ) + +
4 r w c p , w ù¶T ¶c t + ú + (1 - e ) aRT ¶t a w d w û ¶t n
+ r p åQi i=1
¶q l 4a wlU (T - Tatm ) = 0 ¶t aw dw
The pressure gradient across the bed was computed by steady state momentum balance or Ergun’s equation: -
¶p = amu + bru 2 ¶z
a=
150 e(1 - e ) 2 e3 4r p2
(4)
e 2 (1 - e ) 2 2r p e 3
(5)
and
Mathematical modeling
¶x i ö ¶c ¶æ ¶ çeD l c t ÷- e i - ( uc i ) ¶z è ¶z ø ¶t ¶z æ ¶c i ¶q i ö ÷= 0 - (1 - e )ça + rp ¶t ø è ¶t
(1)
(3)
where
b = 175 . The following assumptions were taken while modeling the PSA system: 1. The adsorption rate was considered to be following a linear driving force (LDF) model, with single lumped mass transfer parameter. 2. The flow pattern of gas is axially dispersed plug flow model. 3. Radial temperature and concentration gradients are negligible. 4. Gas components are following ideal gas behavior. 5. Constant porosity along the bed. The component mass balance equation assuming ideal gas is,
(2)
i=1
Adsorption rate into solid phase was considered following LDF model ¶q l = k i ( q *i - q l ) ¶t
(6)
where ki is the single lumped parameter for LDF model and q *i is the adsorbed amount at equilibrium. ki =
Wc Dc rc2
(7)
W c is the LDF factor, W c = ( k s + 1)( k s + 3) where, ks (geometrical factor) is equal to 2, for spherical particles. Equilibrium adsorbed amount is computed from Multisite Langmuir model. Parameters in the model were determined previously by Lopes et al.18 qi q i , max
æ öa i q i ÷ = a i K i pç ç1 - å q ÷ è i , max ø
(8)
P. BISWAS et al., Modeling and Simulation for Pressure Swing Adsorption System …, Chem. Biochem. Eng. Q. 24 (4) 409–414 (2010)
411
Computational algorithm
pres
bed 1
In our study, we simulated a 4-bed, 8-stage system. The column dimensions are given in the Appendix. Two adsorbents were taken (activated carbon and zeolite) and the results were compared. Fig. 1 shows the sequence of stages a bed would follow during a cycle. Fig. 2 displays how the beds would be connected during each step. Connected beds during the same time step are represented by the same shade of grey.
F i g . 1 – Cycle sequence in PSA (8 stages)
feed
bed 2
P2
D1 pres
bed 3 Bd Pg P1 bed 4
D1
D2 Bd Pg P1
feed P2
D1 pres
D2 Bd Pg P1
P2
D2 Bd Pg P1
feed P2
D1 pres
Pressure depressurization I & II ¶yi ¶z ¶yi ¶z ¶T ¶z ¶T ¶z
yi z= 0 = yfeed ¶yi ¶z T
=0 z= L
z= 0
¶T ¶z
= T feed =0
z= L
=0 z= 0
=0 z= L
=0 z= 0
=0 z= L
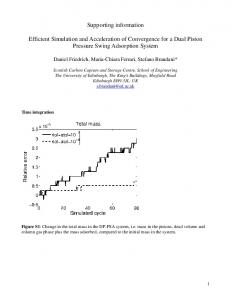
Simulation considered cyclical steady state. Therefore, only one bed was solved assuming all the other beds would have same conditions after a period of time. For the solution, the model equations were discretized in space and time domains using Newton based approach Englezos et al.19 The resulting equations were then solved algebraically. The equations were simulated for a single cycle and then repeated for multiple cycles. It was observed that steady state in the bed (i.e. conditions in the bed would be the same after completing a cycle) was obtained after about 200 cycles. Boundary conditions for various steps are given in the table below:
Equalization blowdown ¶yi ¶z ¶yi ¶z ¶T ¶z ¶T ¶z
z= 0
=0
¶u =0 ¶z z= 0
yi z= L = yfeed ¶T ¶z T
=0 z= 0
z= L
= T feed
T
z= L
¶u =0 ¶z z= L
z= 0
¶T ¶z
=0
¶u =0 ¶z z= L
=0 z= 0
yi z= L = yfeed
=0 z= L
u z= L = 0
=0
¶yi ¶z
z= 0
u z= 0 = 0
¶yi ¶z
Purge
=0
u z= 0 = ufeed
Pressure equalization – pressurization I
feed
F i g . 2 – Cycle sequence of a 4-bed, 8-stage PSA system feed-feedstep, D1-pressure equalization depressurization I, D2-pressure equalization depressurization II, Bd-bowdown, Pg-purge, P1- pressure equalization pressurization I, P1- pressure equalization pressurization I, pres- pressurization
T a b l e 1 – Boundary conditions of steps of PSA Adsorption
D2
=0 z= 0
z= L
= T feed
¶u =0 ¶z z= 0 u z= L = ufeed
Pressure equalization – pressurization II ¶yi ¶z
=0 z= 0
yi z= L = yfeed ¶T ¶z T
=0 z= 0
z= L
= T feed
¶u =0 ¶z z= 0
¶u =0 ¶z z= 0
u z= 0 = ufeed
u z= 0 = ufeed
412
P. BISWAS et al., Modeling and Simulation for Pressure Swing Adsorption System …, Chem. Biochem. Eng. Q. 24 (4) 409–414 (2010)
The equations were solved in a sequential manner for each stage. The output of each stage was retained and used later when connecting step required data for input stream. For example, effluent flow data of stage 2 is the input stream of stage 7 (Fig. 3). Also, the conditions (adsorbed amount, temperature etc.) of the bed at the end of the stage are the initial conditions for the succeeding step.
Results
F i g . 3 – Flow sheet of 8 stage PSA system for single bed
The model was simulated for many cycles until steady state, which was attained after about 200 cycles for both types of bed packing. The variation of concentration of gas components (N2, CO, and CO2) after the feed step along the bed in the steady state are shown in Figs. 4–6. It can be observed that the amount adsorbed is almost the same for activated carbon and zeolite packing. Similar is the case for carbon monoxide.
F i g . 4 – Concentration of N2 in the gas phase along the bed at the end of feed step
F i g . 5 – Concentration of CO in the gas phase along the bed at the end of feed step
P. BISWAS et al., Modeling and Simulation for Pressure Swing Adsorption System …, Chem. Biochem. Eng. Q. 24 (4) 409–414 (2010)
413
F i g . 6 – Concentration of CO2 in the gas phase along the bed at the end of feed step
Conclusion The mathematical model here developed was simulated for packings of activated carbon and zeolite. The steady state for both column types was reached after approximately 200 cycles. The adsorbed amount of the gas components at the end of the feedstep was compared. However, since zeolite is expensive, it is not economic to design a whole column with this packing. Therefore, it would be reasonable to design a column with layers of packing. The first packing can be of activated carbon, which will adsorb N2 and CO from the stream. The next packing of zeolite can then adsorb carbon dioxide and the left over methane. A layer of alumina or silica can also be employed as a first layer to remove any water vapor present in the stream. It is found that water vapor cannot be desorbed easily and therefore could harm the activated carbon and zeolite packings. The future work in this field can be optimizing the size of each layer accordingly with cost analysis to obtain the desired purity of hydrogen. In addition, other packings can be compared in a similar way. Notation
a aw
- particle porosity, dimensionless - ratio of the internal surface area to the volume of
the column wall, m–1 - number of neighboring sites occupied by the adai sorbate molecule in the multisite Langmuir isotherm, dimensionless - bed porosity, dimensionless e Wc - LDF factor, dimensionless Cm,ads- molar heat capacity of component i in the adsorbed phase at constant volume, J mol–1 K–1 - gas phase concentration of component i, mol m–3 ci Cm,p - gas mixture molar heat capacity at constant pressure, J mol–1 K–1 Cm,pi - molar heat capacity of component i at constant pressure, J mol–1 K–1
cp,s
- particle specific heat capacity at constant pres-
sure, J kg–1 K–1 ct - total gas phase concentration, mol m–3 cp,w - wall specific heat capacity at constant pressure, specific heat capacity of material of construction of column wall, J kg–1 K–1 D - column diameter, m Dc - micropore diffusivity of component i, m2 s–1 Dl - axial dispersion coefficient, m2 s–1 dw - internal bed diameter, m ki - single lumped parameter for LDF model, s–1 - geometrical factor ks Kl - thermal axial dispersion coefficient, W m–1 K–1 Ki - equilibrium constant in the multisite Langmuir isotherm, Pa - column length, m L - pressure, Pa p - bulk gas mixture density, kg m–3 r rp - particle density, kg m–3 rw - wall density, density of material of construction of column wall, kg m–3 - volume flow rate, m3 h–1 Q Qi - heat of adsorption of component i, J mol–1 - particle averaged adsorbed concentration, mol kg–1 qi - adsorbed concentration in equilibrium, mol kg–1 q*i qmax,i - specific saturation adsorption capacity in the multisite Langmuir isotherm, mol kg–1 - gas constant, J mol–1 K–1 R - particle radius, m rp - microparticle radius, m rc - gas phase temperature, K T Tatm - ambient temperature, K - time, s t - overall heat transfer coefficient, W m–2 K–1 U - superficial velocity, m s–1 u - bulk gas mixture viscosity, kg m–1 s–1 m - component i molar fraction, dimensionless yi - axial position, m z
414
P. BISWAS et al., Modeling and Simulation for Pressure Swing Adsorption System …, Chem. Biochem. Eng. Q. 24 (4) 409–414 (2010)
Appendix
2
column diameter, D/m
0.2
bed porosity, e
0.38
heat of adsorption of component i, Qi, J mol–1
activated carbon/zeolite
adsorbent wall density, rw /kg m–3
aw/m–1
195
aw1/m–1
197
mole fraction, y/– volume flow rate, Q/m3 h–1
Zeolite
0.566
0.503
842
1126
709
920
1.17 · 10–3
0.85 · 10–3
axial dispersion coefficient, Dp/m2 s–1
CO2: 3.43 · 10–6 H2: 4.99 · 10–6 CH4: 3.06 · 10–6 CO: 3.01 · 10–6 N2: 3.02 · 10–6
CO2: 3.43 · 10–6 H2: 4.99 · 10–6 CH4: 3.06 · 10–6 CO: 3.01 · 10–6 N2: 3.02 · 10–6
Dc / rc2/s–1
CO2: 1.24 · 10–2 H2: 8.89 · 10–2 CH4: 3.96 · 10–3 CO: 2.11 · 10–2 N2: 2.29 · 10–2
CO2: 1.87 · 10–4 H2: 9.23 · 10–2 CH4: 1.04 · 10–2 CO: 4.22 · 10–3 N2: 2.13 ·10–2
0
0
CO2: 3 H2: 1 CH4: 3.5 CO: 2.6 N2: 4
CO2: 2.1 H2: 1 CH4: 2 CO: 2.6 N2: 2.4
specific saturation adsorption capacity in the multisite Langmuir isotherm, qmax,i/mol kg–1
CO2: 7.855 H2: 23.565 CH4: 6.7329 CO: 9.0634 N2: 5.8913
CO2: 4.525 H2: 9.954 CH4: 4.976 CO: 3.828 N2: 4.148
equilibrium constant in the multisite Langmuir isotherm, Ki/Pa
CO2: 2.125 · 10–11 H2: 7.233 · 10–11 CH4: 7.904 · 10–11 CO: 2.68 · 10–11 N2: 23.46 · 10–11
CO2: 11.11 · 10–11 H2: 50.76 · 10–11 CH4: 35.65 · 10–11 CO: 3.937 · 10–11 N2: 30.83 · 10–11
defaultradius rp /m
overall heat transfer coefficient, U/W m–2 K–1 number of neighboring sites occupied by the adsorbate molecule in the multisite Langmuir isotherm, ai
CO2: 35965 H2: 9231 CH4: 20643 CO: 29733 N2: 20413
Pressure, p/Pa
Activated Carbon
specific heat capacity cp,s/J kg–1 K–1
CO2: 29084 H2: 12843 CH4: 22701 CO: 22577 N2: 16263
Temperature, T/K
Particle specifications:
density rp/kg
0.452
Feed conditions: 500
m–3
0.452
8340
wall specific heat capacity, cp,w/J kg–1 K–1
porosity, å
Zeolite
thermal axial dispersion coefficient, Dl/W m–1 K–1
Column specifications: column length, L/m
Activated Carbon
303 7 · 105 CO2: 0.17; H2:0.72; CH4:0.035; CO: 0.03; N2:0.03 12
References 1. Ruthven, D. M., Farooq, S., Knabel, K. S., Pressure Swing Adsorption, VCH Publishers, New York, 1994. 2. Ruthven, D. M., Principles of Adsorption and Adsorption Processes, John Wiley, New York, 1984. 3. Yang, R. T., Gas Separation by Adsorption Processes. Butterworths, Boston, 1987. 4. Yang, R. T., Doong, S. J., AIChE J. 31 (1985) 1829. 5. Doong, S. J., Yang, R. T., AIChE J. 33 (1987) 1045. 6. Cen, P., Yang, R. T., Ind. Eng. Chem. Fundam. 25 (1986) 758. 7. Yang, J., Han, S., Cho, C., Lee, C. H., Lee, H., Sep. Technol. 5 (1995) 239. 8. Yang, J., Lee, C. H., AIChE. J. 44 (1998) 1325. 9. Jee, J.-G., Kim, M.-B., Lee, C.-H., Ind. & Engg. Chem. Res. 40 (2001) 868. 10. Kumar, R., Ind. Eng. Chem. Res. 33 (1994) 1600. 11. Yang, J., Lee, C. H., Chang, J. W., Ind. Eng. Chem. Res. 36 (1997) 2789. 12. Batta, L. B., Island, G., US Patent 3564816, Selective adsorption process, 1971. 13. Yamaguchi, T., Kobayashi, Y., US Patent 5250088, Gas separation process, 1993. 14. Fuderer, A., Rudelstorfer, E., US Patent 3986849, Selective adsorption process, 1976. 15. Golden, T. C., Weist Jr, E. L., Novosat, P. A., US Patent Application Publication 2006/0236862, Adsorbents for rapid cycle pressure swing adsorption processes, 2006. 16. Biegler, L. T., Jiang, L., Fox, V. G., Comp. & Chem. Engg. 29 (2004) 393. 17. Biegler, L. T., Jiang, L., Fox, V. G., AIChE J. 49 (2003) 1140. 18. Lopes, F. V. S., Ribeiro, A. M., Grande, C. A., Loureiro, J. M., Rodrigues, A. E., Transport and adsorption properties of second set of commercial available sorbent materials, Hy2Seps Report, 2007. 19. Englezos, P., Kalogerakis, N., Applied Parameter Estimation for Chemical Engineers, CRC Press (2000).