Modeling and Simulation of Inventory Management System of Artistic Printing Enterprise Tesfaye Gashaw1, Kassu Jilcha1, Eshetie Birhan1 1Addis
Ababa University, Addis Ababa Institute of Technology, Addis Ababa, Ethiopia
[email protected],
[email protected],
[email protected]
Abstract.
The purpose of this study is to utilize arena software and solve the problem of inventory and utilization of resources problem. It is also to apply simulation in the design of an inventory control based on managing beginning inventory, number of orders as well as the utilization of resources in the printing process. Modeling of the management on inventories has its own role for sound economic system of a company. Because mathematical models cannot accurately describe the complex system, simulation models are used. In preliminary research a simulation model is built and optimized to obtain the best strategy in combining inventory decision making and demand forecasting for intermittent demand when there is only uncertainty in demand like the case company. The printing process performance of the company is taken into account in optimizing the inventory related costs as final output. Keywords: Printing Process, Arena simulation, Inventory Management, Process performance
1
Introduction
Simulation is the imitation of the operation of a real-world process or system over time. Simulation involves the generation of an artificial history of the system and the observation of that artificial history to draw inferences concerning the operating characteristics of the real system that is represented. It is an indispensable problem solving methodology for the solution of many real world problems. It is used to describe and analyze the behavior of a system, ask what-if questions about the real system, and aid in the design of real system. Both the existing and conceptual systems can be modeled with simulation [4]. Arena uses an entity-based, flowcharting methodology for modeling dynamic processes. Most other commercial simulation products are code-based and require programming in proprietary scripting languages, and many simulation products force you concentrate primarily on animating a process rather than documenting it.
Arena is a Visio-compatible, flowcharting tool. Entities in an Arena model proceed through a flow chart of the process and seize control of resource capacity as they are processed. The flowchart approach to model building makes the most sense to engineers and to process designers who must be able to carefully document a process in order to accurately model it and analyze it. This results in models that become highly detailed documents of the processes being studied. With the entry of more and more companies in the market offering similar products, the market share of existing organizations has reduced. Every new entrant comes with new ideas, techniques and technologies. The market then witnesses competition in every function of the organization. Many Organizations are now directing their efforts towards retaining existing customers to increase profits. Inventory Analysis has, therefore, attained limelight considering the investments involved in maintaining and managing Inventories. It has been observed that an increase in the profits is possible through reduction of losses due to Inventory Mismanagement.[3] In Inventory control, to provide efficient service to customers the problem of determining the optimal replenishment policy arises .The use of simulation enables a manager to provide an insight into certain managerial problems where analytic solutions of a model is not possible or where the actual environment is difficult to observe [1]. Design problems in production lines are primarily resource allocation problems. These problems include workload allocation and buffer capacity allocation for a given set of workstations with associated processing times. Generally, design problems are quite difficult to solve in manufacturing systems. This is due in part to the combinatorial nature of such problems. Performance analysis of production lines strives to evaluate their performance measures as function of a set of system parameters. The most commonly used performance measures follow: throughput, average inventory levels in buffers, downtime probabilities, blocking probabilities at bottleneck workstations and average system flow times (also called manufacturing lead times). Using these measures to analyze manufacturing systems can reveal better designs by identifying areas where loss of productivity is most harmful [7].
Inventory management provides a flexibility and certainty to production and sales activities. Beside advantages in holding inventory, other side of a coin is that it can become very costly segment of a supply chain. Inventory management problems are characterized by holding costs, shortage costs, replenishment delays and probabilistic demand distributions for products. Inventory costs are just one group of total supply chain costs and they encompass ordering costs, holding costs and shortage costs (that occur if demand exists, but the product is out of stock). The deterministic inventory models are limited because they treat all parameters relating to future operations as certain. The major sources of uncertainty include demand over the delivery lead time and the length of the lead time [8]. Many companies fail each year due to inadequate control of their inventory. Inventory could be classified as raw materials (e.g., components, fuels etc.) used to manufacture products, finished products, ready for final users or Work-in-Progress (WIP) that is, partly finished goods and materials, sub-assemblies etc. held between manufacturing stages. Inventory problems can also arise if too few items are held in inventory, resulting in loss of profits due to loss of sales and due to loss of goodwill consequent upon the unfilled demands. Stock out (that is, cost due to lack of goods demanded) may result incurring additional manpower and/or costs, actual cost to replenish inventory stock may be excessive because stock must be ordered frequently and the manufacturing plant being shut down as a result of lack of raw materials to work with. As with any other investment, the cost of holding stock must be related to the benefits to be gained. Hence the following costs are associated with inventory: carrying cost or inventory holding cost, ordering costs and stock out costs. Another important element of inventory control is called reorder point. Businesses need to think ahead and calculate the best time for reordering products. Doing so too soon may cause financial difficulties or running out of space [9]. In inventory control, the problem of determining the replenishment policy due to uncertain demand and lead time can be solved by simulation. Instead of trying manually the three replenishment alternatives for each level of demand and lead time for a period of one year and then selecting the best one, we process on the computer and obtain the results in a very short time at a small cost. During the past many years simulated models in inventory management are discussed by many researchers. Donald.L.Byrkett[11]demonstrated the use of simulation in the design of a forecasting and inventory control system. The use of alternate approximate modeling strategies was simulated using an analytic simulation model of the real system on a relatively large sample of parts. A simulation based decision support system for multiproduct inventory control management is developed by Masood.A.Badri [12]model in this system permits the management to obtain an inventory system wide view of the effect of changes in decision variables on the performance measures of a furniture manufacturing firm. Research on inventory control simulation by Adegoke, Aimufua and Jegede [9] aims at simulating the inventory control considering the economic order quantity. The Researchers showed the optimization of total cost using appropriate order quantity. The other research by Susanto, Almunawar, Aksoy and Chee Tuan [13] showed simulation on automotive inventory and stock issue, followed by evaluated performance of automotive Sector Company, focused on getting optimum profit from supply and
demand balancing. The paper evaluated the performance of the service and the inventory control in using cars. This study on Modeling Inventory Management System at Distribution Company [14] focused on application of different modeling approaches in inventory management under uncertain demand, namely inventory models, simulation models and optimization model. The researcher presented the use of optimization approaches together with simulation. Once the optimization solution is found, the system performance under the optimized value can be tested by means of simulation model.
2
Material and Methods
This paper is done using Rockwel simulation software ARENA to simulate the inventory management as well as printing process of the Enterprise. The methods used in modeling and simulating the systems are: Participants: Five operators and two shift leaders are participated in the data collection and discussion. Methodology of measurement: data collection is done in different shifts and stop watch is used in measuring the processing time. Sampling method is adopted to get a better result. Data are collected on customer arrival, demand of customers, printing, and page arrangement, binding, trimming and packaging processing times per book. Literature Survey: In order to give an insight about the work, literature review is prepared in a most comprehensive manner. Data Collection: The study was done by using primary data and secondary data: Primary data (Physical observation, Preparing interviews and questionnaires related to the work, Discussion with employees) Data Analysis and Presentation of the Findings: the collected data are organized and analyzed using ARENA simulation software to find important parameters. Then the findings are interpreted more precisely.
3
Discussion and Results
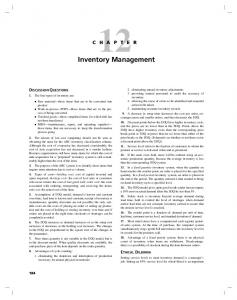
The modules required for the modeling of inventory management and printing processes are: create, assign, hold, decision, process, record and dispose module. The results of the simulation based on their respective models are: 3.1
Inventory Management Model
The inventory management of the company is determined by the level of inventory, demand, order placed. The report of simulation run of replication length 10000 hrs shows that the raw material requirement 14912.62 kg to print 64584 books. The number of customers during the replication length is on average 773. The determination of the quantity of order and the beginning raw material inventory can be done with trial and error using process analyzer.
R_ Ra w m a t e ri a l
J o b Arri v a l
Cu s t o m e r De m a n d
0
Up d a t e I n v e n t o ry
Tr ue
Ch e c k Ra w M a te ri a l ?
0 0
0
Ch e c k Ra w M a te ri a l Tr ue In v e n to ry ?
0
Fals e
Pri n t i n g
Ex i t
0
Fals e
Pl a c e Ord e r
INVENTOR Y MANAGEMENT
Ra w M a t e ri a l
Sh a l l we Pri n t?
0
Bo o k Pri n t i n g
0
De d u c t I n v e n t o ry
Ch e c k De m a n d ?
Tr ue
0 0
Fals e
St o p Pri n t i n g
PR INTING PR OCESS
Fig. 1. Inventory management and printing process model
3.2
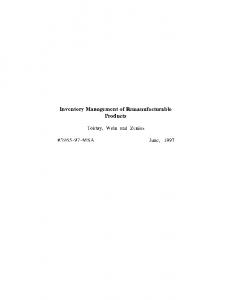
Printing Process Model
The utilization of resources (machines and operators) shows the rate at which the resources be busy during the simulation time. Minabinda machine utilization is about 48% busy in the aforementioned simulation run length. The operators in page arrangement process operate with 62%. The other results are depicted in Appendix D Generally, the report shows that the resource utilization of machines as well as operators are very low. Since the machines are old and there is no proper preventive maintenance schedule, the failure of machines influences the process utilization and efficiency. The simulation report shows Number of Reworks 31492.00 and number of Scraps 38132.00. This shows that the enterprise has to make quality control in every process, this will in turn decreases the final scrap and rework level otherwise.
Pri n ti n g Ra w M a te ri a l
Arri v a l Ti m e
we b Pri n ti n g
Pa g e Arra n g e m e n t
0
0
Bi n d i n g
0 Nu m b e r o f re wo rk s
Pa c k a g i n g a n d Labeling Tri m m i n g
Di s p o s e 1
C hec k Q uality of book ?
0 0
0
Nu m b e r o f Sc ra p s
Ta l l y Fl o w Ti m e
Ta l l y In te rd e p a rtu re ti m e Co u n t Pro c e s s Ti m e
Els e 89 5
Detail Printing Process of Books
Fig. 2. Detail printing process of books
3.3
Decision variables
The decision variables in the paper are reorder level, quantity of order placed, safety stock as well as the mean repair times. 3.4
Data Analysis
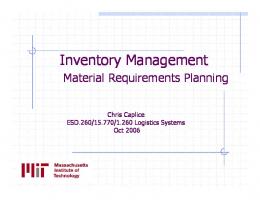
Data collection is done for estimating model input parameters. The sequence of processes, the processing time, and demand of books, the failure rate of machines, the reorder level, safety stock and the required resources are collected during printing process. The inputs of the collected data are analyzed with input analyzer of Arena to determine the distribution of these parameters. The fitness of these data is determined by taking the smallest squared error of the distributions.
Operation: Web Offset machine process
Distribution: Triangular Expression: TRIA(15.5, 19, 20.5) Square Error: 0.011474 Fig. 3. Distribution fitness
Fig. 4. Types of Distribution Operation: Trimming processing time distribution
Distribution: Beta Expression: 14.5 + 3 * BETA (1.15, 1.32) Square Error: 0.000240 Table 1. Processing and Arrival Time Distributions
SN
Operation
1 2
4 5
Customer arrival Customer Demand Distribution Web Offset machine process Page arrangement Binding
6
Trimming
Beta
7
Packing and labeling
Beta
3
3.5
Distribution Uniform Uniform
Expression
Square Error
UNIF(5,8) UNIF(8000,120000)
0.010000 0.064444
Triangular
TRIA(15.5,19,20.5)
0.011474
Uniform Beta
UNIF(35,39) 22.5 + 10 * BETA(1.74, 1.81) 14.5 + 3 * BETA(1.15, 1.32) 19.5 + 4 * BETA(0.982, 1.16)
0.037778 0.045411 0.000240 0.024040
Model assumption
Important assumptions considered in this simulation case: Lead time is known and constant, Receipt of inventory is instantaneous and complete Quantity discounts are not possible Only variable costs are setup and holding 3.6
Model Verification
During the model translation, it is ensured that the simulation model has all the necessary components and that the model actually runs and checked the model operates as intended. The verification process on the simulation model is done by trace and animation techniques. Moreover formulation of input parameters was checked to build the model correctly. Verification techniques adopted for this model: Test with various combinations of input parameter values Use ”trace”, or step-by-step execution
Observe the animation
Throughput Verification. The verification of the model can be done considering the estimated throughput, 𝐷(𝑟) 𝛿(𝑟)1 = , where 𝛿(𝑟)1 is throughput estimator for a given replication r 𝑇(𝑟)
D(r) is the number of jobs processed to completion during replication r, and T(r)is the length (duration) of replication r. Hence from the simulation report, D(r)=599,913 and T(r)=10,000, the throughput estimator is 59.99 jobs per hour. Another alternative estimate of the throughput using the mean inter-departure time from the Tally is calculated as: 1 𝛿(𝑟)2 = 𝐸(𝐼𝑛𝑡𝑒𝑟𝑑𝑒𝑝𝑎𝑟𝑡𝑢𝑟𝑒 𝑡𝑖𝑚𝑒) The simulation report of inter departure time is 0.01779762, hence the throughput estimator, 1 𝛿(𝑟)2 = =56.17978 0.01779762 The above calculated throughput estimators are close to the initial value of arrival rate i.e. 60 jobs per hour. Consequently, these verification facts support the contention that the model is correct. 3.7
Model Validation
Validation assesses how realistic the modeling assumptions are, by comparing model performance metrics (predictions), obtained from model test runs, to their counterparts in the system under study. Simulation trials were done using process analyzer and the closeness to the real data collected was checked to validate the model whether it was a correct built model. Validation activities are critical to the construction of credible models. The standard approach to model validation is to collect data (parameter values, performance metrics, etc.) from the system under study, and compare them to their model counterparts. Model validation that has been followed are: The results of the simulation model were discussed with the experts of the enterprise who are experienced in this printing process. The printing and inventory management systems structure and operation is verified with users/operators of the actual system. The model input of raw materials with the output of the model is compared and it shows a good closeness with small variation. 3.8 Number of Replications It is better to determine the number of replications for a precise simulation result. Since the individual replication results are independent and identically distributed, the confidence interval for true expected performance is calculated as:[15] 𝑆 𝑋̅ + 𝑡𝑛−1,1−𝛼 2 √𝑛
Where 𝑋̅ is sample mean, S isis standard deviation, n is the number of replications and 𝑡𝑛−1,1−𝛼 is the upper critical point from students t-distribution with n-1 degree of free2
dom. Set half-width = h
n
t n211 , / 2
s2 h2
Considering the minimum half width of h=0.3 and 95% confidence interval α=0.05, Table 2. Comparison of replications Result
Number of Replication 1 2 3 4 5 6 7 8 10 Average Standard deviation
Simulation Result 1540 1541 1541 1542 1541 1541 1540 1540 1539 1540.8 1.48
From the t- distribution table, the value of t for df =9 and 0.025 area in the right tail is 2.262. Hence the number of replications will be 125.
4
Conclusion
Simulation should be seriously considered and favored as a very important tool for the industry especially, in the area of inventory control. Simulation is a universal and important tool because it promotes automation and the success of industrialization depends largely on it. Stock control should be embraced by every organization so as to minimize operating costs. Inventory control usually ensures effective and efficient utilization of assets of an organization, such as, raw materials, components, spare parts, tools, work-in-process, consumables etc. and also paves way for the creation of valuable and quality product on schedule and at minimum cost. The paper on inventory management simulation evaluates the existing printing process and inventory management of the enterprise. Based on the results of the simulation runs, it is concluded that:
the utilization of resources is very poor due to improper preventive maintenance schedule and stock management The quantity order is not placed considering the holding and set up costs, i.e. order is placed when there is demand that leads to longer time for delivery of prints. the bottleneck has been identified with low utilization and high waiting line there is no modern management system implemented that can improve the productivity of the process and the inventory management system
5 1. 2.
3. 4. 5.
6. 7. 8. 9. 10. 11.
12. 13. 14. 15.
References Neetu:Simulation and its Applications in Inventory Control, Department of Mathematics, APJ College of Fine Arts, Jalandhar Katrien Ramaekers, Gerrit K.Janssens: Modelling the Complexity of Inventory Management Systems for Intermittent Demand using a Simulation-optimization Approach, Hasselt University, Belgium Aarti Deveshwar, Deen Bandhu Chhotu Ram: Inventory Management Delivering Profits through Stock Management, University of Science and Technology, India Jerry Banks: Handbook of Simulation Principles, Methodology and Advances, 1998 John Wiley & Sons,Inc. Committee on Modeling and Simulation Enhancements: Modeling and Simulation in Manufacturing and Defense Acquisition: Pathways to Success,2002, National Academy of Sciences Christopher A.Chung: Simulation modeling handbook, 2004 CRC Press Tayfur Altiok, Benjamin Melamed: Simulation Modeling and Analysis with ARENA,2007, Elsevier Inc. Mleksandra Marcikic,Boris Radovanov: Simulation in inventory management, Faculty of Economics Subotica ,University of Novi Sad, Serbia G.K. Adegoke, G.I.O. Aimufua and A.J. Jegede: Computer Modeling and Simulation for Inventory Control , 2012 http://www.stats.gla.ac.uk/steps/glossary/probability_distributions.html#unifdistn D.L.Byrkett : Use of simulation in the design of an inventory control system. Proceedings of the 10th conference on winter simulation-Volume 2,IEEE computer society Press Los Alamitos,USA ,1978 Masood.A.Badri : A Simulation Model for Multi-Product Inventory Control Management, United Arab Emirates,1999 Susanto, Almunawar, Aksoy and Chee Tuan:A Simulation Approach Paradigm: An Optimization and Inventory Challenge Case Study,Indonesia,2012 Oksana Soshko: Modelling Inventory Management System at Distribution Company, Riga Technical University,2010 David Kelton, Simulation with Arena, second edition, Mc Graw Hill